HYDAT-A HYPERSPECTRAL DATA PROCESSING TOOL FOR FIELD
SPECTRORADIOMETER DATA
Shalini Singha, Dibyendu Duttaa*, Upasana Singha, Jaswant Raj Sharmab, Vinay Kumar Dadhwalb a
Regional Remote Sensing Centre – East (NRSC), New Town, Kolkata, West Bengal, INDIA – [email protected], [email protected], [email protected]
b
National Remote Sensing Centre, Balanagar, Hyderabad - [email protected], [email protected]
Technical Commission VIII
KEY WORDS: Spectroradiometer, Data Processing Tool, MATLAB, Absorption Feature, Spectral Indices, Spectral Geometry
ABSTRACT:
A hyperspectral data processing tool ‘HyDAT’ has been developed in MATLAB environment for processing of Field Spectroradiometer data for vegetation studies. Several basic functions e.g. data visualization, pre-processing, noise removal and data transformation and features like automatic absorption feature recovery and their characterization have been introduced. A new concept of spectral geometry has been included as a separate module which is conceptualized as triangle formed over spectral space joining the vertices of green reflectance peak, red well and inflection point and is extremely useful for vegetation health analysis. A large variety of spectral indices both static and dynamic, have been introduced which is useful for remote estimation of foliar biochemicals. Keeping in view the computational requirement, MATLAB was used in the programming environment. It has various in-built functions for statistical and mathematical analysis, signal processing functions like FFT (Fast Fourier Transform), CWT (Continuous Wavelet Transform), direct smoothing function for moving average, Savitzky-Golay smoothing technique, etc. which can be used with ease for the signal processing and field data analysis. FSF (Field Spectroscopy Facility) Post processing Toolbox can also be freely downloaded and can be used for the direct importing and pre-processing of Spectroradiometer data for detector overlap correction, erroneous water band removal and smoothing. The complete package of the software has been bundled for standalone application of shared libraries with additional files for end users. The software is powered by creation of spectral library and customized report generation. An online help menu guides the user for performing different functions. The tool is capable of reducing the time required for processing field based hyperspectral data significantly and eliminate the need for different software to process the raw data and spectral features extraction.
1. INTRODUCTION
Hyperspectral sensors acquire object information in large number of narrow and contiguous spectral bands in the visible and infra-red region. Contiguous spectral signatures generated from hyperspectral data allow detailed analysis through the detection of surface materials and their abundances. Due to continuity of bands and narrow sampling bandwidth it becomes possible to apply several mathematical methods, such as derivative analysis (Becker et al, 2005) and continuum removal (Kokaly and Clark, 1999) which are pre-requisite for spectral feature recovery and characterization. Major challenges in hyperspectral data processing include noise reduction, recovery of subtle absorption features, spectral matching analysis, classification and creation of library spectra that can guide spectral classification. Several software and customized toolboxes are available to process hyperspectral images. The best known commercial product is the Environment for Visualizing Images (ENVI). ENVI provides code extensibility through the Interactive Data Language (IDL), allowing the possibility for routine and features expandability. MultiSpec was developed on MATLAB, provides similar features to ENVI but does not provide extensibility. Some of the other available hyperspectral data processing tools include MicroImages, Spectronon and SpectrononPro, MultiSpec, Hyperspectral Image Analysis Toolbox (HIAT), Hypertools Toolbox, Hyperactive and Tetracorder for analysis of hyperspectral data acquired from satellite sensors. Tetracorder is a software tool for imaging spectroscopy regarded as a collection of algorithms including spectral matching algorithm. Out of all HIAT,
Hypertools and Hyperactive is built using MATLAB graphical user interface, PRTools toolbox and MATLAB Statistics Toolbox. HIAT is a collection of functions that extend the capabilities of the MATLAB numerical computing environment where user can utilize different image processing methods. Hypertools contains algorithms for visualization, pre-processing, representation and classification of spectral data. The Graphic User Interface of Hyperactive can display multi-dimensional data and analyze it by running different combinations of clustering methods and distance measures. Although several hyperspectral image analysis tools for field Spectroradiometer data analysis have been developed, their availability is restricted to the common users. Besides neither of the available tools contain all the facilities that include data ingestion in native format, noise removal, calculation of static and dynamic indices, spectral geometric analysis, characterization of absorption features and generation of library spectra. In the present study Hyperspectral data analysis tool (HyDAT), especially to cater the need for vegetation analysis, have been developed. A novel concept of spectral geometric analysis have been introduced in the toolbox wherein the properties of the triangle, formed in the spectral space joining green peak, red well and inflexion point, can be estimated. The properties of the triangle provide valuable information about vegetation health condition. The tool also enables static and dynamic index calculation based on the most sensitive bands responsible for spectral absorption. Recovery of absorption features have been provided based on derivative and continuum removed spectra. The tool generates report as per the requirement of the user.
The International Archives of the Photogrammetry, Remote Sensing and Spatial Information Sciences, Volume XL-8, 2014 ISPRS Technical Commission VIII Symposium, 09 – 12 December 2014, Hyderabad, India
This contribution has been peer-reviewed.
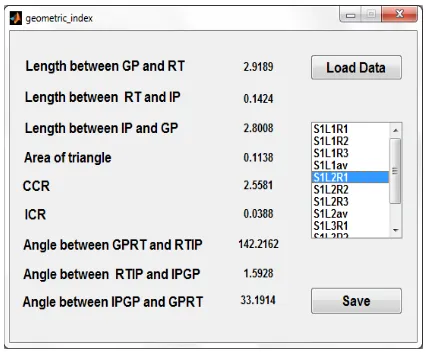
Figure 3. Display of Spectral Profile for Defined Range 2. MATERIALS AND METHODOLOGY
2.1 Software Used
MATLAB-10 later version and additional toolboxes viz. Digital Signal processing Toolbox, Signal processing Toolbox and FSF Post Processing Toolbox.
2.2 Work Flow
Figure 1 describes the flow of development of the tool for analysis of field based Spectroradiometer data. The development process started with content generation and the designing of different Graphical User Interface of submenus. After designing the GUI is programming of each GUI is done. A Callback is written for each components of GUI which will be executed on selection of the component.
2.3 MATLAB Graphical User Interface and Design Process
The MATHWorks was used that provide a set of event driven components in the form of user interface controls (uicontrols) and user interface menu (uimenu). Both were combined to form a GUI which provides an easy communication between user and software. In the design process the layout of the idea was drawn and on the basis of that GUI was formed. Design was tested and when it is completed, coding of the GUI was started. After checking code and GUI connectivity, code was tested whether it is working accordingly or not. User interface controls were created using UI control elements with the purpose of performing an action or setting up the options for a future action. The action was executed or the option was set when the user selects the uicontrol with the mouse pointer. The uicontrols used include ‘edit’, ‘frame’, ‘popup’, ‘listbox’, ‘pushbutton’, ‘static’, and ‘Uicontrol’.
2.4 Creation and Installation of Executable MATLAB File
Executable files can be made by using MATLAB installer along with MATLAB software. The MATLAB Compiler Runtime (MCR) is an execution engine made up of the same shared libraries that MATLAB uses to enable the execution of MATLAB files on systems without an installed version of
MATLAB. At the time of packaging, MCR (MATLAB Compiler Runtime) can be added along with .exe file. This option physically copies the MCR installer in package. To install the .exe file of HyDAT in other machine, first MCR is installed on that machine and then the software is ready to use.
3. DESCRIPTION OF TOOLS AND MENU
The tools are consisted of various modules like ‘file’, ‘edit’, ‘view’, ‘data pre-processing’, ‘data validation’, ‘visualization’, ‘linear indices’, ‘spectral geometric parameters’, ‘derivative analysis’, ‘continuum removal’, ‘spectral absorption feature analysis’, ‘spectral library generation’ and ‘online help’ documentation. The detail description of various menus is described below.
3.1 File Open, Edit and View Menu
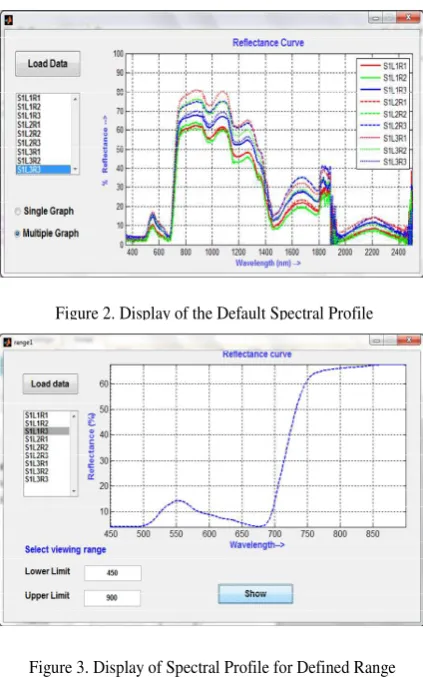
The ‘File’ menu provides common options like Open, Save, Save as, Import, Export, and Exit. The file to be opened can be either in excel format or in native format (.sig) of ASD Spectroradiometer. Other formats are also supported and can be imported by using import sub-menu. The sub-menus of ‘Edit’ menu includes Undo, Redo and Delete functions. In data ‘View’ menu the entire spectral range either as single or multi-graph (Figure 2) or a sub-set of it can be viewed by physically entering of starting and ending wavelength (Fig. 3).
3.2 Pre-processing Menu
This menu consists of 3 sub-menus e.g. ‘Check value’, ‘Smoothing’ and ‘Averaging’. The ‘Check value’ removes the outliers from the data (0 or negative values). In ‘Smoothing’
Figure 2. Display of the Default Spectral Profile Figure 1. Flowchart for Tool Development Process
!
" # $
% &## '
( )"*+
" )
The International Archives of the Photogrammetry, Remote Sensing and Spatial Information Sciences, Volume XL-8, 2014 ISPRS Technical Commission VIII Symposium, 09 – 12 December 2014, Hyderabad, India
This contribution has been peer-reviewed.
function SG filtering (Savitzsky Golay, 1964) and Moving Average with variable length is provided. The filtered data is stored as a separate file. In the viewer both the raw and filtered data can be visualized (Fig. 4).
3.3 Analysis Menu
This menu contains five sub-menus for calculation of hyperspectral vegetation indices, spectral geometric parameters, spectral derivatives and characterization of spectral absorption features from continuum removed spectra (Figure 5).
3.3.1 Linear indices: Linear indices include greenness index, indicators for light use efficiency, canopy nitrogen content, dry or senescent carbon, leaf pigment and canopy water content. Each of the linear indices cotains two sub-menus viz. static and dynamic indices (Figure 6). Static indices are calculated based on the band locations from published literatures and are pre-defined. Whereas in dynamic indices the bands can be selected based on the visual interpretation of the spectra and specific to dataset being used. After user entry result is displayed.
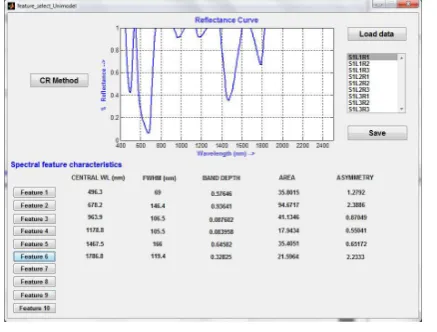
3.3.2 Spectral Geometric Parameters: Spectral geometry is based on the triangle formed over spectral space by joining the green reflectance peak, red absorption well and inflection point i.e. point of maximum slope between red absorption well and infrared shoulder. Triangle properties that can be calculated include its side, area, angles, circumscribe circle radius (CCR) and inscribe circle radius (ICR). The output of the routine can be displayed in the ‘Geometric Parameter’ window (Figure 7) and can be saved in separate file.
3.3.3 Derivative Analysis and Continuum Removal: Derivative analysis enhances the subtle absorption features, caused by pigment and/or water molecules, for diagnosis. Users need to provide the order of derivative to perform, the result of which will be stored in a separate file. From the derivative analysis output various derivative indices can further be calculated. Continuum removal, or baseline normalization, is a method commonly used to normalize reflectance spectra in order to allow comparison of individual absorption features from a common baseline (Kokaly, 2001) and also emphasizes the location and depth of individual absorption features. The edges of the absorption features are chosen such that the deepest absorption is located approximately at the centre of the continuum removed region. The continuum removal can be applied on the entire spectra or on selective ranges. Provision has been kept to select number of features for which continuum will be removed and displayed.
3.3.4 Spectral Feature Characterization
One of the prerequisite for feature characterization is recovery of the absorption features correctly in terms of location, depth and width of the feature. The features calculated include ‘band depth maxima (BDmax)’, wavelength at which band depth
Figure 7. Geometric Parameter Figure 4. Spectral Curve Before and After SG Filtering
Figure 5. Analysis Menu
Figure 6. Static and Dynamic Index Calculation Window
The International Archives of the Photogrammetry, Remote Sensing and Spatial Information Sciences, Volume XL-8, 2014 ISPRS Technical Commission VIII Symposium, 09 – 12 December 2014, Hyderabad, India
This contribution has been peer-reviewed.
maxima occurs (λBDmax), ‘full width at half maximum (FWHM)’, area under curve normalized to band depth maxima (ANMB) and the ‘skewness’. Once the data is loaded from ‘Load Data’ radio button, 10 major features are analyzed (Figure 8) and their properties are saved as separate text file.
3.4 Customized Report Generation
The results of various analysis e.g. linear indices, properties of spectral triangle and spectral features can be saved using ‘Save’ button. By clicking on ‘Save’ button the output can be saved in text file which is automatically appended. The output file consists of filename, name of the module used and the results of analysis.
3.5 Spectral Library Builder
HyDAT has provision to create its own library with metadata information. This menu can read the header info from ‘.sig’ file or can be created as a new signature along with metadata information. The metadata information includes instrument name, type of lens used, location, place, date, time, sky condition, sensor height, sun angle, scientific name of the plant, age of the plant, canopy/leaf observation and vegetation health.
4. DISCUSSION AND CONCLUSION
Field based spectroscopic analysis generates large volume of spectral data. Currently limited number of software is available for comprehensive analysis of Field based spectroradiometer data including pre-processing, recovery of spectral features, their characterization and computation of various narrow band indices to relate with foliar bio-chemicals. HyDAT software is especially designed for vegetation study using numerical ability of MATLAB. Several functions related to hyperspectral data processing have been added based on the user’s requirement from linear indices to advanced processing module, aimed at automatic absorption recovery for feature analysis. A new concept of spectral geometry has been introduced in the package which is a triangle formed over spectral space joining the vertices of green reflectance peak, red well and inflection point. The idea of introducing area based predictor variables in the visible-near infrared region is to increase the sensitivity of bio-optical indicator of leaf chlorophyll. Spectral geometry considers the off-chlorophyll band centres also which continue to respond even when the main absorption bands are saturated. MATLAB FSF (Field Spectroscopy Facility) Post processing
Toolbox has been used for direct importing and pre-processing of Spectroradiometer data. The complete packaging of the software can be made for bundling the standalone application of shared libraries with additional files for end users. Besides analysis of hyperspectral data the tool is powered by creation of spectral library.
5. FUTURE SCOPE
In future version some of the functionalities that would be incorporated are given below.
i. Scale-space method (Fingerprint and MMWT) for capturing of features. Scale-space is the set of output generated by smoothing with different span length. The method picks up the inflexion point from first derivative spectra which remains constant while the different scale-space output are generated. At finer scale many inflexion point are present but at the coarser resolution these points are eliminated. Maximum Modulus Wavelet Transform (MMWT) is the generalization of fingerprint method based on second order derivative.
ii. Besides recovery of absorption features spectral matching techniques would be added with special reference to artificial DNA encoding method for characterizing subtle differences across various spectra of the same object. iii. To minimize the loss of data information selective noise
removal technique using wavelet transform will be added. With minor modification the tool can find application in the field of geology and mineral identification.
ACKNOWLEDGEMENTS
Authors are thankful to Dr A. Jeyaram of RRSC-E and Shri Vinay Shankar Sinha of Banasthali Vidyapith for their cooperation and support.
REFERENCES
Becker, B.L., Lusch, D.P. and Qi, J., 2005. Identifying optimal spectral bands from in situ measurements of Great Lakes coastal wetlands using second-derivative analysis, Remote Sensing of Environment, Vol. 97(2), pp. 238-248.
Kokaly, R.F., and Clark, R.N., 1999. Spectroscopic Determination of leaf biochemistry using Band-Depth analysis of absorption features and stepwise multiple linear regression, Remote Sensing of Environment, Vol. 67 (3), pp. 267-287.
Kokaly, R. F., 2001. Investigating a physical basis for spectroscopic estimates of leaf nitrogen concentration, Remote Sensing of Environment, Vol. 75, pp. 153– 161.
Savitzsky, A. and Golay, M.J.E., 1964. Soothing and differentiation of data by simplified least squares procedures, Anal. Chem., Vol. 36, pp. 1627–1639.
Figure 8. Feature Characterization Window
The International Archives of the Photogrammetry, Remote Sensing and Spatial Information Sciences, Volume XL-8, 2014 ISPRS Technical Commission VIII Symposium, 09 – 12 December 2014, Hyderabad, India
This contribution has been peer-reviewed.