A TIE POINT MATCHING STRATEGY FOR VERY HIGH RESOLUTION SAR-OPTICAL
STEREOGRAMMETY OVER URBAN AREAS
C. P. Qiua, M. Schmitta, X. X. Zhua,b
a
Signal Processing in Earth Observation, Technical University of Munich (TUM), Arcisstr. 21, 80333 Munich, Germany -(chunping.qiu, m.schmitt)@tum.de
bRemote Sensing Technology Institute (IMF), German Aerospace Center (DLR), Oberpfaffenhofen, 82234 Wessling, Germany
KEY WORDS: synthetic aperture radar (SAR), optical imagery, remote sensing, data fusion, stereogrammetry, photogrammetry, radargrammetry, 3D reconstruction, multi-sensor image matching
ABSTRACT:
This paper presents a matching strategy for sparsely distributed tie points, which can be used to carry out SAR-optical stereogrammetry. Since matching homologue points in heterogeneous multi-sensor image of complex terrain remains a challenging task, the proposed procedure combines the tie point matching step with the estimation of the corresponding 3D object coordinates. The results of this study are two-fold: On the one hand, they show that fully automatic SAR-optical stereogrammetry using very high resolution data of urban scenes is generally feasible and can provide 3D accuracies in the meter-domain. On the other hand, they highlight the difficulty of multi-sensor image matching, as well as the importance of robust matching strategies.
1. INTRODUCTION
3D reconstruction of urban areas is of great importance for many different vital tasks, e.g. city planning, autonomous navigation and emergency response. Luckily, today we are living in a world rich of different remote sensing data, with increasingly high res-olution and positioning accuracy. Examples include the World-view missions equipped with the latest optical technology and the TerraSAR-X/TanDEM-X mission, which provides state-of-the-art synthetic aperture radar (SAR) data with meter-resolution. Besides, both optical and SAR remote sensing provide us with high-quality observations that can be used to map the world’s topography (Capaldo et al., 2012, Krieger et al., 2007). Un-fortunately, however, every kind of data and the corresponding method for 3D reconstruction has its own inherent limits: highly coherent image pairs from similar viewing angles are a must for any interferometric SAR techniques; cloudy weather causes fail-ure for any optical sensors. So, when used only within mission specifications, the huge earth observation data archive will never be fully exploited. On the other hand, specifically in situations where rapid mapping is required urgently, it would be beneficial to be able to make use of any incoming image, no matter which sensor technology was used to acquire them. As described in (Schmitt and Zhu, 2016b), the solution to this problem is the de-velopment of methods for flexible multi-sensor data fusion.
Therefore, this paper investigates SAR-optical stereo reconstruc-tion using sparsely distributed tie points in very high resolureconstruc-tion (VHR) spaceborne multi-sensor image of densely built-up urban areas. SAR-optical stereogrammetry has first been proposed by (Bloom et al., 1988), who investigated the general feasibility of the concept using data provided by the SIR-B mission and the Landsat-4/5 satellites. Further investigations were carried out by Raggam et al. (Raggam and Almer, 1990, Raggam et al., 1993, Raggam et al., 1994), who combined Seasat and SPOT/Landsat image for rough DEM generation. Similar experiments using ERS-2/Radarsat-1 and SPOT data were also presented by (Xing et al., 2008). All these studies have shown errors in the
dekameter-domain, which seem to prohibit an application of SAR-optical stereogrammetry in the context of urban remote sensing. Only re-cently, (Zhang et al., 2015) showed that TerraSAR-X and GeoEye-1 image can be used to carry out 3D reconstruction with an error in the meter-domain – although the study only used the manu-ally measured corners of a simple-shaped building to proof the concept. In contrast, based on the preliminary considerations sketched in (Schmitt and Zhu, 2016a), our work intends to pro-vide a first step towards a solution of the non-trival problem of automaticstereo matching of VHR multi-sensor images of com-plex urban areas. In this context, it combines SAR-optical stere-ogrammetric forward intersection with a fully automatic yet ro-bust selection of sparsely distributed tie points in a simultaneous manner.
2. SAR-OPTICAL STEREOGRAMMETRY
In this section, the workflow for SAR-optical stereogrammetry for sparsely distributed tie points located in complex urban areas is described. It is based on the rationale to simultaneously solve the matching and the 3D-reconstruction problems in order to re-duce the probability for false matches and thus to enhance the achievable 3D-reconstruction accuracy.
2.1 A Matching Strategy for Robust Selection of Tie Points
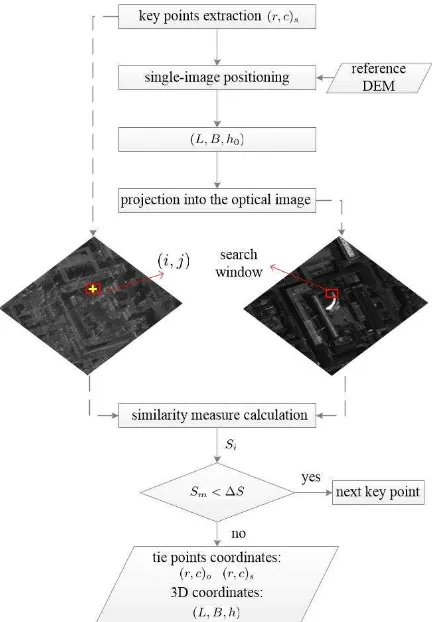
Since the correct matching of homologue points is a very difficult task for very high resolution multi-sensor remote sensing images, we propose a procedure that incorporates light prior knowledge about the scene of interest and a constraint inspired by epipolar geometry. The algorithm for tie point selection is sketched in Fig. 1. It consists of the following steps:
1. First, a set of keypoints(r, c)sis detected in the SAR image
Figure 1. Procedure of the proposed tie point matching strategy.
where a ground point is not existing in the SAR image at all, because of radar shadow or layover.
2. The detected keypoints are then projected onto a coarse ter-rain model (e.g. the SRTM DEM) using the classical single-image positioning, yielding approximate ground coordinates (L, B, h0)for every keypoint. For cities residing on rather
flat topography and containing mostly smaller buildings, a simple ground plane located on the mean terrain height can be used as coarse terrain model.
3. For every projected keypoint,(L, B, h0)is then projected
into the optical image, yielding(r, c)o. And a search
win-dow around this resulting image point is established (the de-tails about this search window are described in Section (2.2).
4. A similarity measure is used to compare all pixels in this search window to the keypoint. Then the similarity mea-sureSi for each pixeli(i = 1,2,3...N)(where N is the
total number of the pixels in the search window) is cal-culated. Wheni = N, the maximum similarity measure Sm = max(Si)is determined. This maximum similarity
value is then checked against a threshold∆Sin order to ex-clude key points for which even the most similar tie point is not a valid match. Thus, ifSm <∆S, the corresponding
key point is deleted; otherwise the image point correspond-ing to the maximum similarity measure,(r, c)m
o is
consid-ered as the homologue point of the keypoint detected in the SAR image in the first place.
The output of this procedure is the corresponding image coordi-nates(r, c)oand(r, c)s, and the 3D coordinates of this pair of tie
points(L, B, h).
2.2 IMBLS Search Window
The epipolar-line constraint is well-known in classical photogram-metry (Zhang et al., 1995) and serves as an excellent search strat-egy, reducing the search space from two dimensions to one di-mension. Unfortunately, a rigorous epipolar-line does not exist for SAR stereo pairs (Gutjahr et al., 2014), and even less so for SAR-optical stereo pairs. Therefore, in this paper, we propose a similar search strategy, called Imaging-Model-based-Line-Shape (IMBLS) search window for SAR-optical image matching. As shown in the following section, this strategy can be derived by theoretical considerations of the imaging geometry.
2.2.1 Derivation of the IMBLS Search Window For splicity and generality, the imaging models of SAR and optical im-ages, respectively, can be expressed using the general non-linear functionals
the SAR orientation parameters,(ro, co)are the tie point
coor-dinates in the optical image, andpo are the optical orientation
parameters.(L, B, h)are the 3D coordinates of the ground point corresponding to this pair of tie points. The derivation starts from the assumption that a keypoint(r, c)s has been detected in the
SAR image for which the corresponding point(r, c)oin the
opti-cal image needs to be found in order to perform stereogrammetric forward intersection. Taking both steps, i.e. image matching and 3D reconstruction into consideration simultaneously, the prob-lem can be formulated as a system of four equations with five un-knowns: the object coordinates(L, B, h)and the optical tie point image coordinates(r, c)o. Although a solution is not possible in a
straight-forward manner, a constraint between the unknowns can be constructed as follows. First, (1) and (2) can be rewritten as
(
whereg1andg2describe the mapping of the keypoint coordinates
(r, c)sto a spatial position(L, B)for a given heighth, andg3and
g4 in analogy are nonlinear functions to derive the height hif
the spatial position(L, B)and the optical coordinates(r, c)oare
known.
Replacing the ground coordinatesLandBin (4) by (3) and com-bining the two equations inside (4), we get the equality
g3(po;g1, g2, ro) =g4(po;g1, g2, co). (5)
Finally, from (5) we can acquire the constraintGon the row co-ordinateroand the column coordinatecoof the homologue point
in the optical image by
ro =G(po,ps;co, rs, cs, L, B, h), (6)
whereGdescribes the constraint on the relative position ofro
ex-pression for the constraintG, it shows that a constraint similar to the epipolar constraint can be formulated for any given key point in the SAR image. The constraint could be derived in a simi-lar manner when starting from key points detected in the optical image. In the following, the constraint is used to optimize the search space during the matching process. We use it to construct the IMBLS search window.
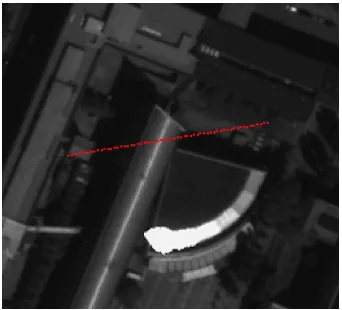
2.2.2 Construction of the IMBLS Search Window Exploit-ing the constraint derived in Section 2.2, a line-shaped search window can be constructed. As Fig.2(a) shows, the procedure starts from an arbitrary key point (r, c)s detected in the SAR
image. Using equation (3), and a suitable height search space hk∈[hmin, hmax], a set of potential spatial ground coordinates
(L, B)k can be calculated for everyhk, and the corresponding
optical image coordinates(r, c)o
kcan be calculated using
equa-tion (2). This basic principle is illustrated in Fig.2(b), while the resulting search line described by(r, c)o
kcan be seen in Fig.2(c).
In theory, the tie point corresponding to the original SAR key point needs to be located along this line. However, in order to deal with possible inaccuracies in the imaging parameters po
andps, a pre-defined buffer width needs to be added around the
line. An exemplary IMBLS search window and a regular square search window around the candidate homologue point in the op-tical image are shown in Fig. 3. Because of the line shape and the fact that the principle is based on the sensor-specific imag-ing models, it is thus called Imagimag-ing-Model-based-Line-Shape search window (IMBLS). Besides a reduced search space, an im-portant advantange of the IMBLS window is that every candidate point located in the window corresponds to a set of 3D coordi-nates (L, B, h), which means that 3D-reconstruction of object coordinates is solved simultaneous to tie point matching.
3. EXPERIMENTS AND RESULTS
To validate the proposed algorithm, experiments with real remote sensing data are carried out.
3.1 Test Data
For the experiments presented in this paper, two very high res-olution spaceborne datasets over the city of Munich, Germany, have been used. The optical data used is a panchromatic image acquired by Worldview-2 on July 22, 2015 with mean off-nadir angleθ = 13.7◦ and a mean pixel spacing (ground sampling
distance) of 0.49 m. The SAR data used is a TerraSAR-X im-age acquired in 300 MHz high resolution spotlight mode with an original pixel spacing of 85 cm in azimuth and 45 cm in range direction. The SAR image has been filtered by nonlocal NL-SAR filter (Deledalle et al., 2015) and converted to logarithmic scale. Besides the pixel spacing of the SAR image was approximately squared to 0.49 m in azimuth and slant range for the similarity with the optical image. For the same reason, a rotation was also performed for the SAR image in order to align it coarsely to the orientation of the optical image.
For numerical evaluation of the stereogrammetry result, a dense LiDAR reference point cloud of the same area was used, the pa-rameters of this LiDAR can be found in Tab. 1 (Hebel and Stilla, 2007).
3.2 Experimental Setup
For an investigation of the suitability of the matching strategy proposed in this paper, the simplest similarity measure was used:
(a) An exemplary key point detected in the SAR im-age.
(b) The procedure to calculate the coordinate in the optical image corresponding to every heighthk.
(c) The projection line described by(r, c)o
kin the op-tical image.
Figure 2. Exemplary illustration of the procedure for construction of the IMBLS search window.
Figure 3. The IMBLS search window (green) and a classical, rectangularly-shaped search window (blue) around the candidate
homologue point. (The red dots are the candidates corresponding to everyhk.)
Table 1. Parameters of the LiDAR reference data.
LiDAR Reference Data
Date of acquisition 02.09.2009
Aspects 4
Number of points 4,400,000 Point density 5.2 pts/m2
The height interval for constructing the IMBLS window was set to[h0−5m, h0+ 20m], whereh0 was taken from the SRTM
DEM of the study area. A±1pixel pre-defined buffer in the row direction was used to form the final IMBLS search window.
3.3 Results of Tie Point Matching
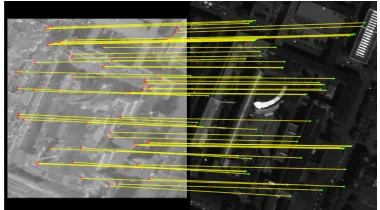
Tie points matching results for the whole study area can be seen in Fig. 4. A zoom-in on the area of the TUM main campus can be seen in Fig. 5.
3.4 Results of Stereogrammetric 3D-Reconstruction
The stereogrammetric 3D-reconstruction accuracy can be evalu-ated by calculating the distance of each reconstructed 3D point to a LiDAR reference point cloud. To avoid biased results caused by mismatches between the reconstructed 3D points and the Li-DAR data, the distance is not calculated based on individual point neighbors, but based on a plane fitted rigorously through either the 3 nearest neighbors or fitted in a least-squares sense through the 10 nearest neighbors (Schmitt, 2014).
The evaluation results can be found in Tab. 2, which shows both the mean and median of the absolute distances calculated before.
Table 2. The statistic result of the 3D reconstruction accuracy. (unit: meter)
similarity measure distance mean median
NCC nearest plane 2.45 1.53
nearest LS plane 2.97 2.06
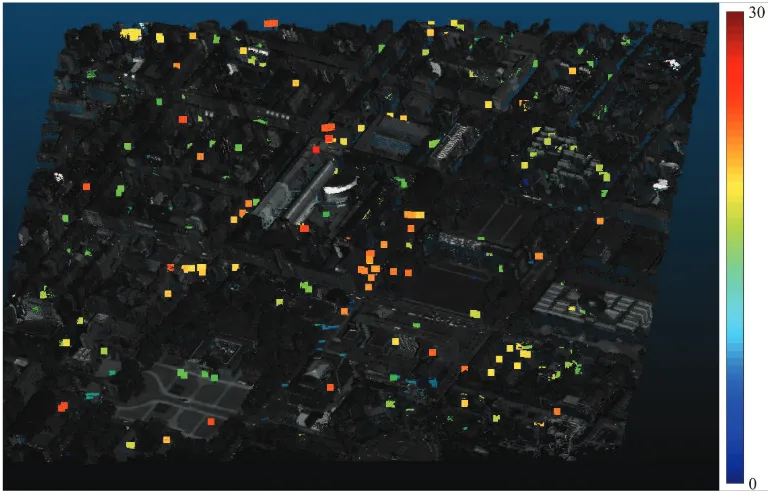
The visualization of the reconstruction result overlayed to the tex-turized LiDAR reference point cloud is shown in Fig. 6. To inves-tigate the distribution of these distances in Tab. 2, the histogram of the distances is shown in Fig. 7.
(a) SAR image.
(b) Optical image.
Figure 4. Tie points matching result for the whole study area (Number of tie points: 471).
key points in the SAR image Matched points in the optical image
Figure 5. Zoom-in of Fig. 4 to the area of the TUM main campus (Number of tie points: 56).
4. DISCUSSION
signifi-Figure 6. Visualization of the reconstruction result overlayed to the texturized LiDAR reference point cloud. The reconstructed points are colorized by their heights relative to the 560-meter horizontal plane in the UTM system.
Figure 7. Histogram of the distances corresponding to Tab. 2.
cant amount of points can be considered as erroneous reconstruc-tions as they show 3D distances larger than a couple of meters. Ignoring the potential error budget of the sensor imaging param-eters, the only possible reason for erroneous 3D reconstructions is mismatched tie points. This will be detailed in the following section.
4.1 Effect of Mismatching Errors
As mentioned before, the major challenge in SAR-optical stere-ogrammetry is the step of tie point matching in a non-trivial multi-sensor environment. Figure 8 illustrates, how quickly similarity-based matching can fail if the search window is too large and thus allows ambiguous results.
For discussing the effect of mismatches on the 3D-reconstruction results, we resort to the following procedure, which exploits both the known sensor imaging parameters as well as the LiDAR ref-erence data:
1. In a given pair of correct tie points, which are determined based on the LiDAR reference data, the SAR image co-ordinates(r, c)s are fixed, and an investigation window of
Figure 8. NCC-similarity values within the windows shown in Fig. 3. The red and blue ”+”-marks indicate the pixels corresponding to the maximum similarity within the classical
rectangular window (blue) and the IMBLS window (red), respectively.
pre-defined size is set up around the homologue point in the optical image(r, c)o. All pixels but the center pixel in
this investigation window correspond to a mismatch error (dr, dc)(i,j)= (r, c)(i,j)−(r, c)o.
2. Together with(r, c)s, every pixel(r, c)(i,j)in this window
is used for stereogrammetric forward intersection, yielding (X, Y, h)(i,j).
3. Every resulting 3D-coordinate(X, Y, h)(i,j) is then
com-pared to the correct 3D coordinate of this pair of tie points (X, Y, h), yielding the element-wise differences
(dX, dY, dh)(i,j) =
(X, Y, h)−(X, Y, h)(i,j)
, as well
as the spatial distance between(X, Y, h)(i,j)and
(X, Y, h),Dis(i,j)=k(dX, dY, dh)(i,j)k.
-10 -5 0 5 10
mismatch effect on dX /meter
0
mismatch effect on dY /meter
0
mismatch effect on dh /meter
0
mismatch effect on Dis /meter
0 1 2 3 4
Figure 9. Illustration of the effect of mismatching a SAR keypoint in the optical image.
5 meters of absolute distance between the reconstructed object point and the correct object point. Comparing Fig. 9 and Tab. 2, the matching accuracy of the experiment conducted in this paper apparently can be up to±5pixels. However, it should be noted that the distances in Tab. 2 are prone to introduce a certain bias as well, as there may be situations where even the 3 or 10 nearest neighbors of the reconstructed point are a bad choice for evalua-tion.
Besides limiting the search space as suggested in this paper, an-other potential solution for enhancing the robustness of the match-ing procedure is to determine a higher threshold∆S, which only keeps the most reliable matches. How to determine∆S in an unsupervised environment is part of ongoing research.
4.2 Comment on Keypoint Selection
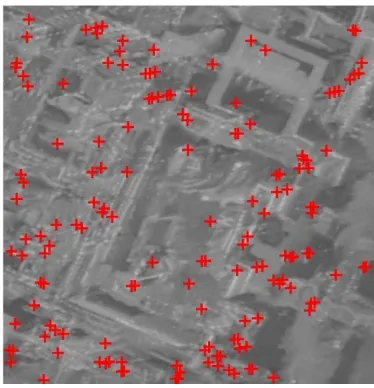
Another possible shortage of the presented methodology is the utilization of the Harris corner detector, which certainly is not the perfect choice to detect significant keypoints in SAR imagery. This is illustrated in Fig. 10, which shows the Harris keypoints for the TUM main campus subset of the test area. A potential solution for this issue is to resort to SAR-specific interest point detection methods, e.g. based on point target analysis.
Figure 10. The feature points detected in the SAR image patch in the TUM main campus area.
5. CONCLUSION AND OUTLOOK
This paper presents a matching strategy for sparsely distributed tie points in the context of SAR-optical stereogrammetry. It shows that the major challenge for very-high-resolution imagery of densely built-up urban areas is a proper restriction of the search space, as mismatching errors directly propagate into erroneous 3D recon-structions. In order to enhance the robustness in tie point match-ing, a line-shaped search window was proposed, which enables a reconstruction accuracy in the meter-domain by simultaneously solving the matching and the 3D reconstruction problems, even though only simple normalized cross-correlation was used as a similarity measure. Future work will include investigations on more sophisticated similarity measures, as well as a keypoint de-tection procedure which is specifically tailored to SAR image characteristics. In addition, potential errors in the sensor imag-ing parameters will be considered in a multi-sensor bundle ad-justment framework.
ACKNOWLEDGEMENTS
The authors want to thank European Space Imaging for providing the Worldview-2 image. Futhermore, they want to thank Gerald Baier of TUM-SiPEO for filtering the TerraSAR-X data.
This work is supported by the Helmholtz Association under the framework of the Young Investigators Group SiPEO (VH-NG-1018, www.sipeo.bgu.tum.de) and the German Research Foun-dation (DFG), grant SCHM 3322/1-1.
REFERENCES
Bloom, A. L., Fielding, E. J. and Fu, X.-Y., 1988. A demonstra-tion of stereophotogrammetry with combined SIR-B and land-sat tm images. International Journal of Remote Sensing9(5), pp. 1023–1038.
Capaldo, P., Crespi, M., Fratarcangeli, F., Nascetti, A. and Pier-alice, F., 2012. DSM generation from high resolution imagery: applications with WorldView-1 and Geoeye-1.Italian Journal of Remote Sensing44(1), pp. 41–53.
Deledalle, C.-A., Denis, L., Tupin, F., Reigber, A. and J¨ager, M., 2015. Nl-sar: A unified nonlocal framework for resolution-preserving (pol)(in) sar denoising. IEEE Transactions on Geo-science and Remote Sensing53(4), pp. 2021–2038.
Gutjahr, K., Perko, R., Raggam, H. and Schardt, M., 2014. The epipolarity constraint in stereo-radargrammetric dem genera-tion.IEEE transactions on geoscience and remote sensing52(8), pp. 5014–5022.
Hebel, M. and Stilla, U., 2007. Automatic registration of laser point clouds of urban areas. International Archives of the Pho-togrammetry, Remote Sensing and Spatial Information Sciences 36(3/W49A), pp. 13–18.
Krieger, G., Moreira, A., Fiedler, H., Hajnsek, I., Werner, M., Younis, M. and Zink, M., 2007. TanDEM-X: A satellite forma-tion for high-resoluforma-tion SAR interferometry. IEEE Transactions on Geoscience and Remote Sensing45(11), pp. 3317–3341.
Raggam, J., Almer, A. and Strobl, D., 1994. A combination of SAR and optical line scanner imagery for stereoscopic extraction of 3-d data.ISPRS Journal of Photogrammetry and Remote Sens-ing49(4), pp. 11–21.
Raggam, J. and Almer, A., 1990. Mathematical aspects of multi-sensor stereo mapping. In: Proc. of IEEE International Geo-science and Remote Sensing Symposium, pp. 1963–1966.
Schmitt, M., 2014. Reconstruction of urban surface models from multi-aspect and multi-baseline interferometric SAR. PhD thesis, Universit¨atsbibliothek der TU M¨unchen.
Schmitt, M. and Zhu, X., 2016a. On the challenges in stere-ogrammetric fusion of sar and optical imagery for urban areas. International Archives of the Photogrammetry, Remote Sensing and Spatial Information Sciences41(B7), pp. 719–722.
Schmitt, M. and Zhu, X. X., 2016b. Data fusion and remote sens-ing: An ever-growing relationship.IEEE Geoscience and Remote Sensing Magazine4(4), pp. 6–23.
Tao, C. V. and Hu, Y., 2001. A comprehensive study of the ratio-nal function model for photogrammetric processing. Photogram-metric engineering and remote sensing67(12), pp. 1347–1358.
Xing, S., Xu, Q., Zhang, Y., He, Y. and Jin, G., 2008. Opti-cal/SAR sensors stereo positioning.International Archives of the Photogrammetry, Remote Sensing and Spatial Information Sci-ences37(B1), pp. 993–996.
Ye, Y., Shan, J., Bruzzone, L. and Shen, L., 2017. Robust regis-tration of multimodal remote sensing images based on structural similarity. IEEE Transactions on Geoscience and Remote Sens-ingPP(99), pp. 1–18.
Zhang, H., Xu, H. and Wu, Z., 2015. A novel fusion method of SAR and optical sensors to reconstruct 3-D buildings. In:Proc. of IEEE International Geoscience and Remote Sensing Symposium, pp. 609–612.