VALIDATION OF THE ASTER GLOBAL DIGITAL ELEVATION MODEL
VERSION 3 OVER THE CONTERMINOUS UNITED STATES
D. Gesch a, *, M. Oimoen b, **, J. Danielson a, D. Meyer a
a U.S. Geological Survey, Earth Resources Observation and Science Center, Sioux Falls, South Dakota, USA 57198 – [email protected], [email protected], [email protected]
b SGT, Inc., contractor to the USGS Earth Resources Observation and Science Center, Sioux Falls, South Dakota, USA 57198 – michael.oimoen.ctr@usgs,gov
Commission IV, WG IV/3
KEY WORDS: Accuracy, DEM/DTM, Comparison, Geodesy, Global-Environmental-Databases, Land Cover, Mapping, Satellite
ABSTRACT:
The ASTER Global Digital Elevation Model Version 3 (GDEM v3) was evaluated over the conterminous United States in a manner similar to the validation conducted for the original GDEM Version 1 (v1) in 2009 and GDEM Version 2 (v2) in 2011. The absolute vertical accuracy of GDEM v3 was calculated by comparison with more than 23,000 independent reference geodetic ground control points from the U.S. National Geodetic Survey. The root mean square error (RMSE) measured for GDEM v3 is 8.52 meters. This compares with the RMSE of 8.68 meters for GDEM v2. Another important descriptor of vertical accuracy is the mean error, or bias, which indicates if a DEM has an overall vertical offset from true ground level. The GDEM v3 mean error of -1.20 meters reflects an overall negative bias in GDEM v3. The absolute vertical accuracy assessment results, both mean error and RMSE, were segmented by land cover type to provide insight into how GDEM v3 performs in various land surface conditions. While the RMSE varies little across cover types (6.92 to 9.25 meters), the mean error (bias) does appear to be affected by land cover type, ranging from -2.99 to +4.16 meters across 14 land cover classes. These results indicate that in areas where built or natural aboveground features are present, GDEM v3 is measuring elevations above the ground level, a condition noted in assessments of previous GDEM versions (v1 and v2) and an expected condition given the type of stereo-optical image data collected by ASTER. GDEM v3 was also evaluated by differencing with the Shuttle Radar Topography Mission (SRTM) dataset. In many forested areas, GDEM v3 has elevations that are higher in the canopy than SRTM. The overall validation effort also included an evaluation of the GDEM v3 water mask. In general, the number of distinct water polygons in GDEM v3 is much lower than the number in a reference land cover dataset, but the total areas compare much more closely.
* Corresponding author.
** Work performed under USGS contract G15PC00012. 1. INTRODUCTION
The initial version of the ASTER Global Digital Elevation Model (GDEM v1) (Abrams et al., 2010), a joint project of the U.S. National Aeronautics and Space Administration (NASA) and the Ministry of Economy, Trade, and Industry (METI) of Japan, was released in June 2009. The user community widely embraced the availability of GDEM v1 even though NASA and METI acknowledged it to be a “research grade” dataset that contains anomalies and artifacts that may limit its usefulness for some applications. Several validation efforts conducted on GDEM v1 concluded that in most cases the dataset met its stated accuracy goal (±20 meters at 95% confidence), but that some characteristics of the dataset affect how the terrain is represented and how the DEM performs in applications (ASTER GDEM Validation Team, 2009; Slater et al., 2011; Hvidegaard et al., 2012; Miliaresis and Paraschou, 2011; Wang et al., 2012).
To address limitations of GDEM v1, NASA and METI jointly developed GDEM Version 2 (v2) (Tachikawa et al., 2011) and released it to the user community in October 2011. The improvements in the processing for GDEM v2 included an additional 260,000 individual ASTER scenes to improve coverage, a smaller correlation window to improve spatial
resolution, and better water masking (ASTER GDEM Validation Team, 2011). GDEM v2 was evaluated over the full extent of the conterminous United States (CONUS) in a manner similar to the validation conducted for the original GDEM v1 in 2009, and the evaluation showed a substantial improvement in error statistics over those for GDEM v1 (Gesch et al., 2012). In 2015 (for a 2016 release) a third version of GDEM was produced, again taking advantage of additional ASTER scenes (350,000) and further improvements in water body delineation. The primary goal of the CONUS validation work reported here was to fully characterize the vertical accuracy of the new GDEM Version 3 (v3). Use of the same assessment approach previously employed on GDEM v1 and v2 ensures compatibility of the results for comparative purposes.
2. METHODS AND DATA 2.1 Validation Approach
More than 900 1x1-degree tiles of GDEM v3 data covering CONUS were included in the validation effort. Absolute vertical accuracy of GDEM v3 was calculated by comparison with independent reference geodetic ground control points. GDEM v3 was also evaluated by pixel-to-pixel differencing
with other 1-arc-second (30-meter) DEMs that have complete coverage over CONUS, namely the National Elevation Dataset (NED) (Gesch, 2007) and the Shuttle Radar Topography Mission (SRTM) dataset (Farr et al., 2007). Accuracy assessment results were segmented by land cover classes to look for relationships between vertical accuracy and cover type. One characteristic of GDEM v3, specifically the number of ASTER scenes (stereo pairs) used to derive an elevation for a pixel, was examined to see how it affected vertical accuracy.
2.2 Reference Data
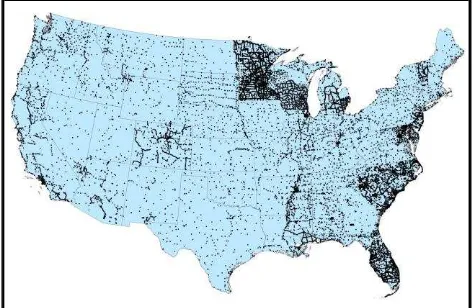
The primary reference data were the “GPS on Bench Marks” dataset of geodetic control points from the U.S. National Geodetic Survey (NGS). These points represent NGS’s best x -y-z control point dataset for CONUS, and they are used by NGS for gravity and geoid determination (Roman et al., 2004; Roman et al., 2010). This set of control points is from NGS’s recent U.S. geoid model, GEOID12A. The points have millimeter- to centimeter-level accuracies, so they are an excellent reference against which to compare DEMs across CONUS. For the accuracy assessment presented here, 23,115 points (Figure 1) were intersected with GDEM v3. The elevations of the GPS benchmarks are provided in the North American Vertical Datum of 1988 (NAVD88), and the elevations of GDEM v3 are referenced to the Earth Gravitational Model 1996 (EGM96) geoid. Therefore, before comparing the GDEM and the GPS points, the vertical referencing of the points was transformed to the EGM96 geoid. Over CONUS, the vertical offset between NAVD88 and the geoid averages about one-half meter (National Geodetic Survey, 2010).
Figure 1. GPS benchmarks (23,115 points) used as GDEM v3 validation reference data.
The use of GPS survey data has proven to be an effective means of characterizing DEM errors, especially in varying terrain and land cover conditions (Bolkas et al., 2016). Such data have been routinely used for accuracy assessments of large-area elevation datasets (Gesch et al., 2014). One limitation of the GPS benchmark dataset is the spatial distribution of points. Even though the reference control points are located broadly across CONUS, the distribution of elevations and terrain conditions within the dataset is not completely representative of the topography of the U.S. This stands to reason, as surveyed benchmarks are generally located in open, accessible areas; thus, high elevation and steep slope locations are under-represented in the reference dataset. Nonetheless, the GPS benchmarks are an effective reference because of the vast
number of points, their high geodetic quality, and presence in every state within CONUS.
The 2011 update of the National Land Cover Database (NLCD) (Homer et al., 2015) was used to segment the accuracy assessment results by land cover class. The NLCD includes land cover data in 20 classes derived from 30-meter Landsat data. The GPS benchmarks used for validation of GDEM v3 fall into 14 of the NLCD land cover classes.
2.3 Absolute Vertical Accuracy
The difference between the GPS benchmark elevation and the corresponding GDEM v3 elevation was recorded for each control point location. The recorded GDEM v3 elevation was derived through bilinear interpolation at the precise latitude/longitude location of the GPS point. At each point, the difference was calculated by subtracting the GPS benchmark elevation from the GDEM v3 elevation, and these differences are the measured errors in GDEM v3. Positive errors represent locations where the GDEM v3 elevation was above the control point elevation, and negative errors occur at locations where the GDEM v3 elevation was below the control point elevation. The land cover associated with each control point was determined by intersecting the GPS benchmark locations with the NLCD.
An ancillary data layer supplied with GDEM v3 indicates the number of individual ASTER scene (stereo pair) DEMs that were used to derive each elevation value. The individual ASTER DEMs are stacked and averaged to calculate the final elevation value for each pixel in GDEM v3. The “NUM” value (number of input individual DEMs) associated with each control point location was determined by intersecting the GPS benchmarks with the ancillary NUM layer.
2.4 Comparison vs. Other DEMs
In the same manner as with the reference control points, the NED and SRTM were each subtracted from GDEM v3 on a pixel-to-pixel basis. Thus, positive differences represent locations where the GDEM v3 elevation was higher than the corresponding NED or SRTM elevation, and negative differences occur at locations where the GDEM v3 elevation was lower than the NED or SRTM elevation. Prior to differencing, the NED elevations were converted from the NAVD88 vertical datum to the EGM96 geoid vertical reference frame. No such conversion was necessary for SRTM, as both GDEM v3 and SRTM are natively referenced to the EGM96 geoid. Difference statistics were calculated, and summary statistics were segmented by NLCD land cover class.
2.5 Evaluation of Water Mask
The delineation of water bodies in GDEM v3 was evaluated by comparing a sample of ten 1x1-degree tiles with the NLCD water class in the corresponding areas. The total count of water polygons, total area, and percent error were calculated.
3. RESULTS AND DISCUSSION 3.1 Absolute Vertical Accuracy
A plot of the GDEM v3 measured errors vs. elevations of the reference control points (Figure 2) indicates that there is no apparent relationship of error with elevation. Also, it appears
that there is no strong preference for positive or negative errors as the plotted GDEM v3 errors are uniformly distributed on both sides of the zero error axis.
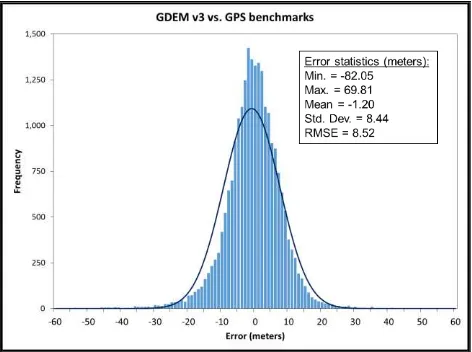
Summary statistics of the measured GDEM v3 errors are presented in Figure 3 and Table 1. The error distribution approximates a normal distribution (smooth line in Figure 3). The Root Mean Square Error (RMSE) is an accuracy metric commonly used for elevation data, and the measured RMSE for GDEM v3 is 8.52 meters. This compares with the RMSE of 8.68 meters for GDEM v2 and 9.34 meters for GDEM v1 (Table 1). Absolute vertical accuracy can also be expressed with a confidence level, in many cases 95%, or also referred to as “linear error at 95% confidence” (LE95). LE95 is derived directly from the measured RMSE (Maune et al., 2007). GDEM v3 exhibits an LE95 of 16.70 meters, compared with an LE95 of 17.01 meters for GDEM v2 and 18.31 meters for GDEM v1 (Table 1). The accuracy statistics for GDEM v2 and v1 were derived from a comparison with previous smaller sets of GPS benchmarks (18,207 points for v2 and 13,305 points for v1) from NGS, which were the most recent datasets available at the time of the GDEM v2 and v1 evaluations in 2011 and 2009, respectively. However, most of these points are also included in the current GEOID12A GPS benchmark dataset used for GDEM v3 validation.
Figure 2. GDEM v3 measured errors plotted vs. elevation.
Figure 3. GDEM v3 absolute vertical accuracy.
Another important descriptor of vertical accuracy is the mean error, or bias, which indicates if a DEM has an overall vertical
offset (either positive or negative) from true ground level. The GDEM v3 mean error of -1.20 meters reflects an overall negative bias in GDEM v3. The GDEM v3 mean error is one meter worse than the GDEM v2 mean error of –0.20 meters, which was a substantial improvement over the GDEM v1 mean error of -3.69 meters (Table 1).
DEM Minimum Maximum Mean Std.
Dev. RMSE LE95 GDEM
v3 -82.05 69.81 -1.20 8.44 8.52 16.70 GDEM
v2 -137.37 64.80 -0.20 8.68 8.68 17.01 GDEM
v1 -127.74 105.41 -3.69 8.58 9.34 18.31 NED -24.64 15.57 -0.29 1.52 1.55 3.04 SRTM -44.38 35.10 0.31 4.14 4.15 8.13
Table 1. Error statistics (meters) from accuracy assessments vs. NGS GPS benchmarks.
The absolute vertical accuracy testing also included evaluation of the NED and SRTM datasets over CONUS. Because NED and SRTM are both supplied at the same 1-arc-second posting as GDEM, and they have been extensively tested with many results reported in the scientific literature (Gesch et al., 2014), summary statistics are provided (Table 1) to help give context for the GDEM v3 results. The number of GPS benchmarks used for evaluation of SRTM is slightly less than the number used for the NED evaluation because some points fall in SRTM void or fill areas.
3.1.1 Land Cover Analysis
The absolute vertical accuracy assessment results, both mean error and RMSE, have been segmented by land cover to examine effects of cover types on measured errors. While the RMSE varies little across cover types (6.92 to 9.25 meters), the mean error (bias) does appear to be affected by land cover, ranging from -2.99 to +4.16 meters across the 14 NLCD classes (Figure 4). The GDEM v3 data in more open land cover classes (cropland, pasture, grassland, urban open space) exhibit negative elevation biases of about 1 to 3 meters, whereas the GDEM v3 data in heavily vegetated land cover classes (forest, herbaceous wetlands, woody wetlands) show positive elevation biases in the 1 to 4 meter range. These results indicate that in areas where built or natural aboveground features are present GDEM v3 is measuring elevations above the ground level, a condition noted in assessments of previous GDEM versions (v1 and v2) and an expected condition given the type of stereo-optical image data collected by ASTER that records the first reflective surface. The negative elevation bias (negative mean error) exhibited by GDEM v3 in open land cover areas is important because it is indicative of the overall performance of GDEM v3, which on average records elevations that are too low on the order of 1 to 2 meters.
3.1.2 Scene Number Analysis
The reference points were grouped into bins for each NUM value, and the measured GDEM v3 errors for the points in each bin were processed to calculate a mean error and average RMSE for each NUM bin. Figure 5 shows a plot of the mean error and RMSE associated with each NUM value. Note how both the mean error and RMSE improve rapidly as the NUM increases from 1 to 10 scenes. Beyond NUM values of about 10 to 15 scenes, there appears to be little improvement in either mean
error or RMSE values. This observation matches very closely the results of the same comparison of vertical error and NUM for GDEM v2 (Gesch et al., 2012).
Figure 4. GDEM v3 mean error and RMSE by land cover class.
Figure 5. GDEM v3 mean error and RMSE vs. number of scenes used for elevation calculation.
3.2 Comparison vs. Other DEMs
Compared against NED, GDEM v3 has an overall positive bias of 0.90 meters. Positive biases in forested and developed areas outweigh negative biases in more open land cover types. The mean errors for the four wooded NLCD classes (deciduous, evergreen, mixed forest, and woody wetlands) range from 5.05 to 8.02 meters. These positive biases in GDEM v3 for wooded areas demonstrate an expected condition because NED by definition is a “bare earth” elevation model (Gesch, 2007), and ASTER is a first return system that measures canopy elevations in forested areas.
Compared against SRTM, GDEM v3 has an overall negative bias of -1.81 meters, although in deciduous and mixed forests and in woody wetlands GDEM v3 has elevations higher in the canopy than SRTM. Like ASTER, SRTM is a first return system, and elevations above ground level would be expected for areas with trees and/or built structures. It is likely that ASTER is measuring elevations at or very near the top of the forest canopy, while SRTM is recording elevations part way down into the canopy. Such performance of SRTM in recording elevations within the vegetation canopy rather than at the top has been previously documented (Carabajal and Harding, 2006; Hofton, et al., 2006). This observation of
GDEM v3 registering higher elevations than SRTM in many forest canopies is consistent with findings in the evaluation of GDEM v2 (Gesch et al., 2012).
When considering land cover, the comparisons among the three DEMs show that in forested classes GDEM v3 and SRTM generally agree better than GDEM v3 and NED. For the four NLCD wooded classes (deciduous, evergreen, mixed forest, and woody wetlands), the RMSE for GDEM v3-SRTM ranges from 7.02 to 8.98 meters, while the RMSE for GDEM v3-NED ranges from 10.77 to 12.35 meters. This is expected, as both ASTER and SRTM are first return systems that measure aboveground elevations in dense vegetation canopies so they should agree better. As land cover becomes more open, the RMSE for GDEM SRTM and the RMSE for GDEM v3-NED are nearly equivalent as all three DEMs are measuring near ground level elevations.
3.3 Evaluation of Water Mask
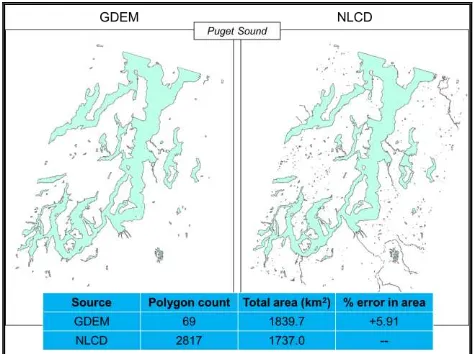
Figure 6 shows one of the ten sample tiles used for an initial evaluation of the water body delineation in GDEM v3. Across the small sample of tiles, the number of distinct water polygons in GDEM v3 is much less than the number in NLCD (which includes many very small water bodies not depicted in GDEM v3). However, in terms of total water area, the GDEM depiction of water compares more favorably with NLCD. On average, GDEM v3 shows about 13% less water area than NLCD per 1x1-degree tile.
Figure 6. Comparison of GDEM v3 water mask with NLCD water class for 1x1-degree tile over Puget Sound, Washington,
USA.
4. CONCLUSION
The validation testing results reported here have raised several important observations about the quality of elevation measurements contained in GDEM v3:
In terms of absolute vertical accuracy, GDEM v3 is comparable to GDEM v2, exhibiting a slight improvement in overall RMSE (8.52 meters vs. 8.68 meters). However, the mean error is slightly worse in GDEM v3 (-1.20 meters) compared to GDEM v2 (-0.20 meters).
Comparing absolute vertical accuracy, GDEM v3 has an RMSE of more than twice that of SRTM (8.52 meters vs.
4.15 meters). The absolute vertical accuracy specifications for two new global DEMs, TanDEM-X (Zink et al., 2014), distributed under the commercial name WorldDEM (RMSE = 6.08 meters), and ALOS World 3D (Takaku et al., 2014), abbreviated as AW3D (RMSE = 5.00 meters), are both better than the measured RMSE for GDEM v3.
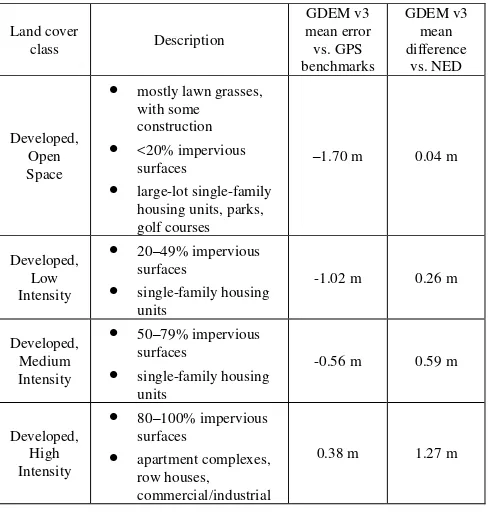
It is clear that GDEM v3 includes non-ground-level elevations for areas that have aboveground features (tree canopies and built structures). Table 2 and Figure 7 show how the mean error increases in the developed land cover classes as the number and density of built structures increases. This condition is observed in both the comparison of GDEM v3 with GPS benchmarks, which represent ground level elevations, as well as in the GDEM v3-NED differencing, with NED representing ground level elevations.
Table 2. Increasing GDEM v3 mean error with increasing density of developed land cover.
Figure 7. Increasing GDEM v3 mean error with increasing density of developed land cover.
In many forested areas, GDEM v3 has elevations that are higher in the canopy than SRTM. This observation is based on the GDEM v3-SRTM differencing.
An analysis of the number of ASTER individual scene DEMs that are stacked and averaged to derive the elevation value for every pixel in GDEM v3 shows that
improvements to mean error and RMSE are minimal beyond about 10 to 15 scenes.
The negative elevation bias of GDEM v3 is exhibited in open land cover types (Figure 4), which show that GDEM v3 is reporting elevations that are too low on the order of 1 to 2 meters. The overall mean error of GDEM v3 is dampened somewhat by the positive elevation biases contributed by forested and built-up land cover. In these areas, the first return nature of the ASTER sensor results in measured elevations above ground level.
Compared against 30-meter reference land cover data, the GDEM v3 water body mask displays about 13% less water on average per unit area (1x1-degree tile).
Although there are some slight differences in accuracy statistics, the evaluation of GDEM v3 shows very similar results to that of the validation of GDEM v2. This is true for absolute vertical accuracy as computed against GPS survey benchmarks, relative comparisons with other DEMs (NED and SRTM), and across land cover categories.
5. REFERENCES
Abrams, M., Bailey, B., Tsu, H., and Hato, M., 2010. The ASTER global DEM. Photogrammetric Engineering and Remote Sensing, 76(4), pp. 344-348.
ASTER GDEM Validation Team, 2009. ASTER Global DEM Validation Summary Report. 28 p.
http://www.ersdac.or.jp/GDEM/E/image/ASTERGDEM_Valida tionSummaryReport_Ver1.pdf (5 Apr. 2012).
ASTER GDEM Validation Team, 2011. ASTER Global Digital Elevation Model Version 2 – Summary of Validation Results. 26 p.
https://igskmncnwb001.cr.usgs.gov/aster/GDEM/Summary_GD EM2_validation_report_final.pdf (5 Apr. 2012).
Bolkas, D., Fotopoulos, G., Braun, A., and Tziavos, I.N., 2016. Assessing digital elevation model uncertainty using GPS survey data. Journal of Surveying Engineering, 04016001.
Carabajal, C.C., and Harding, D.J., 2006. SRTM C-band and ICESat laser altimetry elevation comparisons as a function of tree cover and relief. Photogrammetric Engineering & Remote Sensing, 72(3), pp. 287-298.
Farr, T.G., Rosen, P.A., Caro, E.; Crippen, R., Duren, R., Hensley, S., Kobrick, M., Paller, M., Rodriguez, E., Roth, L., Seal, D., Shaffer, S., Shimada, J., Umland, J., Werner, M., Oskin, M., Burbank, D., and Alsdorf, D., 2007. The Shuttle Radar Topography Mission. Reviews of Geophysics, 45(RG2004).
Gesch, D.B., 2007. The National Elevation Dataset. In: Maune, D., ed., Digital Elevation Model Technologies and Applications: The DEM Users Manual, 2nd Edition. American Society for Photogrammetry and Remote Sensing, Bethesda, Maryland, pp. 99-118.
Gesch, D.B., Oimoen, M.J., and Evans, G.A., 2014. Accuracy assessment of the U.S. Geological Survey National Elevation Dataset, and comparison with other large-area elevation datasets—SRTM and ASTER. U.S. Geological Survey Open-File Report 2014–1008, 10 p.
Gesch, D., Oimoen, M., Zhang, Z., Meyer, D., Danielson, J., 2012. Validation of the ASTER Global Digital Elevation Model Version 2 over the conterminous United States. In: Shortis, M., and El-Sheimy, N., eds., Imaging a sustainable future, Congress, 22nd, Melbourne, Australia, 25 August-1 September 2012, The International Archives of the Photogrammetry, Remote Sensing, and Spatial Information Sciences, XXXIX, pt. B4: Lemmer, Netherlands, International Society for Photogrammetry and Remote Sensing, p. 281-286.
Hofton, M., Dubayah, R., Blair, J.B., and Rabine, D., 2006. Validation of SRTM elevations over vegetated and non-vegetated terrain using medium footprint lidar.
Photogrammetric Engineering & Remote Sensing, 72(3), pp. 279-285.
Homer, C.G., Dewitz, J.A., Yang, L., Jin, S., Danielson, P., Xian, G., Coulston, J., Herold, N.D., Wickham, J.D., and Megown, K., 2015. Completion of the 2011 National Land Cover Database for the conterminous United States – Representing a decade of land cover change information.
Photogrammetric Engineering and Remote Sensing, 81(5), pp. 345-354.
Hvidegaard, S.M., Soørensen, L.S., and Forsberg, R., 2012. ASTER GDEM validation using LiDAR data over coastal regions of Greenland. Remote Sensing Letters, 3(1), pp. 85-91.
Maune, D.F., Maitra, J.B., and McKay, E.J., 2007.Accuracy standards & guidelines. In: Maune, D. (ed.), Digital Elevation Model Technologies and Applications: The DEM Users Manual, 2nd Edition. American Society for Photogrammetry and Remote Sensing, Bethesda, Maryland, pp. 65-97.
Miliaresis, G.Ch., and Paraschou, C.V.E., 2011. An evaluation of the accuracy of the ASTER GDEM and the role of stack number: A case study of Nisiros Island, Greece. Remote Sensing Letters, 2(2), pp. 127-135.
National Geodetic Survey, 2010. Proceedings of the 2010 Federal Geospatial Summit on Improving the National Spatial Reference System, Silver Spring, Maryland, May 11-12, 2010, 156 p.
http://www.ngs.noaa.gov/2010Summit/proceedings.shtml (12 Aug. 2011).
Roman, D.R., Wang, Y.M., Henning, W., and Hamilton, J., 2004. Assessment of the new national geoid height model – GEOID03. Surveying and Land Information Science, 64(3), pp. 153-162.
Roman, D.R., Wang, Y.M., Saleh, J., and Li, X., 2010. Geodesy, geoids, and vertical datums: a perspective from the U.S. National Geodetic Survey. Proceedings, FIG Congress
2010, Facing the Challenges – Building the Capacity, Sydney, Australia, April 11-16, 2010, 16 p.
Slater, J.A., Heady, B., Kroenung, G., Curtis, W., Haase, J., Hoegemann, D., Shockley, C., and Tracy, K., 2011. Global assessment of the new ASTER global digital elevation model.
Photogrammetric Engineering and Remote Sensing, 77(4), pp. 335-349.
Tachikawa, T., Hato, M., Kaku, M., and Iwasaki, A., 2011. Characteristics of ASTER GDEM version 2. International Geoscience and Remote Sensing Symposium (IGARSS), art. no. 6050017, pp. 3657-3660.
Takaku, J., Tadono, T., and Tsutsui, K., 2014. Generation of high resolution global DSM from ALOS PRISM. The International Archives of the Photogrammetry, Remote Sensing, and Spatial Information Sciences, XL-4, p. 243-248.
Wang, W., Yang, X., and Yao, T., 2012. Evaluation of ASTER GDEM and SRTM and their suitability in hydraulic modelling of a glacial lake outburst flood in southeast Tibet. Hydrological Processes, 26(2), pp. 213-225.
Zink, M., Bachmann, M., Brautigam, B., Fritz, T., Hajnsek, I., Moreira, A., Wessel, B., and Krieger, G., 2014. TanDEM-X: The new global DEM takes shape. Geoscience and Remote Sensing Magazine, IEEE (2), pp. 8-23.