A mapping of ecosystem services
in Quang Tri and Ha Tinh provinces,
Viet Nam
A mapping of ecosystem services in
Quang Tri and Ha Tinh provinces, Viet Nam
RECOFTC - The Center for People and Forests
Copyright © RECOFTC October 2015 Bangkok, Thailand
All photos courtesy of RECOFTC
Reproduction of this publication for educational or other non-commercial purposes is authorized without prior written permission from the copyright holders provided the source is fully acknowledged. Reproduction of this publication for resale or other commercial purposes is prohibited without written permission of the copyright holder.
This publication has been generously funded by the Ministry for Foreign Afairs of Finland. The views expressed in this publication are those of the authors and do not necessarily relect the views of RECOFTC and our donor organizations.
Acknowledgements
Acronyms
AGB Above ground biomass
BEF Biomass Expansion Factor
BGB Below ground biomass
CBD Convention of Biological Diversity
CI Conservation International
FIPI Forest Inventory and Planning Institute
FPD Forest Protection Department
FRA Forest Resources Assessment
FSC Forest Stewardship Council
FSC COC FSC Chain of Custody
FSC FM FSC Forest management
IPCC Intergovernmental Panel on Climate Change
IUCN International Union for Conservation of Nature
KBAs Key Biodiversity Areas
MARD Ministry of Agriculture and Rural Development
MONRE Ministry of Environment and Natural Resources
PAs Protected areas
SCBD Secretariat of the Convention on Biological Diversity
SFM Sustainable forest management
SNV Netherlands Development Organization
VNFOREST Vietnam Forest Administration
Table of contents
Acknowledgements i
Acronyms ii
Background 1
Objective 1
Ecosystem services 1
Study Sites 3
Viet Nam 3
Huong Son SFE 4
Vinh Tu commune 5
Methods and data 7
Ecosystem service identiication 7
Data used 9
Forest biomass carbon estimation 10
Soil loss potential estimation 13
Biodiversity assessment 13
Results 15
Forest biomass carbon 15
Potential soil loss 18
Biodiversity 22
Integration of ecosystem service map 28
Conclusions and recommendations 37
References 39
Figures
Figure 1. Forest cover of Vietnam from 1943 to 2010 and projection to 2020 (MARD). 3 Figure 2. Figure 2. Map of study sites at Huong Son and Vinh Tu 4 Figure 3. Forest biomass carbon map of the Huong Son forest enterprise. 16 Figure 4. Forest biomass carbon of Vinh Tu Commune, Vinh Linh District,
Quang Tri Province. 17
Figure 5. Soil loss map of Huong Son SFE. 19
Figure 6. Soil loss map of Huong Son SFE averaged by compartment. 20
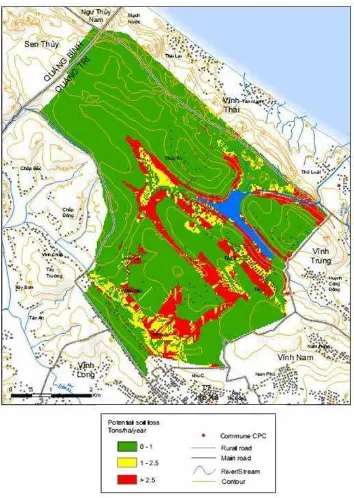
Figure 7. Soil loss map of Vinh Tu Commune. 21
Figure 8. Location of Huong Son (VNM 47) and Vinh Tu in relation to
conservation areas in Vietnam and the region (CEPF 2012). 22 Figure 9. Distribution of rate species and zoning of conservation areas in
Huong Son SFE. 26
Figure 10. Area reserve for biodiversity conservation in VinhTu Commune. 27
Figure 11. Matrix of biomass carbon and soil loss. 28
Figure 12. Ecosystem service map of Huong Son. 30
Figure 13. Ecosystem service map of Huong Son by compartment. 31 Figure 14. Location of natural coastal shrub forest of Vinh Tu viewed in perspective.
Figures on top of arrows indicate elevation. 33
Figure 15. Result of FSC audit for Biodiversity and marginal habitat protection
of Ben Hai Forest Company (GFA 2012). 34
Figure 16. Ecosystem service map of Vinh Tu. 35
Tables
Table 1. Proposed ecosystem services at study sites. 9
Table 2. Data used for ecosystem maping. 10
Table 3. Standing volume and biomass carbon of Huong Son SFE. 12 Table 4. Standing volume and biomass carbon of Vinh Tu Commune. 12
Table 5. Biomass carbon stock in Huong Son SFE. 15
Table 6. Biomass carbon stock in Vinh Tu Commune. 16
Table 7. Soil loss in Huong Son. 18
Table 8. Soil loss in Vinh Tu. 19
Table 9. The most species rich family in Huong Son. 23
Table 10. List of high priority conservation lora species in Huong Son. 23
Table 11. Ecosystem service in Huong Son. 29
Background
The Forest Stewardship Council (FSC) focuses on certifying, based on a set of criteria, timber products sourced from sustainably managed forests. FSC has actively recognized and promoted the concept of ecosystem services (ES) as an important forest function. This is relected by a decision of the FSC membership in 2011 to include speciic references to ES in FSC Statutes and By-Laws. In addition, the revised FSC Principles & Criteria (P&C) now explicitly refer to ES by requiring their maintenance, conservation and/or restoration by forest managers.
The Forest Certiication for Ecosystem Services (ForCES) project aims to expand FSC certiication to include additional ES by researching, analyzing and ield testing innovative ways of evaluating and rewarding the provision of critical ES (FSC 2012). ForCES is currently tested across four countries: Viet Nam, Chile, Indonesia and Nepal. The ten selected test sites have diferent socio-political and environmental conditions.
In Viet Nam, this project is being implemented by SNV Netherlands Development Organization in Huong Son Forest Enterprise in Ha Tinh province and Vinh Tu Commune, Vinh Linh district, Quang Tri province. A key activity in the early phase of the ForCES project is to identify which ES are available within the pilot sites. Identifying the value and distribution of the diferent ES will be important in identifying the particular ES to target and prioritize under the various project activities. It will also be used in combination with a market demand analysis to determine which ES will be earmarked for use in the development of a business model for each pilot province.
Objective
This study aims to produce maps, using existing and available secondary national level data, that clearly show key ecosystem services in the two pilot areas, including carbon, biodiversity (with the use of appropriate proxy measures), watershed areas and other measurable ES.
Ecosystem services
a valuable tool in weighing trade-ofs in environmental decision-making and land-use planning.
Ecosystem services have been deined as the beneits people obtain either directly or indirectly from ecological systems (Costanza, d’Arge, and Groot 1998). They include products such as food, timber material, fuel and iber; regulating services such as climate stabilization and lood control; and nonmaterial assets such as recreational value. They directly and indirectly occur at multiple spatial scales, from climate regulation and carbon sequestration at the global scale, to water supply, lood control and nutrient cycling. They also vary with regard to how directly connected they are with human life, with services like climate regulation being highly indirect, while food, raw materials, and recreational opportunities are far more direct (Wilson and Carpenter 1999).
The 2003 Millennium Ecosystem Assessment divided ES into four categories: provisioning (e.g. food, fresh water, fuel, genetic resources), regulating (e.g. climate, disease and lood regulation), cultural (e.g. recreation, aesthetics, and education), and supporting (services necessary for production of other ecosystem services, e.g. soil formation, waste treatment, and nutrient cycling).
Study sites
Viet Nam
Viet Nam is the easternmost country on the Indochina Peninsula, which is in Southeast Asia. The People’s Republic of China (PRC) borders it to the north, Lao PDR to the northwest, Cambodia to the southwest, and the Paciic Ocean to the east (Figure 2). Three-fourths of its 329 000 square kilometers (km2) land area is hilly or mountainous, with river deltas and marshlands prominent in the coastal lowlands. With a population of over 89 million, Viet Nam is the 13th most populous country in the world.
Viet Nam is rich in biodiversity with about 11 458 species of fauna, 21 017 species of lora and 3 000 species of microorganisms. The IUCN Red List of Threatened Species ranking of countries with the largest number of threatened species placed Viet Nam 6th, 15th and 18th for reptiles, mammals and birds, respectively (WCMC 1994). The country also harbors globally important populations of some of Asia’s most threatened animals, such as the Java Rhinoceros, Crested Argus, Edwards Pheasant, Green Peafowl and Tonkin Snub-nosed Monkey. The unique biodiversity of Viet Nam is under threat by a growing population of 89 million people and the accompanying increases in forest degradation due to economic activity and wildlife trading.
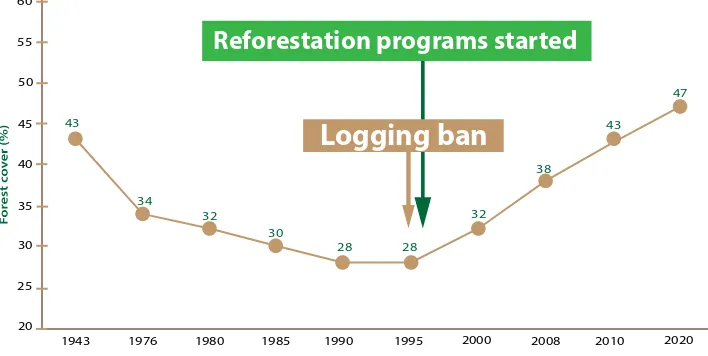
In 1943, Viet Nam had 14.3 million hectares (ha) of natural forest, accounting for 43 percent of the country’s total land area.
Figure 1. Forest cover of Viet Nam from 1943 to 2010 and projection to 2020 (MARD).
For this ForCES project, the two selected pilot sites are Huong Son SFE, Ha Tinh Province and Vinh Tu Commune, Vinh Linh District, Quang Tri Province.
Huong Son SFE
The site in Ha Tinh Province consists of around 38 000 ha of hilly and lowland forest classiied as production forest and managed by the Huong Son State Forest Company. This site is a hot spot for biodiversity value and it plays an important role, serving as the corridor that connects Pu Mat National Park of the Vu Quang Natural Reserve in Viet Nam and Nam Chouan National Park in Lao PDR.
The pilot site faces considerable threats from deforestation and degradation, as
well as poaching of its wildlife. Ha Tinh province is also among the proposed new sites for the UN REDD Progamme. Huong Son State Forest Company owns forest area in the watershed of Ngan Pho River and has borders with Vu Quang National Park and Lao PDR. Local awareness of the pressures on ecosystem services and the eforts to protect these as well as awareness of the FSC is considerable. TFT had carried out the certiication
pre-20
1943 1976 1980 1985 1990 1995 2000 2008 2010 2020
Reforestation programs started
assessment in Huong Son in 2002. Since then, the Huong Son Company has conducted numerous activities to develop capacity and raise awareness on FSC (TFT, 2002). The Ministry of Agriculture and Rural Development in Viet Nam approved the sustainable forest management plan of the company in 2011.
Vinh Tu Commune
Vinh Tu Commune is located in the sandy coastal area of Vinh Linh district, Quang Tri province, 30 kilometers (km) to the North from Dong Ha City and adjacent to National Highway 1. The commune population is 3 265 within 943 households, 7.1 percent of which fall into the “poor” category. Vinh Tu has a total natural area of 3 539 ha with 350 ha of shrub forests on sand dunes and 1 800 ha of plantation forest scattered throughout ten villages. Initial research shows that Vinh Tu’s sand forests are homes to rich biodiversity resources typical of Viet Nam’s coastal sand ecosystems.
Presently, the Vietnamese government puts the shrub forests under communal administration management. While this is a positive policy in handling the managing and giving ownership of forests to local people, there remain issues on the enforcement of forest protection measures due to the commune’s limited resources and capacity.
Methods and data
Ecosystem service identiication
Ideally, the best method for deining ecosystem services (ES) is by quantifying its economic value. By estimating and accounting for the economic value of ES, social costs or beneits that otherwise would remain hidden can potentially be revealed and vital information that might otherwise remain outside of the economic decision making calculus at local, national, and international scales can be internalized (Millennium Ecosystem Assessment 2003).
Such an approach is employed in payment for ecosystem service (PES) and for carbon payment mechanisms such as th Clean Development Mechanism (CDM) or recently, REDD+. However, it is not feasible or practical in this study to estimate the monetary value of the entire ecosystem services of Huong Son and Vinh Tu site because of the signiicant cost and time required for this activity.
An alternative approach that can be used for this study is to deine ES by its functions and use it as a proxy to estimate the ES. The Millennium Ecosystem Assessment (2003) proposed four main functions of an ecosystem:
n
n Provision: timber, material, water n
n Regulation: regulation of hydrological system, lood control n
n Culture: recreation, historical site, well-being, research and education n
n Support: soil nutrition circle, biodiversity
The following services can be identiied as particular to the study sites in Huong Son and Vinh Tu:
Provisioning service
n
n The Timber/Wood Volume Map can be derived from forest cover maps (by type,
therefore the quality of forest). Enables identiication, by area, of the timber/wood production provided by a particular forest.
n
n A Biomass Carbon Map can be derived following the same logic. n
n NTPT value, mostly from bamboo forest, can be estimated by statistics (area of bamboo
and density of bamboo within an area of one hectare) or derived from the forest status map extracted based on type of bamboo.
n
n Other NTPT values mostly from bamboo shoots, mushroom, medicines, etc., can be
Regulating service
n
n A Soil Loss/Erosion Potential Map can be derived based on a universal soil loss equation
(USLE), mostly using factors such as land cover, soil, slope, and rainfall. We can assess the service of regulating hydrological regime, thus preventing soil erosion.
n
n A Watershed Protection Classiication Map can be derived from soil erosion maps and
slope/hydrological maps. This value can help assess the regulating services needed by forests.
n
n Riparian Area Protection Maps can be derived from river network and probably slope
maps. This map will help identify areas sensitive to riverbank erosion.
Supporting service
n
n This service supporting other ES (such as primary production, nutrient process) is
directly or indirectly related to biodiversity conservation.
n
n Map of neighborhood to biodiversity centers (national park, nature reserve) can be
derived showing distance of the site to nearest park/reserve.
n
n The information related to species richness and endangered species can be used to
assess biodiversity.
Cultural service
n
n This service concerns mainly the aesthetic, spiritual, educational and recreational
values of the forest.
n
n The maps showing cultural protection sites or nature-based tourist or recreational
sites can be used as cultural service.
n
n For some cases, ethnic minority communities practice traditional cultivation methods
Table 1. Proposed ecosystem services at study sites.
1 Provisioning
1.1 Forest status map Map
1.2 Timber volume map Map
1.3 Biomass carbon map Map
1.4 NTPF value Data table and report
2 Regulating
2.1 Soil erosion potential Map
2.2 Watershed protection classiication Map
2.3 Riparian area protection Map
3 Support
3.1 Habitat: national park, natural reserve Map
3.2 Species richness, threaten species Data table and report
3.3 Species card Report
4 Cultural / social function
4.1 Cultural site protection Map
4.2 Agriculture and other uses Map
Data used
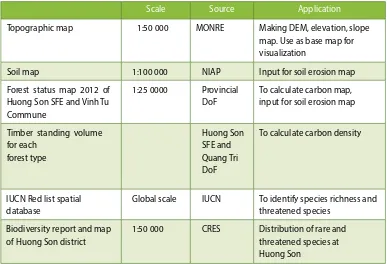
The data used to make an ES map of the study area is summarized in Table 2. Due to the availability of a new forest inventory in Huong Son, a highly detailed forest status map was developed with a scale of 1:25 000. For Vinh Tu, the team collected the most updated forest map with detailed information on the age of plantation forests, which is important in the accurate calculation of biomass carbon.
Table 2. Data used for ecosystem mapping.
Scale Source Application
Topographic map 1:50 000 MONRE Making DEM, elevation, slope map. Use as base map for visualization
Soil map 1:100 000 NIAP Input for soil erosion map
Forest status map 2012 of Huong Son SFE and Vinh Tu Commune
1:25 0000 Provincial DoF
To calculate carbon map, input for soil erosion map
Timber standing volume
IUCN Red list spatial database
Global scale IUCN To identify species richness and threatened species
Biodiversity report and map of Huong Son district
1:50 000 CRES Distribution of rare and threatened species at Huong Son
Forest biomass carbon estimation
The method used for forest biomass carbon stock estimation has three main steps: 1) estimation of above ground biomass (AGB); 2) estimation of below ground biomass (BGB); and 3) estimation of forest carbon stock in total biomass. In this study, the soil carbon was not estimated because there is no direct research reference for soil carbon content in the two study sites and the global data on soil carbon is too coarse to be used at the scale of this work.
Step 1 Estimation of above ground biomass of forests
Overall formula for esimaion of AGB is:
AGB = VOB*WD*BEF Where:
VOB is inventoried wood volume over bark expressed in m3;
WD is basic wood density expressed in tonnes/ m3; and
In this formula, each variable is calculated as follows:
VOB is averaged wood volume taken from the naional forest inventory carried out for the period 2000 – 2005 by the Forest Planning and Inventory Insitute (FIPI). VOB will be analyzed for deined forest types.
WD is the average basic wood. The average basic wood density for tropical trees is 0.55 (0.40 – 0.69) (Reyes et al. 1992).
BEFs are calculated for deined forest types using volume data from the naional inventory. The calculaion of BEF of tropical forests follows the equaion developed by Brown, S. et al (1989), as follows:
i) If SB < 190 tonnes dry mater/ha
BEF = Exp (3.123 – 0.506*ln(SB))
ii) If SB >= 190 tonnes/ha
BEF take a default value of 1.74
Where
SB is stem biomass and is calculated as: SB = VOB*WD
Step 2 Estimation of below ground biomass of forests
BGB is estimated from ratio of BGB to AGB (R factor). The formula for BGB estimation is:
BGB = AGB*R
In this formula, the default value for R used for estimation of BGB is 0.275 (FAO 2008).
Step 3 Estimation of carbon stock in forest biomass
By applying the three steps explained above using average wood volume provided by Huong Son and Vinh Tu (Tables 3 and 4), we can calculate ABG and BGB for each forest type in the two study sites. The biomass carbon was calculated for diferent species and ages in Vinh Tu where plantation forest data is available down to plot level. In Huong Son, the average standing volume of 55 m3/ha was used for all plantation plots.
Table 3. Standing volume and biomass carbon of Huong Son SFE.
Evergreen broadleaves forest – Rich 220 133 37 169
Evergreen broadleaves forest – Medium 150 110 30 140
Evergreen broadleaves forest – Poor 75 78 21 100
Evergreen broadleaves forest – Regrowth 49 63 17 81
Bamboo forest 21 11 3 14
Mixed wood-bamboo forest 91 86 24 109
Coniferous forest 163 54 15 69
Plantation forest 55 67 18 85
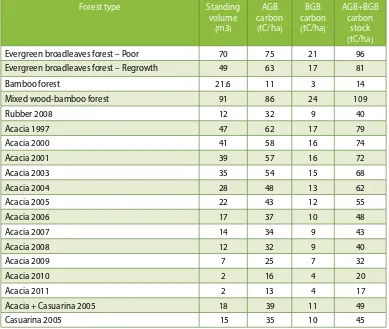
Table 4. Standing volume and biomass carbon of Vinh Tu Commune.
Evergreen broadleaves forest – Poor 70 75 21 96
Evergreen broadleaves forest – Regrowth 49 63 17 81
Bamboo forest 21.6 11 3 14
Mixed wood-bamboo forest 91 86 24 109
Rubber 2008 12 32 9 40
Acacia 1997 47 62 17 79
Acacia 2000 41 58 16 74
Acacia 2001 39 57 16 72
Acacia 2003 35 54 15 68
Acacia 2004 28 48 13 62
Acacia 2005 22 43 12 55
Acacia 2006 17 37 10 48
Acacia 2007 14 34 9 43
Acacia 2008 12 32 9 40
Acacia 2009 7 25 7 32
Acacia 2010 2 16 4 20
Acacia 2011 2 13 4 17
Acacia + Casuarina 2005 18 39 11 49
Soil loss potential estimation
Soil loss was estimated using the universal soil loss equation (USLE). The equation takes the form:
A = R * K * L*S * C
Where
A = estimated average soil loss in tonnes per acre per year R = rainfall-runof erosivity factor
K = soil odibility factor L = slope steepness factor S = slope steepness factor C = cover-management factor
For this study, rainfall data was taken from 30-year average spatial data at one km2 grid (Worldclim v1.4)
K is estimated from soil texture data taken from soil map
LS is derived from DEM that was interpolated from 1:50 000 scale topographic map. C factor is adapted from Morgan 2005 and with adjustment for site condition
Soil loss is calculated as tonnes/ha/ year.
Biodiversity assessment
Biodiversity of the two sites are accessed through the following two main data sources.
IUCN Red list of threatened species spatial database
n
n The IUCN Red List spatial database shows the areas of distribution of threatened
species on a global scale. The database consists of GIS layers that represent the natural distribution of each species. There are associated attributes on taxonomy and threat levels that help the user ilter the database using diferent criteria.
n
n By overlaying the boundary of the study area with the IUCN database, it is possible to
each species that are mapped in the IUCN is already larger than those in the study sites, and therefore we could only extract information on “what species could be potentially found there” but not the “spatial boundaries of species distribution” within the sites.
Biodiversity data from literature
Results
Forest biomass carbon
Huong Son biomass carbon
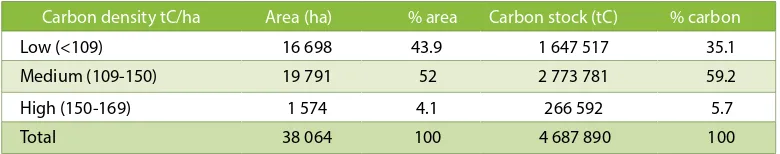
Forest biomass carbon (AGB+BGB) in Huong Son is presented in Table 5 and the biomass carbon map in Figure 3.
Table 5. Biomass carbon stock in Huong Son SFE.
Carbon density tC/ha Area (ha) % area Carbon stock (tC) % carbon
Low (<109) 16 698 43.9 1 647 517 35.1
Medium (109-150) 19 791 52 2 773 781 59.2
High (150-169) 1 574 4.1 266 592 5.7
Total 38 064 100 4 687 890 100
There are a total of 4.68 million tonnes of forest biomass carbon in Huong Son. The average carbon density is very high at 124 tC/ha (tonnes carbon per hectare), which is about two times higher than the Viet Nam national average of 72 tC/ha as reported by FAO (FAO 2010). More than half of the area (56.1 percent), consisting of rich and medium forests, falls into medium and high carbon density classiications. These rich and medium forests are mainly located in the steep slopes along the mountain area of Lao PDR’s border. Protection of this high quality forest is the key not only to maintaining the carbon pool in Huong Son SFE but also in protecting soil from erosion.
Vinh Tu biomass carbon
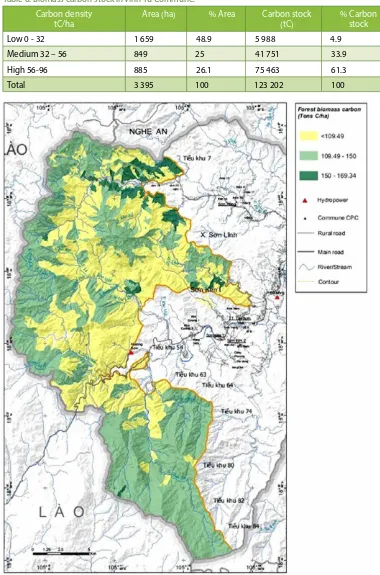
Table 6. Biomass carbon stock in Vinh Tu Commune. Carbon density
tC/ha
Area (ha) % Area Carbon stock (tC)
% Carbon stock
Low 0 - 32 1 659 48.9 5 988 4.9
Medium 32 – 56 849 25 41 751 33.9
High 56-96 885 26.1 75 463 61.3
Total 3 395 100 123 202 100
Potential soil loss
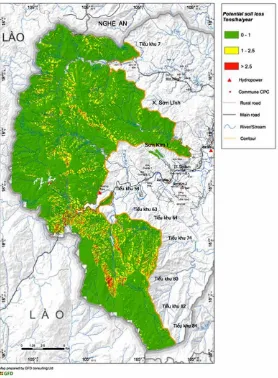
The result of soil loss for Huong Son and Vinh Tu are presented in tables 7 and 8 and in igures 5, 6 and 7.
Huong Son soil loss
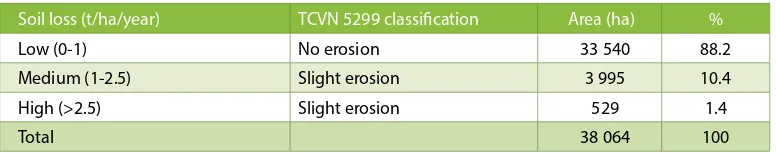
Huong Son has very low risk of soil loss with 88 percent of the area having a soil loss rate of less than 1 tonne/ha/year, which is classiied as no erosion by the Viet Nam standard TCVN 5299 (STAMEQ 2009). This low rate of soil loss can be attributed to the dense canopy of rich and medium forests that cover majority of the area of Huong Son. The soil loss rate is still very low even at the steep slope mountain area along the Lao PDR border (see map in Figure 5). Only in the areas with very steep slopes – at Nuoc Sot stream, Giao An stream, and Giao Bun stream – does soil loss rise to medium and high rates. However, this area is rather small, accounting for less than one percent of the total area. On average, the compartments with the highest rate of soil loss are: 61, 67, 68, 70, 72, 72, 73, 74, 78, 80 and 81 (see Figure 6).
Table 7. Soil loss in Huong Son.
Soil loss (t/ha/year) TCVN 5299 classiication Area (ha) %
Low (0-1) No erosion 33 540 88.2
Medium (1-2.5) Slight erosion 3 995 10.4
High (>2.5) Slight erosion 529 1.4
Total 38 064 100
A simulation of forest cover was conducted to ind out how rich and medium forests help in reducing soil loss. In the USLE model, rich and medium forest areas were transformed into poor forests while other indicators were kept unchanged. The result showed that the total soil loss for the whole Huong Son increased by 40 820 tonnes/year or on average about 1.02 tonne/ha/year. This change afected more than 80 percent of the study area from no erosion to slight erosion, and the remaining areas to high erosion. This result showed one of the important services forests provide in decreasing the risk of soil erosion in Huong Son FE.
Vinh Tu soil loss
Table 8. Soil loss in Vinh Tu.
Soil loss (t/ha/year) TCVN 5299 class Area (ha) %
Low (0-1) No erosion 2 702 79.6
Medium (1-2.5) Slight erosion 241 7.1
High (>2.5) Slight erosion 450 13.3
Total 3 395 100
The area with medium and high rates of soil loss accounts for 21.4 percent of the area and mainly occurs in residential areas. These higher rates of soil loss in residential areas, however, are still rather low and can be classiied as slight erosion based on the national standard, TCVN 5299. On average, the soil loss potential in Vinh Tu is low and should not pose a major risk in the near future. Because the area of Vinh Tu is rather small and soil loss is not signiicant, we did not calculate the compartment’s average value for this site.
Biodiversity
Huong Son SFE biodiversity
The mountainous area in the western part of the Huong Son district, which includes the Son Kim I, Son Kim II and Son Hong communes, forms the corridor connecting the conservation areas of Northern Truong Son: Pu Mat National Park and Vu Quang National Park. The mountainous area also connects to two key biodiversity areas in Lao PDR: the Eastern Bolikhamxay mountains and Nakai-Nam Theun. This region forms the conservation corridors of the Northern Annamites, an area prioritized by the Critical Ecosystem Partnership Fund (CEPF 2012). A study by Hoc, Tran & Vo (2005) reported that there are 113 rare species in Huong Son that are listed in the Viet Nam Red book. More importantly, all ive new mammal species that were recently discovered in Viet Nam can be found in this area, including Sao la (Pseudoryx nghetinhensis), Mang lớn (Megamuntiacus vuquangensis), Cầy giông Tây Nguyên (Viverra taynguyenensis), Thỏ vằn (Nesolagus timminsi) and Mang Trường sơn (Muntiacus truongsonensis).
Figure 8. Location of Huong Son (VNM 47) and Vinh Tu in relation to conservation areas in Viet Nam and the region (CEPF 2012).
Flora
Table 9. The most species rich family in Huong Son.
In the mountain area of Son Kim 2 commune, there are also appearances, although in small numbers, of loral species that have migrated from the Northern temperate system such as Hoàng đàn giả (Dacrydium elatum), Pơ-mu (Fokienia hodginsii), Hồng quang (Rhoiptelea cmpionii), Tần Trung Quốc (Fraxinus chinensis), Chắp tay (Symingtonia populnea) and Song dực Trung Hoa (Dipteris chinensis). These species form the semi-tropical vegetation system that is unique to the study area, giving it a high conservation value.
Table 10. High priority conservation lora species in Huong Son.
# Scieniic name Viet Namese name Conserva
-ion status Landscape
-1 Aquilaria crassna Pierre ex Lec. Trầm hương E o
2 Aristolochia indica L. Khoai ca, Sơn dịch R i, j
3 Caesalpinia sappan L. Tô mộc T t
4 Calamus platyacanthus Warb. ex Becc. Song mật, Mây gai dẹt V j, p
5 Chukrasia tabularis A. Juss. Lát hoa K j
6 Cibotium barometz (L.) J.Sm. Lông cu li K j
7 Cinnamomum balansae Lec. Vù hương R j, o
8 Codonopsis javanica (Bl.) Hook. Ngân đằng Java, Đẳng V o
9 Cycas pectinata Grif. Thiên tuế lược V n
10 Dacrydium elatum Wall. ex Hook. Hoàng đàn giả K p
11 Diallium cochinchinensis Pierre. Xoay, Xây K h, i, j
12 Docynia indica (Wall.) Dcn. Táo mèo R o
13 Drynaria fortunei (Mett.) J.Sm. Ráng đuôi phượng T i, j, q
14 Erythrophloeum fordii Oliv. Lim xanh K i, j
15 Fibraurea recisa Pierre Hoàng đằng V j,o
16 Fokienia hodginsii Henry & Thom. Pơ mu K p
17 Fraxinus chinensis Roxb. Tần Trung Quốc, Sầm R o,s
18 Hedyosmum orientale Merr. & Chun. Mã thương đông R p
19 Hopea pierrei Hance. Kiền kiền K j
20 Limnophila rugosa (Roxb.) Merr. Rau vi, Hồi nước R b, d, e
21 Lithocarpus longipedicellata (H.&C.) A.Cam. Dẻ cuống dài R o
22 Madhuca pasquieri (Dub.) H. J. Lam. Sến dưa K j, o
1 Euphorbiaceae - Họ Thầu dầu 87
2 Leguminosae - Họ Đậu 71
3 Compositae - Họ Cúc 52
4 Rubiaceae - Họ Cà phê 37
5 Gramineae - Họ Lúa 36
6 Orchidaceae - Họ Lan 35
7 Lauraceae - Họ Long não 26
8 Melastomaceae - Họ Mua 26
9 Araceae - Họ Ráy 23
10 Labiatae - Họ Bạc hà 22
Total species of the 10 family
# Scieniic name Vietnamese name Conservaion
status Land-scape
23 Mahonia nepalensis DC. Mã hồ, Hoàng liên ô rô 7V p
24 Markhamia stipulata (Wall.) Seem. ex Thiết đinh lá bẹ V c, j
25 Melanorrhea usitata Wall. Sơn đào R j
26 Ophiopogon tonkinensis Rodr.. Mạch môn Bắc R p
27 Paris polyphylla Sm. Bảy lá một hoa R k, p
28 Platanus kerrii Gagn. Chò n−ớc T c
29 Podocarpus brevifolius (Thunb.) D. Don. Thông tre lá ngắn K p
30 Podophyllum tonkinense Gagn. Bát giác liên E p
31 Pothos kerrii Buch. Cơm lênh kerr R l, q
32 Psilotum nudum (L.) P. Beauv. Lá thông K l, m
33 Rauvolia cambodiana Pierre ex Pit. Ba gạc cambốt T c, k
34 Rhodoleia championii Hook. f. Hồng quang V o
35 Rhopalocnemis phalloides Junghun. Chùy đầu dương hình R o, p
36 Scaphium macropodium (Miq.) Beum.. Lười ươi K i, j
37 Sindora siamensis Teysm. ex Miq. Gụ mật K o
38 Smilax glabra Roxb. Thổ phục linh V h
39 Strophanthus divaricatus (Lour.) Hook.& Arn Sừng dê T h, i
40 Tinospora sinensis (Lour.) Merr. Dây đau xương K h, i,k, p
41 Tournefortia montana Lour. Bò cạp núi T i, o
42 Vitex sumatrana var. urceolata King & Gamb Bình linh lục lạc V h
Fauna
There are 30 fauna species found in Huong Son that are in the IUCN Red list, of which eight are classiied as endangered, 18 as vulnerable and four as critically endangered.
n
n All ive newly discovered mammal species in Viet Nam could be found in Huong Son:
Sao La (Pseudoryxnghetinhensis), Mang lớn (Megamuntiacus vuquangensis), Cầy giông Tây Nguyên (Viverra taynguyenensis), Thỏ vằn (Nesolagus timminsi) và MangTrường Sơn (Muntiacus truongsonensis).
n
n Two rare and important species that should be prioritized for conservation are Voi
(Elephas maximus) and Thỏ vằn (Nesolagus trimminsi).
n
n Primate communities of Voọc vá chân nâu (Pygathrix nemaneus) (E), Cu li nhỏ (Nycticebus pygmaeus), Cu li lớn (N. Concang), Khỉ mốc (M. asamensis), Khỉ mặt đỏ (M. arctoides) can be found in the high mountains of Son Kim 1, Son Kim 2 and Son Hong communes.
Vinh Tu biodiversity
The team conducted an extensive literature review on biodiversity of Vinh Tu but did not ind any direct reference for this area. The closest protected area to Vinh Tu are Bach Ma National Park (VNM 7) and Son Tra Natural Reserve (VNM 81, Figure 8). However, these two areas represent diferent ecosystems and therefore should not be used as a reference for Vinh Tu. Thus, the IUCN Red list database was used as the primary source for Vinh Tu’s biodiversity assessment.
Fauna
In the IUCN Red list database, there are 143 fauna species to be found in Vinh Tu, of which 16 species are amphibian, 21 species are bird, 89 species are mammal and 17 species are reptile. All amphibian species in Vinh Tu are classiied as Least Concerned (LC). Two bird species are classiied Endangered (EN) and two as Critically Engangered . For mammal species, six are classiied as Vulnerable (VU) and three as Near Threatened (NT). There are also two VU reptile species. The list of these species is included as Appendix 7.1.2.
It is important to note that IUCN is a global database and the occurrence of a species on its map (i.e. Vinh Tu) is merely an indication that an area is within the natural distribution reach of that species. That is, the occurrence does not mean that a species was conirmed to be present, either by sighting or capture, in this area.
Vegetation and forest
Most of the natural forest in Vinh Tu has been converted to agriculture land, plantation forest and residential property. There are about 370 ha of natural coastal shrub forest remaining that is actively protected by local people because of its importance in coastal protection and the regulation of ground water. The main vegetation type for this forest is lowland evergreen broad leaf mixed with dry resistance hard-leaf shrub on coastal sand dune. The dominant species on the sand dunes are: Xylosma controversum; Syzygium chalos; Castanopsis ceratacantha; Lithocarpus concentricus); Cratoxylon prunifolium; Vatica obtusifolia; C. ceratacantha, L. sabulicolus, L. dinhensis; Melaleuca cajeputi. In Viet Nam, this forest type is unique to the coastal sandy area of the Northern Middle ecological zone (Thai Van Trung 1978). Today, because the coastal area is heavily exploited, this forest type exists in but a few areas and therefore has high value for biodiversity conservation.
Integration of ecosystem service map
In order to map the prioritized area for each service, the three component maps for biomass, potential soil loss and biodiversity were combined. As a irst step, the biomass carbon and soil loss map were combined using a matrix with nine cells that were made up from 3x3 individual classes of carbon density and soil loss. The combination of cells in the matrix is presented in Figure 11. One diference in the carbon/soil loss matrix of Vinh Tu is that the combination of s1c2, low soil loss and medium carbon, is assigned as “carbon enhancement.” This is to address the fact that the medium carbon class in Vinh Tu belongs to plantation forests that are suitable for carbon enhancement.
Figure 11. Matrix of biomass carbon and soil loss.
In the second step, biodiversity zoning is overlaid on top of the integrated carbon and soil loss map. The biodiversity zoning might cross with the boundary of the carbon/soil loss map and therefore should be considered as a soft zone that could override the carbon/ soil loss map. For example, lat shrub land would normally be used for forest plantation or carbon enhancement. However, if the zoning of biodiversity indicated that this area is a key habitat of endangers species, the planner might need to consider other options geared towards the conservation of biodiversity. In addition, the riparian area protection is mapped using a bufer distance of 100 meters (m) to the main river and 50 m to the stream. The inal result of map integration is shown in Figures 12 and Figure 16.
Huong Son integrated ES map
For Huong Son SFE, the majority of its area can be used for carbon conservation (51 percent) and carbon enhancement (43.2 percent). Sloping areas with moderate to high soil loss (4 percent) should be protected to reduce soil loss. Areas along the stream and river (264 ha, 0.7 percent) should receive riparian protection.
c3
Carbon conservation: High carbon, both high and low soi loss Soil protection: low carbon, high soil loss
Carbon enhancement: Medium to low carbon, medium to low soil loss Carbon and soil proection: medium carbon, medium to high soil loss
Table 11. Ecosystem service in Huong Son.
Ecosystem service Activity Area (ha) %
Carbon conservation
Location: rich and medium forest mainly located in the mountain area along the Lao PDR border.
Protection of exiting rich
Location: step slope of Nuoc Sot stream, Giao An stream, and Giao Bun stream at compartment 61, 67, 68, 70, 72, 72, 73, 74, 78, 80 and 81
Location: most of compartment with poor forest with mean elevation < 500 m contour line to reduce soil erosion.
1 585 4
Riparian protection
Location: 100 m bufer from river and 50 m from stream. Provide stream corridors to protection plant and animal that live in the area between land and river/ stream. Stream corridors link the ecosystems through which the streams low, by providing transportation highways for wildlife, and facilitating nutrient transfer.
Forest protection of 100 m along river and 50 m from stream. Prioritize of self-sustaining riparian and aquatic ecosystems that already exist.
264 0.7
Biodiversity conservation zones (Zone 1, 2, 3 and 4) can be considered as soft functional zoning where both carbon and soil protection come together. Activity planning for these zones should take the value of biodiversity into account. The list of rare and endangered species in these zones should be used as a guide in designing interventions. For example, interventions in the area along the Con River, Van stream and Sinh stream in Zone 1, and the area along Giao An stream in Zone 4, should pay special attention to amphibians and reptiles. Species in these taxa live close to bodies of water or wetland and do not have the ability to travel long distances to new habitats. The character of the interventions in these areas should be designed so that they leave migration corridors and stepping stone areas that will enable amphibians to leave for new habitats. The data presented in Table 10, Figure 9 and appendix 7.1.1 can serve as a starting point for such planning.
Vinh Tu integrated ES map
For Vinh Tu, both plantation forest and coastal shrub forest can be utilized for carbon enhancement. While a forest plantation can quickly increase the carbon pool through the introduction of high yield species, the coastal shrub forest is a unique natural ecosystem and should be protected not only for carbon but also for its biodiversity value. During ield interviews, the villagers of Vinh Tu demonstrated understanding of and enthusiasm in maintaining their coastal shrub forest since it acts as a green belt protecting the village from storms and sand drifting in from the sea. The remaining natural forest also provides valuable non-timber forest products (NTFPs) such as herbal medicine. It also contributes to the well-being of the local community.
Table 12. Ecosystem service in Vinh Tu.
Ecosystem service Activity Area (ha) %
Soil protection:
Location: mainly in residential area
Plantation of dry resistant tree such as Casuarina, Eucalyptus, as a green belt to protect house andhome garden
437 13.2
Carbon enhancement
Location: mainly in plantation forest area
Plantation of commercial timber species such as Acacia. Plantation of coastal protection species such as Casuarina and multiple- age, multiple-species plantation should be promoted
Protection of shrub forest, enrichment with local species and application of carefully designed silviculture measures. Strengthen the community management of forest
370 11.2
Riparian protection Plantating of trees along river banks to provide habitats for water loving species
75 2.28
Figure 14. Location of natural coastal shrub forest of Vinh Tu viewed in perspective. Figures on top of arrows indicate elevation.
The shrub forest, as shown in the Vinh Tu map, is actually located near the residential areas. This pattern suggests that villagers might be able to keep the remaining natural shrub forest. One explanation of this land-use practice is that the natural forest located near the village is protecting the village from moving sand dunes and sea storms. Therefore, villagers keep these forest plots on purpose while locating plantation forests at distances further from their residential and agriculture areas. By viewing the map in perspective (Figure 14), it becomes clear that the main area of surviving shrub forest forms a green bell on coastal dunes resulting in the protection of residential lands located in low-lying areas.
Minor CAR 2011-11
Scope of CAR: S Forest Managment Enterprise, resp. Group Entity £ Group Member(s):
FSC P & C Interim Standards for Forest Stewardship in the Socialist Republic of Vietnam, V 1.0
Standard/Norm 6.3.6 Biodiversity is routinely maintained by the retention of marginal habitats e.g. streamside vegetation, vegetation on rocky outcrops, swimps and healths.
Deviation/ Explanation
It was found that there is no protection of marginal habitats. This was checked by the ield visit and by interviews.
Minor CAR 2011-11
Timeframe Next audit
Status Not fulilled
Reason or next steps Upgrade to Major CAR 2012-1
Figure 15. Result of FSC audit for Biodiversity and marginal habitat protection of the Ben Hai Forest Company (GFA 2012).
Although within the community there is a general consensus to protect the natural forest for the beneits of its ecological functions, the forest is surrounded by dense rural communities, which creates a signiicant pressure on the forest. The provincial policy to allocate the forestland to community management must be enforced with strong community-based regulations and a system of independent monitoring and evaluation. In addition, because plantation forests surround this natural forest, there is a risk that new plantations might encroach or produce negative efects on the natural forest brought about by the construction of roads. Even in the case of FSC-certiied forests, the task of protecting biodiversity and marginal habitats is not always enforced. The FSC audit report of the Ben Hai Forest Company located in Vinh Chap, a neighboring commune, shows that the company has not been able to provide adequate “protection of marginal habitats” and that this biodiversity indicator is not fulilled (GFA 2012).
Although the audit report mentions that the company would “implement appropriate measures to correct the nonconformity detected” and that evidence for implemented measures should be sent to the auditor, this is still a post-monitoring and action process. In several FSC audit reports in Viet Nam that we have reviewed, there is a general trend showing that biodiversity is poorly managed and monitored, which could be attributed to the lack of biodiversity data at the local level. Outside of national parks and natural reserves, biodiversity information is very thin and scattered. Biodiversity assessments are not only costly and time consuming but also require specialists that may not be locally available. Therefore, such assessments are usually ignored even by forest enterprises that manage fairly large areas of forest.
Conclusions and recommendations
In Huong Son, about 51 percent of its area falls into the “medium” and “high carbon” classes and therefore should be protected to conserve the existing carbon pool. About 43 percent of the area that falls into the “poor” forest category has potential for carbon enhancement. Among the recommended activities for this area are forest enrichment and natural assisted regeneration in combination with additional planting. About four percent of the Huong Son area accounts for areas with both medium carbon density and medium soil loss potential. A map that prioritizes the activity for each forest compartment has been produced to aid in ecosystem services planning.
In addition to its high potential for biomass carbon sequestration, Huong Son is also the home of many valuable fauna and lora species. All ive new mammal species that were recently discovered in Viet Nam can be found in Huong Son including Sao la (Pseudoryx nghetinhensis), Mang lớn (Megamuntiacus vuquangensis), Cầy giông Tây Nguyên (Viverra taynguyenensis), Thỏ vằn (Nesolagus timminsi) and Mang Trường sơn (Muntiacus truongsonensis). Huong Son also has a strategic position in biodiversity conservation by serving as a natural corridor connecting several existing national parks and natural reserves, such as Pu Mat and Vu Quang in Viet Nam and the Eastern Bolikhamxay mountains and Nakai-Nam Theun in Lao PDR. Therefore, fresh activity planning for this area should take biodiversity conservation into account. Lists and maps of rare and endanger species presented in this report could be used as guides in designing responsive activities that will minimize negative efects on marginal habitats. A full list of lora and fauna species derived by ground survey (Hoc, Tran, and Vo 2005) and by IUCN is presented in the Appendix.
Because of high coverage of quality forest, the rate of potential soil loss in Huong Son is rather low. About 88.2 percent of the area has no soil loss (<1 tonne/ha/year) and 10.4 percent of the area experiences only slight soil loss. The result of simulations derived by changing all rich and medium forests to poor forests showed that soil loss would increase by 40 820 tonnes/year. This result clearly highlighted the important service high quality forests render in reducing soil erosion.
It was also observed that in the forest area’s of the Ben Hai forest company (located in a neighboring commune), where FSC for forest management has been certiied, biodiversity monitoring and protection of marginal habitat has not been fulilled. In the current FSC certiication process and reporting there is no requirement that the forest owner or the auditor provide detailed information on biodiversity. Typically only the actual encroachment on protection or special-use forest is recorded as evidence of disturbance, though monitoring of species composition and richness is not part of the FSC auditing process. The efort to incorporate additional ecosystem services into FSC certiication is therefore a important initiative moving forward for mainstreaming biodiversity into the production sector.
References
CEPF 2012. Ecosystem Proile: Indo-Burma Biodiversity Hotspot, 2011 Update.
Costanza, R, d’Arge, R and de Groot, R 1998 “The Value of the World’s Ecosystem Services and Natural Capital.” Ecological Economics.
FAO 2010, Global Forest Resources Assessment 2010, Rome.
FSC 2012, ForCES: Expanding FSC Certiication to Ecosystem Services, http://ic.fsc.org/ forces-pilot.129.htm.
GFA 2012, Public Summary Audit Report Ben Hai Forestry Company.
Ho, P 2000, Cay Co Viet Nam, Science and Technology Publishing House. Hanoi, Vietnam.
Hoc, Truong Quang, Dinh Nghia Tran, and Thanh Son Vo 2005, Biodiversity Assessment of North Truong Son Conservation Area.
Millennium Ecosystem Assessment 2003, Ecosystems and Human Well-Being: A Framework for Assessment, In Island Press, Washington, DC.
STAMEQ 2009, Vietnam National Standard TCVN 5299:2009: Soil Quality - Method for Determination of Soil Erosion by Rain, Hanoi, Vietnam.
Thai Van Trung 1978, Forest Vegetation of Vietnam, Science and Technology Publishing House, Hanoi, Vietnam.
VAST 1996, Sach Do Viet Nam, Science and Technics Publishing House, Hanoi, Vietnam.
VAST. 2000. Sach Do Viet Nam, Science and Technics Publishing House, Hanoi, Vietnam.
Appendix
IUCN threatened species in Huong Son and Vinh Tu
IUCN Red list group
Extinct (EX) No known individuals remaining.
Extinct in the Wild (EW) Known only to survive in captivity, or as a naturalized population
outsideits historic range.
Critically Endangered (CR) Extremely high risk of extinction in the wild.
Endangered (EN) High risk of extinction in the wild.
Vulnerable (VU) High risk of endangerment in the wild.
Near Threatened (NT) Likely to become endangered in the near future.
Least Concern (LC) Lowest risk. Does not qualify for a more at risk category.
Wide-spread and
abundant taxa are included in this category.
Data Deicient (DD) Not enough data to make an assessment of its risk of extinction.
Not Evaluated (NE) Has not yet been evaluated against the criteria.
IUCN threatened species in Huong Son
Amphibians
SPP STATUS SPP STATUS
Duttaphrynus melanostictus LC Microhyla pulchra LC
Ingerophrynus galeatus LC Amolops archotaphus LC
Fejervarya limnocharis LC Amolops cremnobatus NT
Hoplobatrachus rugulosus LC Babina chapaensis LC
Limnonectes blythii NT Hylarana erythraea LC
Limnonectes hascheanus LC Hylarana macrodactyla LC
Limnonectes khammonensis DD Hylarana maosonensis LC
Limnonectes kuhlii LC Hylarana nigrovittata LC
Occidozyga lima LC Hylarana taipehensis LC
Amphibian
SPP STATUS SPP STATUS
Quasipaa verrucospinosa NT Odorrana chloronota LC
Hyla simplex LC Odorrana morafkai LC
Leptobrachium chapaense LC Odorrana nasica LC
Leptolalax pelodytoides LC Odorrana orba DD
Ophryophryne microstoma LC Rana johnsi LC
Ophryophryne pachyproctus LC Chiromantis vittatus LC
Xenophrys major LC Kurixalus verrucosus LC
Kalophrynus interlineatus LC Polypedates leucomystax LC
Kaloula pulchra LC Polypedates mutus LC
Microhyla butleri LC Rhacophorus dennysi LC
Microhyla issipes LC Rhacophorus orlovi LC
Microhyla heymonsi LC Rhacophorus rhodopus LC
Microhyla marmorata LC Theloderma asperum LC
Birds
SPP STATUS SPP STATUS
Aquila clanga VU Emberiza aureola VU
Aquila heliaca VU Sterna acuticauda NT
Ichthyophaga humilis NT Pelecanus philippensis NT
Ichthyophaga ichthyaetus NT Pavo muticus EN
Sarcogyps calvus CR Rheinardia ocellata NT
Alcedo hercules NT Mulleripicus pulverulentus VU
Cairina scutulata EN Picus rabieri NT
Anhinga melanogaster NT Pavo muticus EN
Anorrhinus austeni NT Rheinardia ocellata NT
Buceros bicornis NT Mulleripicus pulverulentus VU
Mycteria leucocephala NT Picus rabieri NT
Corvus torquatus NT Numenius arquata NT
Mammals
SPP STATUS SPP STATUS
Rattus rattus LC Hipposideros pomona LC
Tragulus kanchil LC Ia io LC
Bandicota savilei LC Kerivoula hardwickii LC
Chiromyscus chiropus LC Kerivoula picta LC
Hapalomys delacouri VU Macroglossus sobrinus LC
Niviventer tenaster LC Megaderma lyra LC
Tamiops maritimus LC Megaderma spasma LC
Tamiops rodolphii LC Megaerops niphanae LC
Crocidura indochinensis LC Miniopterus pusillus LC
Euroscaptor klossi LC Murina aurata LC
Crocidura fuliginosa LC Murina aurata LC
Crocidura attenuata LC Murina cyclotis LC
Chimarrogale himalayica LC Murina tubinaris LC
Vandeleuria oleracea LC Myotis annectans LC
Rhizomys pruinosus LC Myotis horsieldii LC
Ratufa bicolor NT Myotis montivagus LC
Rattus tanezumi LC Myotis muricola LC
Rattus nitidus LC Myotis siligorensis LC
Rattus exulans LC Pipistrellus cadornae LC
Petaurista philippensis LC Pipistrellus coromandra LC
Petaurista elegans LC Pipistrellus javanicus LC
Niviventer langbianis LC Pipistrellus paterculus LC
Niviventer fulvescens LC Pipistrellus tenuis LC
Mus pahari LC Rhinolophus ainis LC
Mus cookii LC Rhinolophus luctus LC
Arctogalidia trivirgata LC Rhinolophus pearsonii LC
Leopoldamys sabanus LC Rhinolophus pusillus LC
Leopoldamys edwardsi LC Rousettus leschenaultii LC
Hystrix brachyura LC Scotomanes ornatus LC
Hylopetes alboniger LC Scotophilus heathii LC
Dremomys ruigenis LC Scotophilus kuhlii LC
Chiropodomys gliroides LC Sphaerias blanfordi LC
Callosciurus erythraeus LC Taphozous melanopogon LC
Berylmys bowersi LC Tylonycteris pachypus LC
Bandicota indica LC Tylonycteris robustula LC
Atherurus macrourus LC Suncus murinus LC
Mammals
SPP STATUS SPP STATUS
Viverra zibetha NT Galeopterus variegatus LC
Viverra megaspila VU Hylomys suillus LC
Prionodon pardicolor LC Nesolagus timminsi DD
Paradoxurus hermaphroditus LC Callosciurus inornatus LC
Paguma larvata LC Hylopetes phayrei LC
Herpestes urva LC Maxomys surifer LC
Herpestes javanicus LC Mus caroli LC
Chrotogale owstoni VU Myotis pilosus NT
Arctictis binturong VU Rattus andamanensis LC
Arielulus aureocollaris LC Rhizomys sumatrensis LC
Aselliscus stoliczkanus LC Cervus nippon LC
Glischropus tylopus LC Muntiacus rooseveltorum DD
Hipposideros scutinares VU Muntiacus truongsonensis DD
Kerivoula kachinensis LC Muntiacus vaginalis LC
Kerivoula titania LC Muntiacus vuquangensis EN
Miniopterus fuliginosus LC Rusa unicolor VU
Myotis chinensis LC Neofelis nebulosa VU
Phoniscus jagorii LC Panthera pardus NT
Pipistrellus pulveratus LC Bos gaurus VU
Rhinolophus malayanus LC Panthera tigris EN
Rhinolophus marshalli LC Pardofelis marmorata VU
Rhinolophus paradoxolophus LC Pardofelis temminckii NT
Rhinolophus shameli LC Prionailurus bengalensis LC
Rhinolophus stheno LC Canis aureus LC
Rhinolophus thomasi LC Capricornis milneedwardsii NT
Rousettus amplexicaudatus LC Capricornis milneedwardsii NT
Tadarida latouchei DD Pseudoryx nghetinhensis CR
Tupaia belangeri LC Helarctos malayanus VU
Martes lavigula LC Helarctos malayanus VU
Sus scrofa LC Helarctos malayanus VU
Manis javanica EN Helarctos malayanus VU
Manis pentadactyla EN Ursus thibetanus VU
Aonyx cinerea VU Ursus thibetanus VU
Mammals
SPP STATUS SPP STATUS
Lutra lutra NT Ursus thibetanus VU
Lutrogale perspicillata VU Miniopterus magnater LC
Melogale moschata LC Nomascus siki EN
Melogale personata DD Nycticebus bengalensis VU
Mustela kathiah LC Nycticebus pygmaeus VU
Mustela strigidorsa LC Macaca arctoides VU
Coelops frithii LC Macaca assamensis NT
Cynopterus brachyotis LC Macaca leonina VU
Cynopterus sphinx LC Macaca mulatta LC
Eonycteris spelaea LC Pygathrix nemaeus EN
Harpiocephalus mordax DD Trachypithecus phayrei EN
Hipposideros armiger LC Mus musculus LC
Hipposideros cineraceus LC Cuon alpinus EN
Hipposideros larvatus LC Prionailurus viverrinus EN
Reptiles
SPP STATUS SPP STATUS
Acanthosaura lepidogaster LC Draco maculatus LC
Ahaetulla prasina LC Naja siamensis LC
Calamaria septentrionalis LC Oligodon cinereus LC
Naja kaouthia LC Oligodon cyclurus LC
Protobothrops mucrosquamatus LC Ophiophagus hannah VU
Ptyas carinata LC Protobothrops sieversorum LC
Sibynophis collaris LC Sinonatrix aequifasciata LC
Takydromus hani DD Varanus bengalensis LC
Takydromus sexlineatus LC Varanus salvator LC
Typhlops diardii LC Hemidactylus frenatus LC
Xenopeltis unicolor LC Hemidactylus frenatus LC
IUCN threatened species in Vinh Tu
Amphibians
SPP STATUS SPP STATUS
Duttaphrynus melanostictus LC Microhyla heymonsi LC
Fejervarya limnocharis LC Microhyla pulchra LC
Hoplobatrachus rugulosus LC Hylarana guentheri LC
Occidozyga lima LC Hylarana macrodactyla LC
Occidozyga martensii LC Hylarana nigrovittata LC
Kaloula pulchra LC Hylarana taipehensis LC
Microhyla butleri LC Polypedates leucomystax LC
Microhyla issipes LC Ichthyophis kohtaoensis LC
Birds
SPP STATUS SPP STATUS
Aquila clanga VU Sterna acuticauda NT
Aquila heliaca VU Pavo muticus EN
Ichthyophaga humilis NT Rheinardia ocellata NT
Ichthyophaga ichthyaetus NT Mulleripicus pulverulentus VU
Sarcogyps calvus CR Pavo muticus EN
Anhinga melanogaster NT Rheinardia ocellata NT
Anorrhinus austeni NT Mulleripicus pulverulentus VU
Buceros bicornis NT Eurynorhynchus pygmeus CR
Mycteria leucocephala NT Numenius arquata NT
Emberiza aureola VU Jabouilleia danjoui NT
Emberiza aureola VU
Mammals
SPP STATUS SPP STATUS
Rattus rattus LC Cynopterus brachyotis LC
Tragulus kanchil LC Cynopterus sphinx LC
Bandicota savilei LC Hipposideros armiger LC
Berylmys berdmorei LC Hipposideros larvatus LC
Rattus argentiventer LC Hipposideros pomona LC
Rattus losea LC Kerivoula hardwickii LC
Tamiops maritimus LC Kerivoula picta LC
Tamiops rodolphii LC Macroglossus sobrinus LC
Crocidura fuliginosa LC Megaderma lyra LC
Crocidura attenuata LC Megaderma spasma LC
Mammals
SPP STATUS SPP STATUS
Rattus tanezumi LC Miniopterus pusillus LC
Rattus exulans LC Murina cyclotis LC
Petaurista philippensis LC Myotis horsieldii LC
Niviventer fulvescens LC Myotis muricola LC
Leopoldamys sabanus LC Myotis siligorensis LC
Leopoldamys edwardsi LC Pipistrellus cadornae LC
Hystrix brachyura LC Pipistrellus coromandra LC
Hylopetes alboniger LC Pipistrellus javanicus LC
Dremomys ruigenis LC Pipistrellus tenuis LC
Callosciurus erythraeus LC Rhinolophus ainis LC
Bandicota indica LC Rhinolophus luctus LC
Atherurus macrourus LC Rhinolophus pusillus LC
Viverricula indica LC Rousettus leschenaultii LC
Viverra zibetha NT Scotomanes ornatus LC
Paradoxurus hermaphroditus LC Scotophilus heathii LC
Paguma larvata LC Scotophilus kuhlii LC
Herpestes urva LC Taphozous melanopogon LC
Herpestes javanicus LC Tylonycteris pachypus LC
Glischropus tylopus LC Tylonycteris robustula LC
Kerivoula kachinensis LC Suncus murinus LC
Miniopterus fuliginosus LC Hylomys suillus LC
Rhinolophus malayanus LC Maxomys surifer LC
Rhinolophus stheno LC Mus caroli LC
Rhinolophus thomasi LC Muntiacus vaginalis LC
Rousettus amplexicaudatus LC Rusa unicolor VU
Dendrogale murina LC Prionailurus bengalensis LC
Tupaia belangeri LC Helarctos malayanus VU
Martes lavigula LC Ursus thibetanus VU
Pipistrellus abramus LC Miniopterus magnater LC
Sus scrofa LC Nycticebus bengalensis VU
Aonyx cinerea VU Nycticebus pygmaeus VU
Lutra lutra NT Macaca mulatta LC
Reptiles
SPP STATUS SPP STATUS
Ahaetulla prasina LC Draco maculatus LC
Lycodon paucifasciatus VU Oligodon cinereus LC
Naja kaouthia LC Oligodon cyclurus LC
Ptyas carinata LC Ophiophagus hannah VU
Sibynophis collaris LC Varanus bengalensis LC
Takydromus sexlineatus LC Varanus salvator LC
Typhlops diardii LC Hemidactylus frenatus LC
Xenopeltis unicolor LC Hemidactylus frenatus LC
Cryptelytrops albolabris LC
List of species from CRES (2005) study for Huong Son
Vietnam Red list species in Huong Son
E= Endangered, V= Vulnerable, T= Threatened, T NT = Near threatened, R=Rare, K= Insuiciently known
Flora (42 species)
TT Latin name Vietnam name Vietnam Red
list class
1 Aquilaria crassna Trầm hương E
2 Aristolochia indica Khoai ca, Sơn địch R
3 Caesalpinia sappan Tô mộc T
4 Calamus platyacanthus Song mật, V
5 Chukrasia tabularis Lát hoa K
6 Cibotium barometz Lông cu li K
7 Cinnamomum balansae Vù hương R
8 Codonopsis javanica Ngân dằng java V
9 Cycas pectinata Thiên tuế lược V
10 Dacrydium elatum Hoàng đàn giả K
11 Diallium cochinchinensis Xoay, Xây K
12 Docynia indica Táo mèo R
13 Drynaria fortunei Ráng đuôi phượng T
Flora (42 species)
TT Latin name Vietnam name Vietnam Red
list class
15 Fibraurea recisa Hoàng đằng V
16 Fokienia hodginsii Pơ mu K
17 Fraxinus chinensis Tần trung quốc, Sầm R
18 Hedyosmum orientale Mã thương đông R
19 Hopea pierrei Kiền kiền K
20 Limnophila rugosa Rau vi, Hồi nước R
21 Lithocarpus longipedicellata Dẻ cuống dài R
22 Madhuca pasquieri Sến dưa K
23 Mahonia nepalensis Mã hồ, Hoàng liên ô rô V
24 Markhamia stipulata Thiết đinh lá bẹ V
25 Melanorrhea usitata Sơn đào R
26 Ophiopogon tonkinensis Mạch môn bắc R
27 Paris polyphylla Bảy lá một hoa R
28 Platanus kerrii Chò nước T
29 Podocarpus brevifolius Thông tre lá ngắn K
30 Podophyllum tonkinense Bát giác liên E
31 Pothos kerrii Cơm lênh kerr R
32 Psilotum nudum Lá thông K
33 Rauvolia cambodiana Ba gạc cambốt T
34 Rhodoleia championii Hồng quang V
35 Rhopalocnemis phalloides Chuỳ đầu dương hình R
36 Scaphium macropodium Lười ươi K
37 Sindora siamensis Gụ mật K
38 Smilax glabra Thổ phục linh V
39 Strophanthus divaricatus Sừng dê T
40 Tinospora sinensis Dây đau xương K
41 Tournefortia montana Bò cạp núi T
Mammal (22 species)
TT Latin name Vietnam name Vietnam Red
list class
1 Cynocephalus veriegatus Chồn dơi R
2 Manis pentadactyla Tê tê vàng V
3 Manis javanica Tê tê V
4 Nycticebus coucang Cu li lớn V
5 Nyeticebus pygmaeus Cu li nhỏ V
6 Macaca assamensis Khỉ mốc V
7 M. nemestrina Khỉ đuôi lợn V
8 M. aretoides Khỉ cộc V
9 Semnopithecus phayrei Voọc xám V
10 Pygathrix nemaeus Chà vá chân nâu E
11 Nomascus leucogenys Vượn má trắng E
12 Cuon alpinus Sói đỏ E
13 Ursus malaynus Gấu chó E
14 U. thibetarus Gấu ngựa E
15 Lutra lutra Rái cá thường V
16 Aoryx cinerea Rái vuốt bé V
17 Vierra tainguensis Cầy giông tây nguyên V
18 Prionodon pardicolor Cầy gấm R
19 Arctictis binturong Cầy mực V
20 Chrotogale owstoni Cầy vằn bắc V
21 Catopuma temmincki Báo lửa E
22 Pardofelis nebulosa Báo gấm V
23 Panthera tigris Hổ E
24 Elephas maximus Voi châu á V
25 Tragulus javanicus Cheo cheo Java V
26 Megamuntiacus vuqangensis Mang lớn V
27 Naemorhedus sumatraensis Sơn dương V
TT Latin name Vietnam name Vietnam Red list class
29 Ratufa bicolor Sóc đen R
30 Petaurista petaurista Sóc bay lớn R
Bird (16 species)
1 Lophura hatinhensis Gà lôi lam đuôi trắng E
2 Lophura nycthemera Gà lôi trắng T
3 Rheinartia ocellata Trĩ sao T
4 Treron seimundi Cu xanh Seimun R
5 Carpococcyx renauldi Phướn đất T
6 Alcedo hercules Bồng chanh rừng T
7 Megaceryle lugubris Bói cá lớn T
8 Ptilolaemu s tickelli Niệc nâu T
9 Aceros nipalensis Niệc cổ hung E
10 Buceros bicornis Hồng hoàng T
11 Serilophus lunatus Mỏ rộng xanh T
12 Pitta nipalensis Đuôi cụt bụng vằn T
13 Pitta cyanea Đuôi cụt đầu đỏ R
14 Jabouilleia danjoui Khướu mỏ dài T
15 Paradoxornis davidianus Khướu mỏ dẹt đuôi ngắn T
16 Temnurus temnurus Chim khách đuôi cờ T
Amphbian and reptiles (18 species)
1 Bufo galeatus Cóc rừng R
2 Rana andersoni Chàng anđecsơn T
3 Rhacophorus nigropalmatus ếch cây chân đen T
4 Gekko gecko Tắc kè T
5 Acanthosaura lepidogaster Ô rô vảy T
6 Physignathus cocincinus Rồng đất V
7 Varanus salvator Kỳ đà hoa V
8 Python molurus Trăn đất V
9 Ptyas korros Rắn ráo T
TT Latin name Vietnam name Vietnam Red list class
11 Bungarus fasciatus Rắn cạp nong T
12 Naja naja Rắn hổ mang T
13 Ophiophagus hannah Rắn hổ chúa E
14 Platysternum megacephalum Rùa đầu to R
15 Cistoclemmys galbinifrons Rùa hộp trán vàng V
16 Cuora trifasciata Rùa hộp ba vạch V
17 Testudo elongata Rùa núi vàng V
18 Manouria impressa Rùa núi viền V
Fish (4 species)
1 Anguilla japonica Cá Chình Nhật E
2 Onychostoma laticeps cá Sỉnh gai V
3 Spinibarbus hollandi cá Chày đất V
4 Anguilla marmorata Cá Chình hoa R
Insect (4 species)
1 Phyllium succiforlium Bọ lá V
2 Attacus atlas Bướm Khế R
3 Argema maenas Bướm đuôi xanh dài lá chuối R
IUCN Red list species in Huong Son
LC= Least concerned, NT= Near threatened, VU=Vulnerable, EN=Endangered, CR= Critically endangered, EW= Extinct in the wild, EX= Extinct
Mammal (22 species)
# Latin name Vietnam name IUCN class (2000)
1 Manis pentadactyla Tê tê vàng LR/nt
2 Manis javanica Tê tê LR/nt
3 Nycticebus coucang Cu li lớn VUA1 cd
4 Nyeticebus pygmaeus Cu li nhỏ VUA1 cd
5 Macaca assamensis Khỉ mốc VUA1 cd
6 M. nemestrina Khỉ đuôi lợn VUA1 cd
7 M. mulatta Khỉ vàng LR/nt
8 M. aretoides Khỉ cộc VUA1 cd
9 Pygathrix nemaeus Chà vá chân nâu ENA1 cd
10 Nomascus leucogenys Vượn má trắng DD
11 Cuon alpinus Sói đỏ VUC 2a
12 Ursus malaynus Gấu chó DD
TT Tên khoa học Tên Việt Sách Đỏ IUCN (2000)
13 U. thibetarus Gấu ngựa VUA1 cd
14 Lutra lutra Rái cá thường VU A2 cde
15 Chrotogale owstoni Cầy vằn bắc VUA1 cd
16 Catopuma temmincki Báo lửa VUC2a(i)
17 Pardofelis nebulosa Báo gấm VUC2a(i)
18 Panthera tigris Hổ ENC2a(i)
19 Elephas maximus Voi châu á ENA1 cd
20 Naemorhedus sumatraensis Sơn dương VUA 2 cd
21 Pseudoryx nghetinhensis Sao la ENC1 +2a (i)
Bird (7 species)
# Latin name Vietnam name IUCN class (2000)
1 Lophura hatinhensis Gà lôi lam đuôi trắng EN
2 Rheinartia ocellata Trĩ sao VU
3 Arborophila charltonii Gà so ngực gụ LR/nt
4 Alcedo hercules Bồng chanh rừng LR/nt
5 Ptilolaemu s tickelli Niệc nâu LR/nt
6 Aceros nipalensis Niệc cổ hung VU
7 Anthracoceros malabaricus Cao cát bụng trắng LR/nt
Amphibian & reptiles (10 species)
1 Python molurus Trăn đất LR
2 Platysternum megacephalum Rùa đầu to EN
3 Cistoclemmys galbinifrons Rùa hộp trán vàng CR
4 Cuora trifasciata Rùa hộp ba vạch CR
5 Pyxidea mouhoti Rùa sa nhân EN
6 Sacalia quadriocellata Rùa bốn mắt EN
7 Testudo elongata Rùa núi vàng EN
8 Manouria impressa Rùa núi viền VU
9 Palea steindachneri Ba ba gai EN
RECOFTC’s mission is to enhance capacities for stronger rights, improved governance and fairer beneits for local people in sustainable forested landscapes in the Asia and the Paciic region.
RECOFTC holds a unique and important place in the world of forestry. It is the only international not-for-proit organization that specializes in capacity development for community forestry.
RECOFTC engages in strategic networks and efective partnerships with governments, nongovernmental organizations, civil society, the private sector, local people and research and educational institutes throughout the Asia-Paciic region and beyond. With over 25 years of international experience and a dynamic approach to capacity development – involving research and analysis, demonstration sites and training products – RECOFTC delivers innovative solutions for people and forests.
RECOFTC – The Center for People and Forests P.O. Box 1111