CHAPTER III
METHODOLOGY
A. Research Method
The method that used in this research is Quasi-Experimental method. Quasi-Experimental method is contained not random of participants in group. Quasi-Experiment make individuals assigned to the two groups may have selection factors that go uncontrolled in the experiment (Creswell, 2012).
B. Research Design
The research design that used in this research is two group pre-test post-test designs. According to Sukmadinata (2011), it could be called as matching pre-test post-test comparison group design without control group. Both of class become an experimental class by non-random taken a group. A pre-test provides a measure on some attribute or characteristic that researcher would assess for participants in experiment before they receive a treatment, while a post-test is a measure on some attribute or characteristic that is assessed for participants in experiment after they receive a treatment (Creswell, 2012). The illustration of research design is described as follow.
Table 3.1 Research Design: Matching Pre-test Post-test Comparison Group
Experiment
(Boys Class) T1 X1 T2
Experiment
(Girls Class) T1 X2 T2
(Sukmadinata, 2011) Note:
T1 = Pre-test T2 = Post-test
X1 and X2 = Treatment (Student Team Achievement Division (STAD)) C. Population and Sample
language and implementing National Curriculum of 2013 combined with Zambak Modular system.
The population in this research is 7th grade students. The samples are two classes in seventh grade, which are girl class and boy class. The sampling technique that used is Purposive Sampling. Fraenkel and Wallen (2007) stated that in purposive sampling, researcher use personal judgment to select a sample. Researchers assume they can use their knowledge of the population to judge whether or not a particular sample will be representative. While in this research, researcher need the sample that already separated by class which are girl and boy class.
D. Operational Definition
In order to avoid misconception about this research, thus some operational definitions are explained in this research. Those terminologies are explained as follow:
1. Learning activities using Student Teams Achievement Divisions (STAD) which is one of Slavin’s cooperative learning approaches. Learning process is conducted through several steps which are; teach, team study, test, and team recognition. These stages will be ensured by observation sheet.
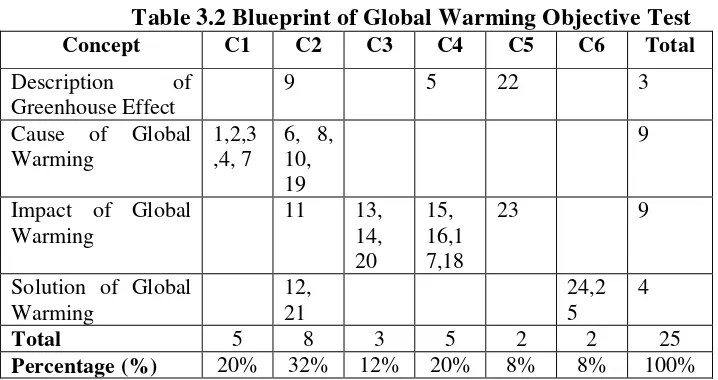
2. Students’ Cognitive in this research is the students’ understanding that covers the level of cognitive such as remembering (C1), understanding (C2), applying (C3), analyzing (C4), evaluating (C5), and creating (C6). This competence is measured by using multiple choice questions (pretest and posttest).
4. Gender in this research is the state of being male or female and also instruments are described below:
1. Objective Test
Objective test is an instrument which will be used to measure students’ cognitive. It contains of multiple choice question based on Bloom’s Taxonomy. For measure students’ cognitive in learning global warming using STAD, researcher used pretest and posttest.
a. Pretest
Pretest will be conducted in the beginning of teaching learning process. It will measure the prior knowledge of student before conducting Student Team Achievement Division (STAD) design. b. Posttest
Posttest will be conducted after teaching learning process using Student Team Achievement Division (STAD) design was done. It will measure the knowledge of student after learning global warming to know whether there is an improvement or not.
Table 3.2 Blueprint of Global Warming Objective Test
2. Questionnaire
Questionnaire is an instrument of non-direct communication technique (Kunandar, 2008). This instrument will be used as a tool to measure students’ attitude toward science after learning global warming. This questionnaire is developed by Barry J. Fraser named Test of Science Related Attitudes (TOSRA).
TOSRA is designed to measure seven distinct science-related attitudes among secondary school students. These scales are called Social Implications of Science, Normality of Scientists, Attitude to Scientific Inquiry, Adoption of Scientific Attitudes, Enjoyment of Science Lessons, Leisure Interest in Science, and Career Interest in Science. The seven scales are suitable for group administration and all can be administered within the duration of a normal class lesson. Furthermore TOSRA has been carefully developed and extensively field tested and has been shown to be highly reliable. It contains 70 questions and every 10 questions represent 7 scales of science related attitude (Fraser, 1981).
Since this research conducted to measure the student’s attitude towards global warming lessons, thus researcher only choose 3 scales from that 7 scales, which are; Attitude to Scientific Inquiry, Adoption of Scientific Attitudes, Enjoyment of Science Lessons. Since researcher only uses 3 scales thus; the total number of statement-question is 30.
Table 3.3 Blueprint of Students’ Attitude Questionnaire
Indicators Category and Number Total
Attitude to Scientific Inquiry
Positive Statement : 1, 7, 13, 19, 25 5 Negative Statement : 4, 10, 16, 22, 28 5 Adoption of
Scientific Attitude
Positive Statement : 2, 8, 14, 20, 26 5 Negative Statement : 5, 11, 17, 23, 29 5 Enjoyment of
Science Lesson
Positive Statement : 3, 9, 15, 21, 27 5 Negative Statement : 6, 12, 18, 24, 30 5
3. Observation Sheet
Observation sheet is an instrument used to ensure the teaching process using Student Team Achievement Division (STAD) design. It will assess whether the step of teaching is already suitable with the Student Team Achievement Division (STAD) stages or not.
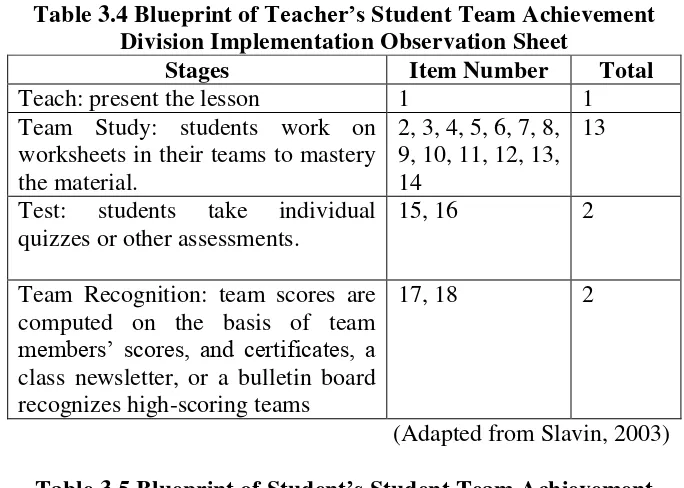
Table 3.4 Blueprint of Teacher’s Student Team Achievement Division Implementation Observation Sheet
Stages Item Number Total
Teach: present the lesson 1 1
Team Study: students work on worksheets in their teams to mastery the material.
2, 3, 4, 5, 6, 7, 8, 9, 10, 11, 12, 13, 14
13
Test: students take individual quizzes or other assessments.
15, 16 2
Team Recognition: team scores are computed on the basis of team members’ scores, and certificates, a class newsletter, or a bulletin board recognizes high-scoring teams
17, 18 2
(Adapted from Slavin, 2003) Table 3.5 Blueprint of Student’s Student Team Achievement
Division Implementation Observation Sheet
Stages Item Number Total
Teach: students pay attention and listening to teacher explanation
1 1
Team Study: students work on worksheets in their teams to mastery the material.
2, 3, 4, 5, 6, 7, 8, 9, 10, 11, 12, 13, 14
13
Test: students take individual quizzes or other assessments.
15, 16 2
Team Recognition: students got the team score and accomplishment from the teacher
17, 18 2
F. Instrument Development
There are several steps to validate the objective test instrument. The step is described as follows:
1. Validity
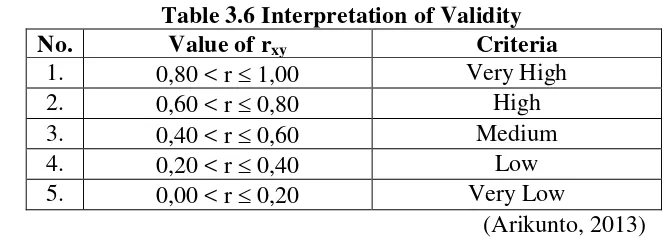
Validity is defined as the extent to which the instrument measures what it is designed to measure that emphasizes not on the test itself, but on the result (Arikunto, 2013).
The formula and the interpretation to determine validity is shown below:
= � ∑ − ∑ ∑
√{� ∑ ∑ ^ }{� ∑ ∑ ^ }
Where:
rxy = coefficient correlation or item validity
X = sum of total score of all students for each question’s item
X = sum of total score of all students for whole test N = total number of student
X = score of each student for each question’s item Y = total score of each student
(Arikunto, 2013) Table 3.6 Interpretation of Validity
No. Value of rxy Criteria
1. 0,80 < r 1,00 Very High
2. 0,60 < r 0,80 High
3. 0,40 < r 0,60 Medium
4. 0,20 < r 0,40 Low
5. 0,00 < r 0,20 Very Low
(Arikunto, 2013)
2. Reliability
= (� − )� −∑
Where:
r11 = instrument reliability k = amount of test item
pq = multiplication result of p and q s = deviation standard
(Arikunto, 2013) Table 3.7 Interpretation of reliability
No. Reliability Coefficient Criteria
1. 0,80 < r 1,00 Very High
2. 0,60 < r 0,80 High
3. 0,40 < r 0,60 Medium
4. 0,20 < r 0,40 Low
5. 0,00 < r 0,20 Very Low
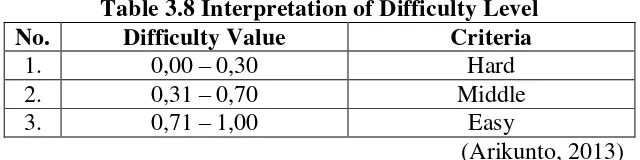
(Arikunto, 2013) 3. Difficulty Level
According to Arikunto (2013) good quality question has to be arranged in balance; the proportion should not consist of whole easy or hard questions, since easy question will not make students desperate and doesn’t have any motivation to solve it. The formula and the interpretation to determine validity is shown below:
� =��
Where:
P = difficulty level
B = number of students who answer correctly N = total number of student
(Arikunto, 2013) Table 3.8 Interpretation of Difficulty Level
No. Difficulty Value Criteria
1. 0,00 – 0,30 Hard
2. 0,31 – 0,70 Middle
3. 0,71 – 1,00 Easy
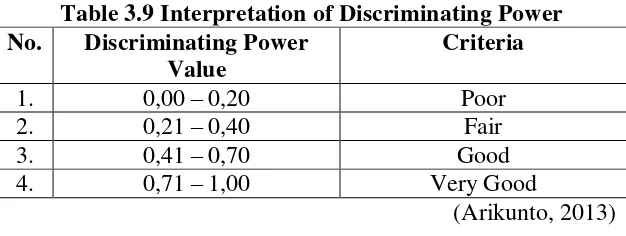
4. Discriminating Power
Discriminating power is described as the ability of particular question to distinguish student who classified as higher achievement and lower achievement (Arikunto, 2013). The formula and the interpretation to determine validity is shown below:
�� =�� −��
Where:
DP = discriminating power
Ba = the number of upper group who answer correctly Ja = total of students in upper group
Bb = the number of upper group who answer incorrectly Jb = total of students in lower group
(Arikunto, 2013)
Table 3.9 Interpretation of Discriminating Power No. Discriminating Power
Value
Criteria
1. 0,00 – 0,20 Poor
2. 0,21 – 0,40 Fair
3. 0,41 – 0,70 Good
4. 0,71 – 1,00 Very Good
(Arikunto, 2013)
5. Distractor
Distractor is described as the incorrect alternatives or choices in a selected response item in multiple choice questions (Mueller, 2014). According to Instructional Assessment Resources (2011) distractors should appeal to low scorers who have not mastered the material whereas high scorers should infrequently select the distractors and the acceptable range of each distractor should be selected by at least a few students.
The interpretation of the distractor described as follows:
2) One distractor that is selected by as many or more students than the correct answer may indicate a confusing item and/or options.
According to Rustaman (2012) there are the characteristics of good distractor such as:
1) There is student who choose especially from lower group 2) Chosen by most of lower group rather than upper group 3) At least chosen by 5% of total student
4) The amount of student in upper group who choose the distractor is not equal with the amount of student in upper group who choose the key answer.
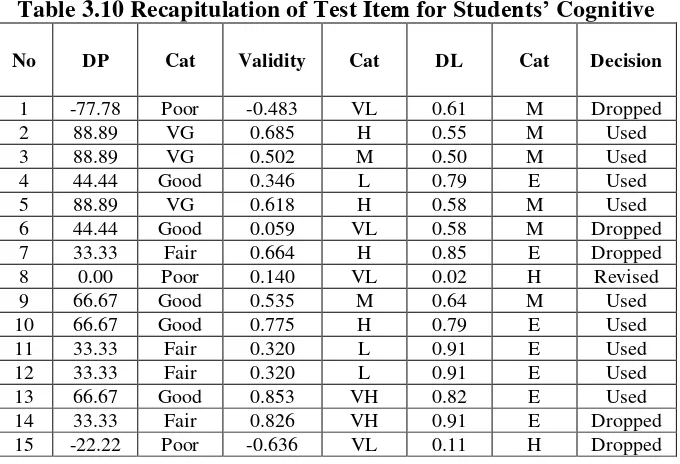
The instrument for measuring students’ cognitive is by giving an objective test in a form of 40 questions. The instrument should be tested in terms of validity, reliability, discriminating power, and difficulty level as explained before. The test was given to 34 students which have learned about the chapter that will be learned for the research. The recapitulation of test item analysis is shown in the following table.
Test item recapitulation:
Reliability test : 0.88 (Very High degree)
Table 3.10 Recapitulation of Test Item for Students’ Cognitive
No DP Cat Validity Cat DL Cat Decision
1 -77.78 Poor -0.483 VL 0.61 M Dropped
2 88.89 VG 0.685 H 0.55 M Used
3 88.89 VG 0.502 M 0.50 M Used
4 44.44 Good 0.346 L 0.79 E Used
5 88.89 VG 0.618 H 0.58 M Used
6 44.44 Good 0.059 VL 0.58 M Dropped
7 33.33 Fair 0.664 H 0.85 E Dropped
8 0.00 Poor 0.140 VL 0.02 H Revised
9 66.67 Good 0.535 M 0.64 M Used
10 66.67 Good 0.775 H 0.79 E Used
11 33.33 Fair 0.320 L 0.91 E Used
12 33.33 Fair 0.320 L 0.91 E Used
13 66.67 Good 0.853 VH 0.82 E Used
14 33.33 Fair 0.826 VH 0.91 E Dropped
No DP Cat Validity Cat DL Cat Decision
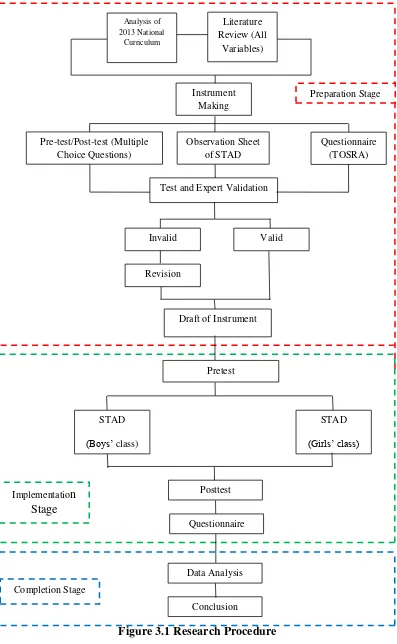
In this research the procedure will described with several stages such as:
1. Preparation Stage
a. The first step of preparation stage is analyzing several things which will explain in the literature review such as:
1) The curriculum of National Curriculum to find out what kind of concept that will be used for this research.
2) Student Team Achievement Division (STAD) as an independent variable.
3) Students’ cognitive and attitude as dependent variable. 4) Global Warming concept as a concept to conduct this
5) Gender as the factor that influence the research.
b. Generate the research problem and determine the focus of the research.
c. Construct the research instrument.
d. Validate the instrument to the expert or lecturer.
e. Revised of research instrument after having suggestions. f. Try out of research instrument.
g. Revised of research instrument based on instrument try out analysis result.
2. Implementation Stage
The implementation stage of this research is described as follows:
b. Distribute the pretest to the entire sample in order to obtain students’ prior knowledge about global warming.
c. Conduct teaching learning process using Student Team Achievement Division (STAD) in both girl and boy class. d. Distribute the posttest to the entire sample in order to obtain
students’ final knowledge and their gain score after learning global warming.
e. Distribute the questionnaire of TOSRA in order to measure about students’ attitude in learning global warming using STAD.
f. Make a result recapitulation from the data that gained before to be analyzed in the next stage.
3. Completion Stage
a. Analyze the data that already gained before based on the instrument that is used.
b. Discuss the result that already analyzed before. c. Draw the conclusion from this research.
Analysis of 2013 National
Curriculum
Literature Review (All
Variables)
Preparation Stage
Implementation Stage
Completion Stage
Instrument Making
Pre-test/Post-test (Multiple Choice Questions)
Questionnaire (TOSRA)
Revision
Test and Expert Validation Observation Sheet
of STAD
Draft of Instrument
Posttest
Data Analysis
Conclusion Questionnaire
Pretest
Invalid Valid
STAD
(Boys’ class)
STAD
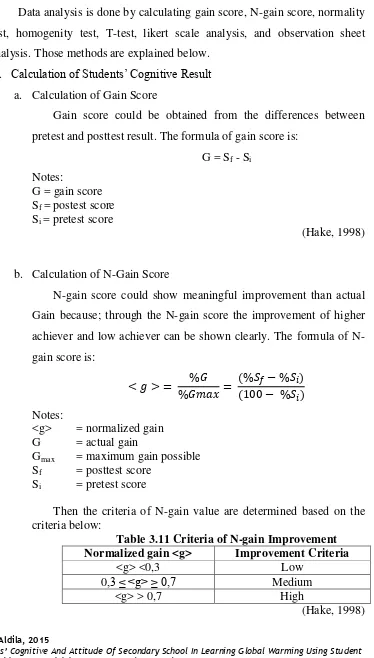
H. Data Analysis
Data analysis is done by calculating gain score, N-gain score, normality test, homogenity test, T-test, likert scale analysis, and observation sheet analysis. Those methods are explained below.
1. Calculation of Students’ Cognitive Result a. Calculation of Gain Score
Gain score could be obtained from the differences between pretest and posttest result. The formula of gain score is:
G = Sf - Si Notes:
G = gain score Sf = postest score Si = pretest score
(Hake, 1998)
b. Calculation of N-Gain Score
N-gain score could show meaningful improvement than actual Gain because; through the N-gain score the improvement of higher achiever and low achiever can be shown clearly. The formula of N-gain score is:
< � > = %��%� = %��− %�− %��
�
Notes:
<g> = normalized gain G = actual gain
Gmax = maximum gain possible Sf = posttest score
Si = pretest score
Then the criteria of N-gain value are determined based on the criteria below:
Table 3.11 Criteria of N-gain Improvement Normalized gain <g> Improvement Criteria
<g> <0,3 Low
0,3 ≤ <g> ≥ 0,7 Medium
<g> > 0,7 High
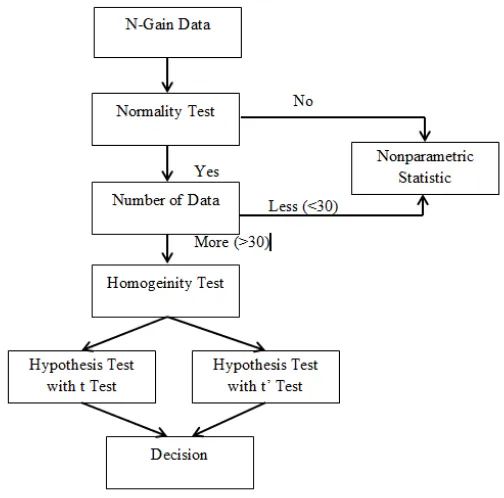
c. Normality Test
Normality test is to know whether the sample comes from population that has normal distribution or not. In this research, Normality test uses statistic test from IBM SPSS Statistics 20.0, Kolmogorov-Smirnov with significancy level (α) is 0,05. When significance value > 0,05, H0 will be accepted and H1 will be rejected or denied if significance value < 0,05. The hypotheses are: H0 : Sample comes from population that has normal distribution. H1 : Sample comes from population that has not normal distribution. (Santoso, 2010).
Although the data has normal distribution, but if the number of sample is less than 30, it can be continued to use non-parametric statistic of Mann-Whitney rather than parametric statistic on the next stages. When significance value > 0,05, H0 will be accepted and H1 will be rejected or denied if significance value < 0,05 (Santoso, 2010). The hypotheses are:
H0 : There is no significant difference result of students’ cognitive between boys and girls classes.
H1 : There is significant difference result of students’ cognitive between boys and girls classes.
d. Homogeneity Test
e. Testing Hypothesis
This test is used to determine the differences of objective test result between boys and girls group. This test might be used using SPSS. Criteria of this test is H0 will be rejected if tcomputation > ttable and H0 will be accepted if tcomputation < ttable (Santoso, 2010). This test is used in pretest and posttest result of students in boys and girls classes. The hypothesis is to test the differences of average pretest and posttest result in boys and girls classes as follows:
H0 : There is no difference result of students’ cognitive between girl and boy class.
H1 : There is difference result of students’ cognitive between girl and boy class.
These hypothesis tested based on this data analysis flow:
Figure 3.2 Chart of Data Analysis
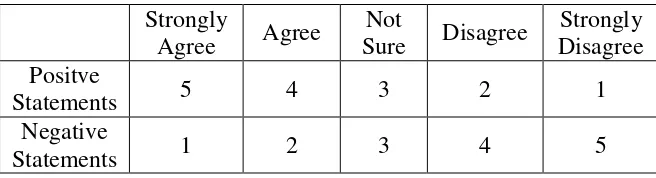
(Santoso, 2010) 2. Calculation of Students’ Attitude Result
Table 3.12 Guideline of Students’ Attitude
Strongly
Agree Agree
Not
Sure Disagree
Strongly Disagree Positve
Statements 5 4 3 2 1
Negative
Statements 1 2 3 4 5
The percentage data would be obtained by this formula: P = �
� x 100%
Notes:
P : Percentage
f : score from frequency of the answer n : score from total response
(Sugiono, 2011)
3. Calculation of Observation Sheet Result
For calculating the observation sheet the result could be obtained by this formula:
� � = max �� %