1 Korespondensi dengan penulis dapat dilakukan melalui: [email protected] FOR 4-6TH GRADERS
Irine Kurniastuti 1 Saifuddin Azwar 2
Faculty of Psychology Universitas Gadjah Mada
This study was aimed to develop an instrument of student well-being measurement for elementary school. The scale was based on the review of well-being research in children by Pollard and Lee (2003) adapted to the school context referring to the psychological well-being approach suggested by Ryff and Keyes (1995). The process of construction of the scale was started by making three parallel scales. Each scale composed was tested on 200 respondents, so the total number of the respondents was 600. The results of the analysis of the three scales were used as the basis for preparing a compilation scale. The compilation scale was then tested on 215 respondents. The results of the analysis of the compilation scale showed that 39 items composed had satisfying psychometric properties, i.e. the reliability coefficient, item discrimination index, and content validity, while structurally, factor structures still needed to be improved.
Keywords: elementary school, psychological well-being, student well-being
Student well-being pada anak usia Sekolah Dasar di Indonesia belum banyak dikaji, demikian pula usaha untuk mengembangkan indikator yang relevan untuk mengungkap
well-being anak di sekolah belum banyak dilakukan. Di sisi lain, alat ukur untuk mengetahui well-being siswa sangat dibutuhkan seiring dengan meningkatnya kesadaran masyarakat terhadap well-being siswa di sekolah. Penelitian ini bertujuan untuk mengembangkan instrumen pengukuran student well-being dalam konteks Sekolah Dasar (SD). Skala yang dikembangkan didasarkan pada reviu penelitian well-being pada anak yang dilakukan oleh Pollard dan Lee (2003) dan disesuaikan dengan konteks sekolah yang mengacu pada pendekatan kesejahteraan psikologis dari Ryff dan Keyes (1995). Penelitian dilakukan dengan menyusun tiga skala paralel. Setiap skala yang disusun ini diujikan kepada 200 responden, sehingga total responden adalah 600 siswa. Hasil analisis terhadap ketiga skala dijadikan dasar untuk menyusun satu skala kompilasi. Skala kompilasi ini kemudian diujikan kepada 215 responden. Hasil analisis terhadap skala kompilasi menunjukkan bahwa 39 aitem yang disusun mempunyai properti psikometris yang memuaskan jika ditilik dari koefisien reliabilitas, daya beda aitem, dan validitas konten, sedangkan secara struktural, struktur faktornya masih perlu diperbaiki.
Kata kunci: kesejahteraan psikologi, sekolah dasar, student well-being
Middle-childhood span is an important time for children to develop their various competencies
cognitively, socially, and emotionally. Children who succeed in passing the middle-childhood well will
develop an attitude of good self-acceptance, confidence, and good relationships with others (Eccles, 1999).
The success experienced by children in this age becomes predictive power of emotional development and
behavior in the future (Eid & Larsen, 2008). On the other hand, middle-childhood can also be a vulnerable
period and at risk for children if they do not make it through the challenges of this period (Eccles, Lord, &
(Charlesworth, Wood, & Viggiani, 2007), especially the well-being of children in schools. Case studies of
school-quitting client in Consulting Psychology Unit show that mostly it occurs in the mid-range of
childhood (Ampuni & Andayani, 2007).
The discussion about middle-childhood cannot be separated from the environment and school
despite the fact that many factors influence it (Charlesworth et al., 2007). Children’s condition in school will
affect his/her well-being. Schools become an important context in the development of children well-being in
middle-childhood, which is also often referred to school age. Well-being of school children cannot be viewed
separately from the context of the school because children spend a lot of time in school (Eccles, 1999).
The results of Huebner and Gilman study (2006) on life satisfaction in children as an indicator of
well-being suggested that when children felt dissatisfaction with the school, they were more susceptible to a
variety of behavioral problems in the future. This underscores the importance of protecting children’s well
-being in school environment, such as the effort by the World Health Organization (WHO) in promoting
mental health and well-being at school; the students seek emotional and social well-being (WHO, 2011).
This is supported also by Gutman and Feinstein (2008) and Opdenakker and Van Damme (2000) who found
that the experiences in schools have an important role to the well-being of children.
However, researches on children’s well-being, especially during the middle-childhood period are
still rare to find (Gadermann, 2009). In Indonesia, research on children's well-being school context has not
been done a lot. Efforts to conceptualize the well-being of children is still less satisfying (Fattore, et al.,
2007; Lippman, 2005). Besides, there is not much effort made to make the appropriate well-being measure
for children (Ben-Arieh, 2006). Limitations of the study on the measurement of well-being in children are a
challenge for education to continue pursuing and developing the well-being measurement. This study aims to
develop a student well-being measurement in the context of school, namely Student Well-Being (SWB).
The measuring instrument developed is still at the level of research instruments. Thus, this
instrument cannot be used as a diagnostic tool, but the results can be used as an initial step in the
development of a measurement tool for screening or monitoring purposes. The expected outcome of the
construction of this research is a valid and reliable measuring instrument, which also has feature-items that
are able to distinguish between individuals who have a low-measured attributes and those who have
Theory and Measurement of Well-being
In its development, well-being research is currently dominated by two main approaches, namely
hedonic and eudaimonic (Waterman, 1993). Hedonic approach perceives well-being subjectively. Subjective
well-being is often interchangeable with happiness, namely high positive affect, low negative affect and high
life satisfaction (Deci & Ryan, 2008). The hedonic view improves the well-being of a person by increasing
his happiness (Ryan & Deci, 2001).
The second approach is eudaimonic. Well-being theory that develops from the perspective of
eudaimonic is the Psychological Well-being by Ryff (1989). Ryff and Keyes (1995) suggested that the levels
of psychological well-being is a person’s level in having a purpose in life, realizing the self potencies, having
quality relationships with others, and feeling responsible to his own life. From the perspective of this theory,
well-being tends to be seen as the emergence of a positive self attributes (Keyes, 1998).
The perspective used in this study is the eudaimonic approach, which draws on the theory of
psychological well-being of Ryff and Keyes (1995). Ryff and Keyes (1995) formulated the concept of
psychological well-being which consists of personal growth, self-acceptance, autonomy, purpose in life,
environmental mastery and positive relations with others. The six aspects are then used as the basis for
preparing the construct and modified by adding or subtracting some adjustments to the level of development
of the respondents and the results of research on the well-being of children by Pollard and Lee (2003) and
review of Fraillon (2004) on Student Well-Being (SWB).
Identifying the Measurement Purpose and the Operationalization of Student Well-being Concepts
The purpose of this measurement is to construct a scale to measure the well-being of students in the
school context, the SWB scale. SWB is defined as the level of students' ability to carry out their duties
effectively in the school community (Fraillon, 2004). SWB refers that a better life is more like an effort to
demonstrate the positive potency of a student in the school context.
Researcher’s review resulted in two dimensions of the student well-being. Intrapersonal dimension
consists of six aspects: emotional regulation, resilience, self-esteem, curiosity, engagement, mastery
orientation. Whereas, the interpersonal dimension comprises four aspects: communicative efficacy, empathy,
At the intrapersonal aspects, a student internalizes what he/she felt at himself/herself and turns it into
something that affects his/her function in the school community. Students who have high well-being in
intrapersonal aspects are shown in the following capabilities:
Able to control emotions
Emotion controlling forms the core of the ability to control emotions and includes the
monitoring, evaluation, and modification of emotional reactions (Pollard & Davidson in Frailon,
2004). Emotion controlling is manifested as emotional responses of students indicated fairly and in
accordance with the circumstances around them.
Resilient in facing the problems (having resistance)
The resilience model of this study is aimed to measure difficulty focusing on the expression
of students’ resilience in the hypothetical contexts. The evidence of differences in the level of
students’ resilience is manifested by forcing students to responses that they explicitly show when
facing a number of school hypothetical difficulties.
Not feeling inferior (having high self-esteem)
A prosperous person is indicated by a positive view (Ryff & Singer, 1996) such as
self-respect. Self-respect, which is also known as self-acceptance (Ryff & Singer, 1996), describes the
affective component of self-concept; refers to how a person feels about himself/herself; and is valued
as something fundamental to the construct of intrapersonal well-being (Ryan & Deci, 2001).
Self-esteem included in this aspect is the self-Self-esteem in performance or academic and social.
Having a high curiosity
Ryff and Keyes (1995) emphasize the importance of human beings to grow, be opened to
new experiences, and face new challenges. Humans are expected to have the feelings to continue
growing by developing a curiosity as an intrinsic desire to learn more (Pollard & Davidson, 2001, in
Fraillon, 2004).
Participating in learning and school activities
Ryff and Keyes (1995) wrote that one of environmental mastery forms is participating
actively in the environment. Students’ engagement in the learning process includes the involvement
Persevere in the learning process
Persevere in the learning process is an orientation to proficiency. Orientation to proficiency
is defined as a desire to complete tasks with all of the efforts. A construct broader than
environmental mastery (Ryff & Keyes, 1995, Ryff & Singer, 1996) can be seen as a part of the
orientation on the proficiency and involvement in academic and school activities.
The following aspects are interpersonal aspects which include: the well-being aspect influenced by
the experience of interaction with others, one's assessment of the state of the environment, and its function in
society (Keyes, 1998). These aspects are:
Being able to communicate what he/she feels and thinks (having communicative efficacy)
Communicative efficacy describes the aspects of social competence and positive
relationships with others (Ryff & Singer, 1996). To be able to function effectively in the school
community, students need to interact with all members of the school community including other
students from different grades of schools, teachers, parents, and colleagues.
Positioning themselves in others’ situations (empathy)
Positive relationships with others can be demonstrated by showing empathy (Ryff & Keyes,
1995) cognitively and affectively. Gladstein (1983) suggests cognitive empathy as 'thinking as if
being others' and affective empathy as 'responding with the same emotions as others’.’
Demonstrating confidence and comfort in interacting with friends, teachers, and community
members
Keyes (1998) calls this aspect as an acceptance of the social environment. The acceptance is
an 'understanding of society through the character and quality of others'. It is found in students'
beliefs about the basic goodness of others; therefore, it becomes a construct that includes
interpersonal values that are often mentioned, respect, tolerance, and understanding.
Maintaining good relationships with friends, teachers, and community members (interpersonal
connectedness)
Interpersonal connectedness is 'subjective awareness to establish a close relationship with
'the broader and more scopeof people, as well as the variety of colleagues' (Fuller, in Fraillon, 2004;
Keyes, 1998).
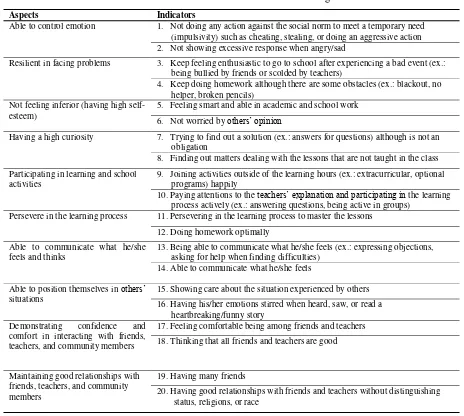
The aspects above are then lowered into the form of behavioral indicators as contained in Table 1.
Table 1. The Indicators of Student Well-Being Behavior
Aspects Indicators
Able to control emotion
1. Not doing any action against the social norm to meet a temporary need (impulsivity) such as cheating, stealing, or doing an aggressive action 2. Not showing excessive response when angry/sad
Resilient in facing problems
3. Keep feeling enthusiastic to go to school after experiencing a bad event (ex.: being bullied by friends or scolded by teachers)
4. Keep doing homework although there are some obstacles (ex.: blackout, no helper, broken pencils)
Not feeling inferior (having high self-esteem)
5. Feeling smart and able in academic and school work
6. Not worried by others’ opinion
Having a high curiosity
7. Trying to find out a solution (ex.: answers for questions) although is not an obligation
8. Finding out matters dealing with the lessons that are not taught in the class
Participating in learning and school activities
9. Joining activities outside of the learning hours (ex.: extracurricular, optional programs) happily
10. Paying attentions to the teachers’ explanation and participating in the learning process actively (ex.: answering questions, being active in groups)
Persevere in the learning process 11. Persevering in the learning process to master the lessons
12. Doing homework optimally
Able to communicate what he/she feels and thinks
13. Being able to communicate what he/she feels (ex.: expressing objections, asking for help when finding difficulties)
14. Able to communicate what he/she feels
Able to position themselves in others’ situations
15. Showing care about the situation experienced by others
16. Having his/her emotions stirred when heard, saw, or read a heartbreaking/funny story
Demonstrating confidence and comfort in interacting with friends, teachers, and community members
17. Feeling comfortable being among friends and teachers
18. Thinking that all friends and teachers are good
Maintaining good relationships with friends, teachers, and community members
19. Having many friends
Procedures of the Measuring Instrument construction
The construction of the items was started by making items and pre-testing the comprehension of the
items draft. Furthermore, the researcher asked for advices from her peer consisting of a literature scholar,
psychology scholars and practitioners often involved with children for the refinement of the items in the
scale. Items refinement included language in terms of compliance with the language of children and the
contextualization with the real children’s well-being in schools.
After the draft of the item was refined and reassembled, panelists who were competent in the
preparation of measuring instruments and related topics judged the relevance of the items with the measured
indicators. Assessment was done by assigning a number between 1 through 5. Assessment results were
analyzed using statistical formulas of Aiken's V as follows:
V= ∑s / [n(c-1)]
s = r-lo
lo = lowest validity assessment value (in this case = 1) c = highest validity assessment value (in this case = 5) r = number given by an appraiser
After that, a pretest to 32 respondents was conducted to know the understanding and acceptance of
the respondents to the items arranged. Then the items were reviewed and refined based on the panelists’
assessment, and the advices from panelists and respondents. The selection of the items was based on the
highest item relevance value and the basic understanding of the pre-test respondents.
Reliability and Validity
Reliability methods used in this study were in the form of internal consistency by computing the α
-coefficients. The validity used is the content validity and the factor structure test. The Aiken's V formula was
used to calculate the content validity coefficient. The factor analysis approach with exploratory factor
analysis/EFA was used to test the factor structure. EFA is often used for data exploration, associated with the
spread of grain on a number of certain latent factors (Brown, 2006).
RESULTS
Item Generation
The first item writing produced 80 items. The results of the first pre-test to 5 elementary school
students showed that sentences in the item draft and the selection method of responses were easy to
understand. Nevertheless, there were still many suggestions to refine the items from the students, elementary
The second item writing produced 115 items. The items were then split into two scales, each of
which contained 55 and 60 items. Each scale was then tested on 17 students and 15 students from the lowest
grade level, the 4th grade.
Meanwhile, the analysis result of the item content from the panelists showed that the V number was
above 0.650. Since the value of V ranges from 0 to 1, then the panelists’ assessment result indicated that the
constructed items were relevant with the indicators measured according to the panelists.
Advices from the panelists were collected and combined with the advice from the pre-test
respondent. After the items were corrected or eliminated as the advice from the panelists and respondents, 80
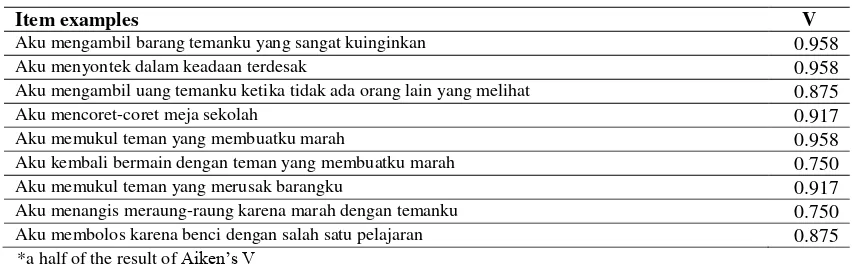
final items were obtained. Some examples of the items are shown in Table 2.
Table 2. Items and assessment results of V
Item examples V
Aku mengambil barang temanku yang sangat kuinginkan 0.958
Aku menyontek dalam keadaan terdesak 0.958
Aku mengambil uang temanku ketika tidak ada orang lain yang melihat 0.875
Aku mencoret-coret meja sekolah 0.917
Aku memukul teman yang membuatku marah 0.958
Aku kembali bermain dengan teman yang membuatku marah 0.750
Aku memukul teman yang merusak barangku 0.917
Aku menangis meraung-raung karena marah dengan temanku 0.750
Aku membolos karena benci dengan salah satu pelajaran 0.875
*a half of the result of Aiken’s V
Alternative Forms Generation
Considering that a scale with many items will make the respondents feel tired and lost focus, which
will affect the scores obtained, shorter alternative scales were drafted and they could be tested in many
subjects at a time. The alternative scales were developed by selecting the best 55 of the 80 items. The
selected 55 items were then duplicated into three parallel scales.
The three parallel scales composed had the same substance presented in different sentences. To make
them easy to distinguish, they were named scale1, scale2, and scale3. Furthermore, each of the scales was
distributed to 200 respondents.
The discriminant index analysis for the items of each scale using standard rix >0.3 indicated that
scale1 successfully managed to capture 21 of the 40 items expected to have a good discriminant index,
Scale Compilation
The number of the targeted items was 40 on the scale. The result of the items selection on scale1,
scale2, and scale3 did not meet the expected target, which was 40 items, in which each indicator had two
items. Therefore, items with the best discriminant index from each scale were compiled to create a single
scale.
The compilation of the three scales, by considering the best discriminant index of the items and the
target fulfillment of one indicator consisted of two items, produced 39 items. The reduction of one item from
the first target was because from the compilation result, there was one indicator that was only represented by
one item. The other items did not qualify because they did not meet the psychometric requirements. The
compiled scale was then ready to be tested again.
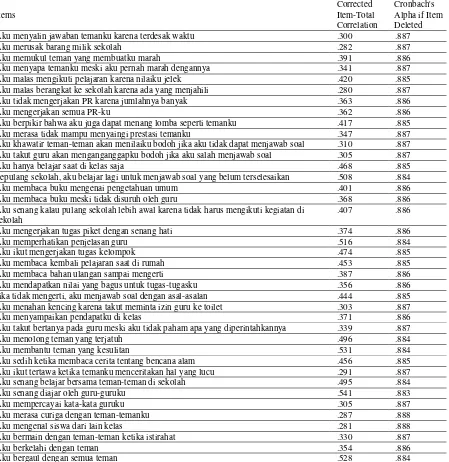
The compilation scale was tested on 215 respondents. The data obtained was then analyzed. The
analysis result of the compiled scale showed that almost all of the items had satisfying discriminant index (rix
>0.3) and only five of them that did not meet the standard rix= 0.3 (see Table 3 in Appendix). However, the
items were not necessarily excluded from the analysis. Discriminant index coefficient of the items
approaching rix = 0.3 was still acceptable considering the scope of the content domain to be disclosed and the
usage purpose of the test results (Azwar, 2012b).
Considering the fulfillment of the measured domain and psychometric requirements based on
item-total correlation coefficient, a number of items approaching nearly the value of rix = 0.3 was still preserved.
Thus, the total of items passing the selection was 39 items.
Reliability Test
The reliability of the 39 best items contained in the compilation scale was then tested. The reliability
was tested using internal consistency reliability which showed that the reliability coefficient based on
Cronbach's Alpha was 0.88.
Factor Structure Analysis
Furthermore, factor analysis was conducted to examine the factor structure. The analysis showed the
value of KMO was 0.815 with a significant Bartlett's Test of Sphericity (<0.01). From these results, it can be
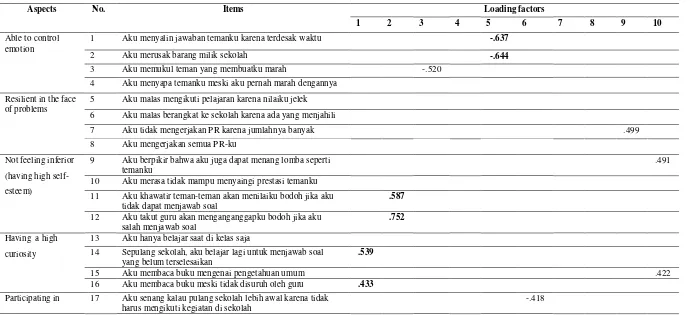
The analysis was done by confirming the aspects that have been made before, namely 10 aspects.
The analysis results are shown in Table 4 (appendix). The result of factor analysis with 10 extracted factors
showed that some items had a very low factor loading to show, some items did not cohere in the expected
factor, and some items managed to cohere in the expected factor.
If the positive and negative signs were ignored, of the 10 factors that were expected to arise on the
result of this analysis, there were four factors corresponding to the construct. These factors were factor5,
factor2, factor1, and factor6. However, of the four items expected to cohere into one factor, there were two
items cohere in the same factor, while the other factor consisting of three items was derived from different
indicators.
Thus, it can be seen that the result of confirmatory factor analysis has not been able to show a
satisfying confirmation result. The emerged factors did not represent the previously arranged factors. This
result raised another question about the factors that actually construct the SWB scale. Therefore, further
analysis with exploratory factor analysis was conducted to determine the factor composition of the SWB
scale.
The exploratory factor analysis performed based on the value of eigenvalues (with 1 as the default
value) resulted in 12 identified factors. Of the twelve factors that emerged, some items did not cohere and
had <0.4 loading factor. Besides that, the anti-image analysis showed there were four items that had a value
under 0.5; thus, the four items were not included in the analysis. Then, without the four items, the analysis
was conducted again. The analysis revealed the existence of 10 identified factors. Then, items with more
than 0.4 factor loading on two or more factors or not meeting the 0.4 factor loading were not included in the
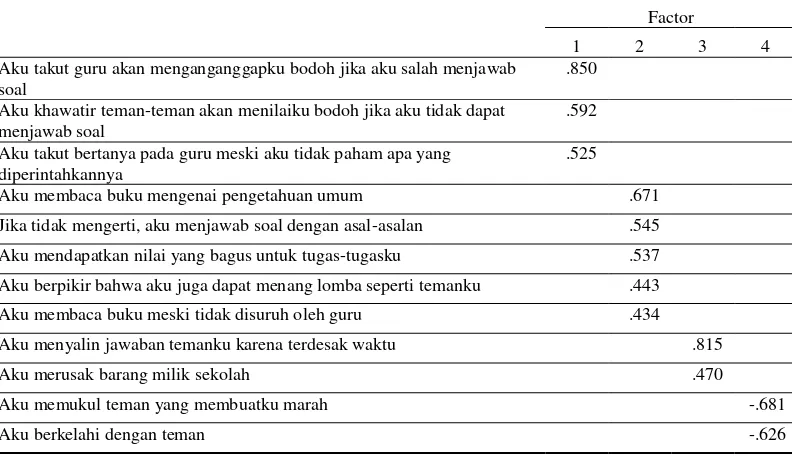
analysis. The analysis was performed once again and the last analysis results showed that there were four
Table 5. The results of Analysis of Exploratory Factor
Factor
1 2 3 4
Aku takut guru akan menganganggapku bodoh jika aku salah menjawab soal
.850
Aku khawatir teman-teman akan menilaiku bodoh jika aku tidak dapat menjawab soal
.592
Aku takut bertanya pada guru meski aku tidak paham apa yang diperintahkannya
.525
Aku membaca buku mengenai pengetahuan umum .671
Jika tidak mengerti, aku menjawab soal dengan asal-asalan .545
Aku mendapatkan nilai yang bagus untuk tugas-tugasku .537
Aku berpikir bahwa aku juga dapat menang lomba seperti temanku .443
Aku membaca buku meski tidak disuruh oleh guru .434
Aku menyalin jawaban temanku karena terdesak waktu .815
Aku merusak barang milik sekolah .470
Aku memukul teman yang membuatku marah -.681
Aku berkelahi dengan teman -.626
Based on the similarity of the collected items, factor1 showed items revealing about the components
of self-esteem. The second emerged factor was a collection of items indicating someone's effort in
developing him/herself to reach the maximum achievement. Factor3 was related to the way a person controls
him/herself not to show a behavior that is contrary to the social norms in order to meet immediate needs.
Factor4 showed the inability of controlling emotions.
DISCUSSION
The reliability coefficient in the construction of this scale was 0.88. If compared to the standard
specified by the experts before such Urbina (2004) and De Vauss (2002), which stated that a minimum
reliability coefficient of 0.8 is considered as quite significant, the level of reliability obtained in the
construction of this scale is already satisfying.
Some other well-being scales which can be said have a good reliability also had more than 0.70
reliability, such as the Psychosocial Well-Being Inventory (PSWBI) arranged by Negovan (2010), and more
than 0.80 reliability , such as the Pacific Identity and Wellbeing Scale (PIWBS) by Manuela and Sibley
(2012). The scale in this study had an internal consistency of 0.88. Therefore, it can be concluded that the
However, a high reliability value should be interpreted carefully because the reliability of the scale
will produce a different coefficient if tested on other respondents and in other situations when imposed on a
group of respondents in certain situations (Azwar, 2012b). The scale was tested on a group of respondents
with relatively similar characteristics. Therefore, the existing reliability coefficient should be interpreted
carefully and needs to be tested to a broader sample so that the reliability figures can actually be enforced.
Besides a high reliability, a scale’s items are expected to be able to distinguish between the
respondents with high measured attributes and the respondents with low measured attributes. Perceived from
the item-total correlation coefficient, the items in this scale met the satisfying psychometric property
requirement. Nevertheless, the high items correlation coefficient does not show the attributes measured by
the items and the desired attributes.
In the construction of this scale, the items generated were already written correctly and in accordance
with the behavioral indicators that have been formulated correctly too. This was supported by the high
content validity given by the panelists. Logically, the items were valid because they had been through the
correct process and based on the review of panelists and practitioners. However, even though the content
validity of the scale already met the requirements, it did not guarantee the items would be valid on the
construct test.
Construct validity test was performed to prove that the measurement result obtained by items of the
scale were highly correlated with the theoretical construct underlying in the construction of the scale (Azwar,
2012b). The confirmatory factor analysis result showed that aspects emerging on the SWB scale were not in
accordance with the previously prepared construct, i.e. consist of 10 aspects. Factor structure that emerged
from the result of confirmation with 10 factors did not show the expected factors’ structure. Several factors
had a low factor loading and some others overlap or cross over into other factors.
Generally, there were two things affected the results of this factor analysis. First, items that did not
cohere in the proper place were likely the result of the correlation between items that did not comply with the
construct. An item just might provide information about things described by the measurement results of other
items in the same scale. Aspect that was jointly described by several items was identified as a variable or
latent factor. This latent factor can be expressed indirectly through a number of operational behavioral
Behavioral indicators in the construction of this scale was limited by two indicators of each aspect
due to a consideration that the respondents were still children and it would be inappropriate if they were
given a long scale. The limited the number of indicators made the scale constructed not comprehensive
enough to reveal the desired attributes. In addition, parts of the limited behavioral indicators are likely to
overlap with behavioral indicators of the other psychological attributes (Azwar, 2012b).
The second possibility was that the level of difficulty in constructing simple and easy to understand
items by child respondents. In this scale, every aspect arranged was different, but the indicators were still
posing a double meaning when elaborated into items. As the result, there was aspects overlapping and the
items were crossing over from the original aspects. Simple sentences arranged to be easily understood by
children even negated the distinctive power of each item.
Podsakoff, MacKenzie, Lee, & Podsakoff (2003) stated there were several sources that could
potentially lead to a bias in the measurements in psychology. In a questionnaire measurement method, the
source of misinterpretation could be caused by the influence of the items characteristics. The items
characteristics are those containing a high social desirability, ambiguous items, inappropriate scale format,
and the description of the items in negative sentences. In this scale, there were ambiguous items needed to be
fixed for the purpose of further development of the scale.
CONCLUSION
From the validity of the content, the discriminant index, and the reliability coefficient, the scale in
this study had fulfilled the requirement of satisfying psychometric properties. However, structurally, this
scale still needs a lot of improvement to be able to run its measuring function correctly. The structural factors
analysis result showed that the emerging factors were inconsistent with the previous composed construct
while the result of factor exploratory produced four factors identified, namely factors containing items
related to self-esteem, self-development, normative behavior, and emotional control.
SUGGESTION
Suggestions for the next researchers who wish to continue this research are, firstly, review the
construct of the student well-being in the school and determine the appropriate construct with the objective
of the measure. Secondly, review the indicators that construct each aspect in terms of wording and the
rearranged and then redo the item writing. Thirdly, future studies should be applied to a more extensive and
varied respondents characteristics.
REFERENCES
Ampuni, S. & Andayani, B. (2007). Memahami anak dan remaja dengan kasus mogok: gejala, penyebab, struktur kepribadian, profil keluarga, dan keberhasilan penanganan. Jurnal Psikologi,34 (1), 55-75.
Azwar, S. (2012a). Penyusunan Skala Psikologi. Yogyakarta: Pustaka Pelajar.
Azwar, S. (2012b). Reliabilitas dan Validitas. Yogyakarta: Pustaka Pelajar
Ben-Arieh, A. (2006). Measuring and Monitoring the well-being of young children around the world (a Report to UNESCO). Retrieved from http://unesdoc.unesco.org/images/0014/001474/147444e.pdf
Brown, T.A. (2006). Confirmatory Factor Analysis for Applied Research. New York: The Guilford Press.
Charlesworth, L., Wood, J., & Viggiani, P. (2007). Dimensions of human behavior: the changing life course (4th Ed) In Hutchison, E. D. Middle Childhood (pp. 175-26). New Delhi: Sage Publication, Inc.
Deci, E. L. & Ryan, R. M. (2008). Hedonia, eudaimonia, and well-being: an introduction. Journal of Happiness Studies, 9, 1-11. doi: 10.1007/s10902-006-9018-1
De Vaus, D.A. (2002) Surveys in Social Research (5th edition) London: Routledge.
Eccles, J. S. (1999). The development of children ages 6 to 14. The Future of Children: When School is Out, 9(2), 30-44.
Eccles, J. S., Lord, S., & Buchanan, C. M. (1996). School transitions in early adolescence: What are we doing to our young people? In J. L. Graber, J. Brooks-Gunn, & A. C. Petersen (Eds.), Transitions through adolescence: Interpersonal domains and context (pp. 251-284). Hillsdale, NJ: Lawrence Erlbaum Associates.
Eid, M. & Larsen, R. J. (2008). The Science of Subjective Well-Being. New York: The Guilford Press.
Fattore, T., Mason, J., & Watson, E. (2007). Children’s conceptualization(s) of their well-being. Social Indicator Research, 80, 5-29. doi: 10.1007/s11205-00609019-9
Fraillon, J. (2004). Measuring Student Wellbeing in the Context of Australian Schooling: Discussion Paper Commissioned by the South Australian department of Education and Children’s services as an agent
of the Ministerial Council on Education, Employment, Training and Youth Affairs. Retrieved from
http://www.mceetya.edu.au/verve/_resources/Measuring_Student_Well-Being_in_the_Context_of_Australian_Schooling.pdf
Gadermann, A. M. (2009). The satisfaction with life scale adapted for children: Investigating the structural, external, and substantive aspects of construct validity (Master’s thesis). Retrieved from https://circle.ubc.ca/bitstream/handle/2429/16320/ubc_2010_spring_gadermann_anne.pdf?sequence =1
Gladstein, G. A. (1983). Understanding Empathy: Integrating Counseling Developmental, and Social Psychology Perspectives. Journal of Counseling Psychology, 30(4), 467-482.
Gutman, L. M. & Feinstein, L. (2008). Children’s Well-Being in Primary School: Pupil and School Effects.
London: Centre for Research on The Wider Benefits of Learning.
Huebner, E. S. & Gilman, R. (2006). Characteristics of adolescents who report very high life satisfaction.
Journal of Youth and Adolescence, 35(3), 311-319.
Keyes, C. L. M. (1998). Social well-being. Social Psychology Quarterly, 61(2), 121-140.
Lippman, L. (2005). Indicators and Indices of Child Well-being: A Brief History. Maryland: The Annie E. Casey Foundation.
Manuela, M. S. & Sibley, C. G. (2012). The pacific identity and wellbeing scale (piwbs): A culturally-appropriate self-report measure for pacific peoples in new Zealand. Social Indicator Research, 1, 1-21. doi:10.1007/s11205-012-0041-9
Marks, H. (2000). Student engagement in instructional activity: patterns in the elementary, middle and high school years. American Educational Research Journal, 37(1), 153-184.
National Institute for Health and Clinical Excellence. Social and Emotional Wellbeing in Primary Education
(2008). Quick Reference Guide. Retrieved from
http://www.nice.org.uk/newsroom/features/NICE200809AnnualReport.jsp
Opdenakker, M.C. & Van Damme, J. (2000). Effects of schools, teaching staff and classes on achievement and well-being in secondary education: Similarities and differences between school outcomes.
School Effectiveness and School Improvement, 11, 165–196.
Podsakoff, P.M., MacKenzie, S.B., & Lee, J.Y. (2003). Common method biases in behavioral research: a critical review of the literature and recommended remedies. Journal of Applied Psychology, 88 (5), 879-903. doi: 10.1037/0021-9010.88.5.879
Pollard, E. & Lee, P. (2003). Child well-being: a systematic review of the literature. Social Indicators Research, 61 (1), 59-78.
Ryan, R. M., & Deci, E. L. (2001). On happiness and human potentials: A review of research on hedonic and eudemonic well-being. Annual Review of Psychology, 52, 141-166.
Ryff, C. D. (1989). Happiness is everything, or is it? Explorations on the meaning of psychological wellbeing. Journal of Personality and Social Psychology, 57, 1069-1081.
Ryff, C. D. (1995). Psychological well-being in adult life. Journal of Personality and Social Psychology, 57, 1069-1081.
Ryff, C. D. & Keyes, C. L. M. (1995). Psychological well-being revisited. Journal of Personality and Social Psychology, 69(4), 719-727.
Ryff, C. D., & Singer, B. (1996). Psychological Well-Being: Meaning, Measurement, and Implications for Psychotherapy Research. Psychother Psychosom, 65, 14- 23.
Waterman, A. (1993). Two conception of happiness: contrast of personal expressiveness (eudaimonia) and hedonic enjoyment. Journal of Personality and Social Psychology, 64(4), 678-691.
World Health Organization. Mental health: a state of well-being (2011). Report of the WHO Departement of Mental Health. Retrived from http://www.who.int/features/factfiles/mental_health/en/
Appendix
Table 3. Items Discrimination Index of the Compiled Scale
Items Aku menyalin jawaban temanku karena terdesak waktu .300 .887
Aku merusak barang milik sekolah .282 .887
Aku memukul teman yang membuatku marah .391 .886
Aku menyapa temanku meski aku pernah marah dengannya .341 .887 Aku malas mengikuti pelajaran karena nilaiku jelek .420 .885 Aku malas berangkat ke sekolah karena ada yang menjahili .280 .887 Aku tidak mengerjakan PR karena jumlahnya banyak .363 .886
Aku mengerjakan semua PR-ku .362 .886
Aku berpikir bahwa aku juga dapat menang lomba seperti temanku .417 .885 Aku merasa tidak mampu menyaingi prestasi temanku .347 .887 Aku khawatir teman-teman akan menilaiku bodoh jika aku tidak dapat menjawab soal .310 .887 Aku takut guru akan menganganggapku bodoh jika aku salah menjawab soal .305 .887
Aku hanya belajar saat di kelas saja .468 .885
Sepulang sekolah, aku belajar lagi untuk menjawab soal yang belum terselesaikan .508 .884
Aku membaca buku mengenai pengetahuan umum .401 .886
Aku membaca buku meski tidak disuruh oleh guru .368 .886 Aku senang kalau pulang sekolah lebih awal karena tidak harus mengikuti kegiatan di
sekolah
.407 .886
Aku mengerjakan tugas piket dengan senang hati .374 .886
Aku memperhatikan penjelasan guru .516 .884
Aku ikut mengerjakan tugas kelompok .474 .885
Aku membaca kembali pelajaran saat di rumah .453 .885
Aku membaca bahan ulangan sampai mengerti .387 .886
Aku mendapatkan nilai yang bagus untuk tugas-tugasku .356 .886 Jika tidak mengerti, aku menjawab soal dengan asal-asalan .444 .885 Aku menahan kencing karena takut meminta izin guru ke toilet .303 .887
Aku menyampaikan pendapatku di kelas .371 .886
Aku takut bertanya pada guru meski aku tidak paham apa yang diperintahkannya .339 .887
Aku menolong teman yang terjatuh .496 .884
Aku membantu teman yang kesulitan .531 .884
Aku sedih ketika membaca cerita tentang bencana alam .456 .885 Aku ikut tertawa ketika temanku menceritakan hal yang lucu .291 .887 Aku senang belajar bersama teman-teman di sekolah .495 .884
Aku senang diajar oleh guru-guruku .541 .883
Aku mempercayai kata-kata guruku .305 .887
Aku merasa curiga dengan teman-temanku .287 .888
Aku mengenal siswa dari lain kelas .281 .888
Aku bermain dengan teman-teman ketika istirahat .330 .887
Aku berkelahi dengan teman .354 .886
Table 4. The factor analysis results with extraction of 10 factors
Aspects No. Items Loading factors
1 2 3 4 5 6 7 8 9 10
Able to control emotion
1 Aku menyalin jawaban temanku karena terdesak waktu -.637
2 Aku merusak barang milik sekolah -.644
3 Aku memukul teman yang membuatku marah -.520 4 Aku menyapa temanku meski aku pernah marah dengannya
Resilient in the face of problems
5 Aku malas mengikuti pelajaran karena nilaiku jelek
6 Aku malas berangkat ke sekolah karena ada yang menjahili
7 Aku tidak mengerjakan PR karena jumlahnya banyak .499
8 Aku mengerjakan semua PR-ku
Not feeling inferior
(having high
self-esteem)
9 Aku berpikir bahwa aku juga dapat menang lomba seperti temanku
.491
10 Aku merasa tidak mampu menyaingi prestasi temanku
11 Aku khawatir teman-teman akan menilaiku bodoh jika aku tidak dapat menjawab soal
.587
12 Aku takut guru akan menganganggapku bodoh jika aku salah menjawab soal
.752
Having a high
curiosity
13 Aku hanya belajar saat di kelas saja
14 Sepulang sekolah, aku belajar lagi untuk menjawab soal yang belum terselesaikan
.539
15 Aku membaca buku mengenai pengetahuan umum .422
16 Aku membaca buku meski tidak disuruh oleh guru .433
Participating in 17 Aku senang kalau pulang sekolah lebih awal karena tidak harus mengikuti kegiatan di sekolah
learning and school
activities
18 Aku mengerjakan tugas piket dengan senang hati .513
19 Aku memperhatikan penjelasan guru
20 Aku ikut mengerjakan tugas kelompok
*next page
*continuity of the previous table Persevere in the learning process
21 Aku membaca kembali pelajaran saat di rumah .669
22 Aku membaca bahan ulangan sampai mengerti .567
23 Aku mendapatkan nilai yang bagus untuk tugas-tugasku .566
24 Jika tidak mengerti, aku menjawab soal dengan asal-asalan
Able to
communicate what he/she feels and thinks
25 Aku menahan kencing karena takut meminta izin guru ke toilet
26 Aku menyampaikan pendapatku di kelas
27 Aku takut bertanya pada guru meski aku tidak paham apa yang diperintahkannya
28 Aku menolong teman yang terjatuh .498
29 Aku membantu teman yang kesulitan .627
30 Aku sedih ketika membaca cerita tentang bencana alam
31 Aku ikut tertawa ketika temanku menceritakan hal yang lucu
Demonstrating confidence and comfort in interacting with
32 Aku senang belajar bersama teman-teman di sekolah -.446
33 Aku senang diajar oleh guru-guruku -.754
friends, teachers, and community members
35 Aku merasa curiga dengan teman-temanku
Maintaining good
relationships with
friends, teachers,
and community
members
36 Aku mengenal siswa dari lain kelas
37 Aku bermain dengan teman-teman ketika istirahat .410
38 Aku berkelahi dengan teman -.607