Java Performance: The Definitive Guide by Scott Oaks
Copyright © 2014 Scott Oaks. All rights reserved.
Printed in the United States of America.
Published by O’Reilly Media, Inc., 1005 Gravenstein Highway North, Sebastopol, CA 95472.
O’Reilly books may be purchased for educational, business, or sales promotional use. Online editions are also available for most titles (http://my.safaribooksonline.com). For more information, contact our corporate/ institutional sales department: 800-998-9938 or [email protected].
Editor: Meghan Blanchette Production Editor: Kristen Brown Copyeditor: Becca Freed Proofreader: Charles Roumeliotis
Indexer: Judith McConville Cover Designer: Karen Montgomery Interior Designer: David Futato Illustrator: Rebecca Demarest
April 2014: First Edition
Revision History for the First Edition: 2014-04-09: First release
See http://oreilly.com/catalog/errata.csp?isbn=9781449358457 for release details.
Nutshell Handbook, the Nutshell Handbook logo, and the O’Reilly logo are registered trademarks of O’Reilly Media, Inc. Java Performance: The Definitive Guide, the image of saiga antelopes, and related trade dress are trademarks of O’Reilly Media, Inc.
Many of the designations used by manufacturers and sellers to distinguish their products are claimed as trademarks. Where those designations appear in this book, and O’Reilly Media, Inc. was aware of a trademark claim, the designations have been printed in caps or initial caps.
While every precaution has been taken in the preparation of this book, the publisher and author assume no responsibility for errors or omissions, or for damages resulting from the use of the information contained herein.
ISBN: 978-1-449-35845-7
Table of Contents
Preface. . . ix
1. Introduction. . . 1
A Brief Outline 2
Platforms and Conventions 2
JVM Tuning Flags 4
The Complete Performance Story 5
Write Better Algorithms 5
Write Less Code 6
Oh Go Ahead, Prematurely Optimize 7
Look Elsewhere: The Database Is Always the Bottleneck 8
Optimize for the Common Case 9
Summary 10
2. An Approach to Performance Testing. . . 11
Test a Real Application 11
Microbenchmarks 11
Macrobenchmarks 16
Mesobenchmarks 18
Common Code Examples 20
Understand Throughput, Batching, and Response Time 24
Elapsed Time (Batch) Measurements 24
Throughput Measurements 25
Response Time Tests 26
Understand Variability 29
Test Early, Test Often 33
Summary 36
3. A Java Performance Toolbox. . . 37
Operating System Tools and Analysis 37
CPU Usage 38
The CPU Run Queue 41
Disk Usage 43
Network Usage 44
Java Monitoring Tools 46
Basic VM Information 47
Thread Information 50
Class Information 51
Live GC Analysis 51
Heap Dump Postprocessing 51
Profiling Tools 51
Sampling Profilers 52
Instrumented Profilers 54
Blocking Methods and Thread Timelines 55
Native Profilers 57
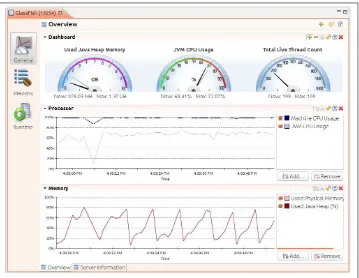
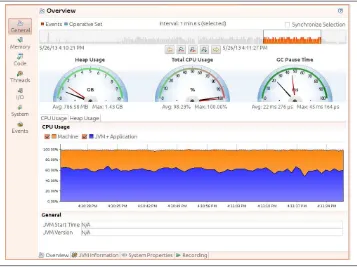
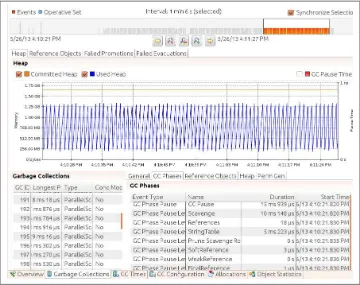
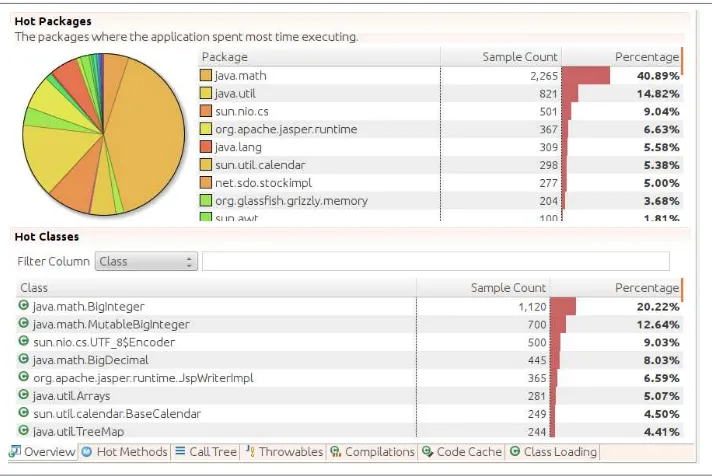
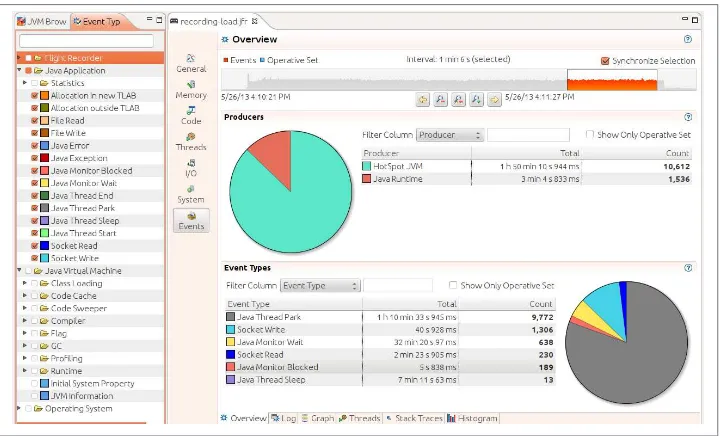
Java Mission Control 59
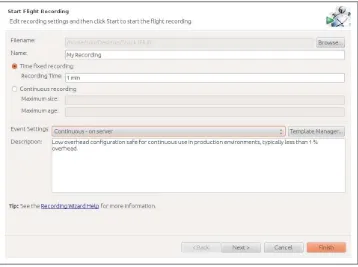
Java Flight Recorder 60
Enabling JFR 66
Selecting JFR Events 70
Summary 72
4. Working with the JIT Compiler. . . 73
Just-in-Time Compilers: An Overview 73
Hot Spot Compilation 75
Basic Tunings: Client or Server (or Both) 77
Optimizing Startup 78
Optimizing Batch Operations 80
Optimizing Long-Running Applications 81
Java and JIT Compiler Versions 82
Intermediate Tunings for the Compiler 85
Tuning the Code Cache 85
Compilation Thresholds 87
Inspecting the Compilation Process 90
Advanced Compiler Tunings 94
Compilation Threads 94
Inlining 96
Escape Analysis 97
Deoptimization 98
Not Entrant Code 98
Deoptimizing Zombie Code 101
Summary 103
5. An Introduction to Garbage Collection. . . 105
Garbage Collection Overview 105
Generational Garbage Collectors 107
GC Algorithms 109
Choosing a GC Algorithm 113
Basic GC Tuning 119
Sizing the Heap 119
Sizing the Generations 122
Sizing Permgen and Metaspace 124
Controlling Parallelism 126
Adaptive Sizing 127
GC Tools 128
Summary 131
6. Garbage Collection Algorithms. . . 133
Understanding the Throughput Collector 133
Adaptive and Static Heap Size Tuning 136
Understanding the CMS Collector 140
Tuning to Solve Concurrent Mode Failures 145
Tuning CMS for Permgen 148
Incremental CMS 149
Understanding the G1 Collector 150
Tuning G1 157
Advanced Tunings 159
Tenuring and Survivor Spaces 159
Allocating Large Objects 163
AggressiveHeap 171
Full Control Over Heap Size 173
Summary 174
7. Heap Memory Best Practices. . . 177
Heap Analysis 177
Heap Histograms 178
Heap Dumps 179
Out of Memory Errors 184
Using Less Memory 188
Reducing Object Size 188
Lazy Initialization 191
Immutable and Canonical Objects 196
String Interning 198
Object Lifecycle Management 202
Object Reuse 202
Weak, Soft, and Other References 208
Summary 221
8. Native Memory Best Practices. . . 223
Footprint 223
Measuring Footprint 224
Minimizing Footprint 225
Native NIO Buffers 226
Native Memory Tracking 227
JVM Tunings for the Operating System 230
Large Pages 230
Compressed oops 234
Summary 236
9. Threading and Synchronization Performance. . . 237
Thread Pools and ThreadPoolExecutors 237
Setting the Maximum Number of Threads 238
Setting the Minimum Number of Threads 242
Thread Pool Task Sizes 243
Sizing a ThreadPoolExecutor 244
The ForkJoinPool 246
Automatic Parallelization 252
Thread Synchronization 254
Costs of Synchronization 254
Avoiding Synchronization 259
False Sharing 262
JVM Thread Tunings 267
Tuning Thread Stack Sizes 267
Biased Locking 268
Lock Spinning 268
Thread Priorities 269
Monitoring Threads and Locks 270
Thread Visibility 270
Blocked Thread Visibility 271
Summary 275
10. Java Enterprise Edition Performance. . . 277
Basic Web Container Performance 277
HTTP Session State 280
Enterprise Java Session Beans 283
Tuning EJB Pools 283
Tuning EJB Caches 286
Local and Remote Instances 288
XML and JSON Processing 289
Data Size 290
An Overview of Parsing and Marshalling 291
Choosing a Parser 293
XML Validation 299
Document Models 302
Java Object Models 305
Object Serialization 307
Transient Fields 307
Overriding Default Serialization 307
Compressing Serialized Data 311
Keeping Track of Duplicate Objects 313
Java EE Networking APIs 316
Sizing Data Transfers 316
Summary 318
11. Database Performance Best Practices. . . 321
JDBC 322
JDBC Drivers 322
Prepared Statements and Statement Pooling 324
JDBC Connection Pools 326
Transactions 327
Result Set Processing 335
JPA 337
Transaction Handling 337
Optimizing JPA Writes 340
Optimizing JPA Reads 342
JPA Caching 346
JPA Read-Only Entities 352
Summary 353
12. Java SE API Tips. . . 355
Buffered I/O 355
Classloading 358
Random Numbers 362
Java Native Interface 364
Exceptions 366
String Performance 370
Logging 371
Java Collections API 373
Synchronized Versus Unsynchronized 373
Collection Sizing 375
Collections and Memory Efficiency 376
AggressiveOpts 378
Alternate Implementations 378
Miscellaneous Flags 379
Lambdas and Anonymous Classes 379
Lambda and Anonymous Classloading 381
Stream and Filter Performance 382
Lazy Traversal 383
Summary 385
A. Summary of Tuning Flags. . . 387
Preface
When O’Reilly first approached me about writing a book on Java performance tuning, I was unsure. Java performance, I thought—aren’t we done with that? Yes, I still work on performance of Java (and other) applications on a daily basis, but I like to think that I spend most of my time dealing with algorithmic inefficiences and external system bottlenecks rather than on anything directly related to Java tuning.
A moment’s reflection convinced me that I was (as usual) kidding myself. It is certainly true that end-to-end system performance takes up a lot of my time, and that I sometimes come across code that uses an O
(n
2)
algorithm when it could use one with O(log N)performance. Still, it turns out that every day, I think about GC performance, or the performance of the JVM compiler, or how to get the best performance from Java En‐ terprise Edition APIs.
That is not to minimize the enormous progress that has been made in the performance of Java and JVMs over the past 15-plus years. When I was a Java evangelist at Sun during the late 1990s, the only real “benchmark” available was CaffeineMark 2.0 from Pendra‐ gon software. For a variety of reasons, the design of that benchmark quickly limited its value; yet in its day, we were fond of telling everyone that Java 1.1.8 performance was eight times faster than Java 1.0 performance based on that benchmark. And that was true—Java 1.1.8 had an actual just-in-time compiler, where Java 1.0 was pretty much completely interpreted.
Then standards committees began to develop more rigorous benchmarks, and Java performance began to be centered around them. The result was a continuous improve‐ ment in all areas of the JVM—garbage collection, compilations, and within the APIs. That process continues today, of course, but one of the interesting facts about perfor‐ mance work is that it gets successively harder. Achieving an eightfold increase in per‐ formance by introducing a just-in-time compiler was a straightforward matter of en‐ gineering, and even though the compiler continues to improve, we’re not going to see an improvement like that again. Paralellizing the garbage collector was a huge perfor‐ mance improvement, but more recent changes have been more incremental.
This is a typical process for applications (and the JVM itself is just another application): in the beginning of a project, it’s easy enough to find archictural changes (or code bugs) which, when addressed, yield huge performance improvements. In a mature application, finding such performance improvements is quite rare.
That precept was behind my original concern that, to a large extent, the engineering world might be done with Java performance. A few things convinced me I was wrong. First is the number of questions I see daily about how this or that aspect of the JVM performs under certain circumstances. New engineers come to Java all the time, and JVM behavior remains complex enough in certain areas that a guide to how it operates is still beneficial. Second is that environmental changes in computing seem to have altered the performance concerns that engineers face today.
What’s changed in the past few years is that performance concerns have become bifur‐ cated. On the one hand, very large machines capabable of running JVMs with very large heaps are now commonplace. The JVM has moved to address those concerns with a new garbage collector (G1), which—as a new technology—requires a little more hand-tuning than traditional collectors. At the same time, cloud computing has renewed the importance of small, single-CPU machines: you can go to Oracle or Amazon or a host of other companies and very cheaply rent a single CPU machine to run a small appli‐ cation server. (You’re not actually getting a single-CPU machine: you’re getting a virtual OS image on a very large machine, but the virtual OS is limited to using a single CPU. From the perspective of Java, that turns out to be the same as single-CPU machine.) In those environments, correctly managing small amounts of memory turns out to be quite important.
The Java platform also continues to evolve. Each new edition of Java provides new language features and new APIs that improve the productivity of developers—if not always the performance of their applications. Best practice use of these language features can help to differentiate between an application that sizzles, and one that plods along. And the evolution of the platform brings up interesting performance questions: there is no question that using JSON to exchange information between two programs is much simpler than coming up with a highly optimized proprietary protocol. Saving time for developers is a big win—but making sure that productivity win comes with a perfor‐ mance win (or at least breaks even) is the real goal.
Who Should (and Shouldn’t) Read This Book
This book is designed for performance engineers and developers who are looking to understand how various aspects of the JVM and the Java APIs impact performance.
If you are new to performance analysis and are starting that analysis in Java, then this book can help you. Certainly my goal is to provide enough information and context that novice engineers can understand how to apply basic tuning and performance prin‐ ciples to a Java application. However, system analysis is a very broad field. There are a number of excellent resources for system analysis in general (and those pricincples of course apply to Java), and in that sense, this book will hopefully be a useful companion to those texts.
At a fundamental level, though, making Java go really fast requires a deep understanding about how the JVM (and Java APIs) actually work. There are literally hundreds of Java tuning flags, and tuning the JVM has to be more than an approach of blindly trying them and seeing what works. Instead, my goal is to provide some very detailed knowl‐ edge about what the JVM and APIs are doing, with the hope that if you understand how those things work, you’ll be able to look at the specific behavior of an application and understand why it is performing badly. Understanding that, it becomes a simple (or at least simpler) task to get rid of undesirable (badly performing) behavior.
One interesting aspect to Java performance work is that developers often have a very different background than engineers in a performance or QA group. I know developers who can remember thousands of obscure method signatures on little-used Java APIs but who have no idea what the flag -Xmn means. And I know testing engineers who can get every last ounce of performance from setting various flags for the garbage collector but who could barely write a suitable “Hello, World” program in Java.
Java performance covers both of these areas: tuning flags for the compiler and garbage collector and so on, and best-practice uses of the APIs. So I assume that you have a good understanding of how to write programs in Java. Even if your primary interest is not in the programming aspects of Java, I do spent a fair amount of time discussing programs, including the sample programs used to provide a lot of the data points in the examples.
Still, if your primary interest is in the performance of the JVM itself—meaning how to alter the behavior of the JVM without any coding—then large sections of this book should still be beneficial to you. Feel free to skip over the coding parts and focus in on the areas that interest you. And maybe along the way, you’ll pick up some insight into how Java applications can affect JVM performance and start to suggest changes to de‐ velopers so they can make your performance-testing life easier.
Conventions Used in This Book
The following typographical conventions are used in this book:
Italic
Indicates new terms, URLs, email addresses, filenames, and file extensions.
Constant width
Used for program listings, as well as within paragraphs to refer to program elements such as variable or function names, databases, data types, environment variables, statements, and keywords.
Constant width bold
Shows commands or other text that should be typed literally by the user.
Constant width italic
Shows text that should be replaced with user-supplied values or by values deter‐ mined by context.
This element signifies a tip or suggestion.
This element signifies a general note.
This element indicates a warning or caution.
Using Code Examples
Supplemental material (code examples, exercises, etc.) is available for download at
https://github.com/ScottOaks/JavaPerformanceTuning.
We appreciate, but do not require, attribution. An attribution usually includes the title, author, publisher, and ISBN. For example: “Java Performance: The Definitive Guide by Scott Oaks (O’Reilly). Copyright 2014 Scott Oaks, 978-1-449-35845-7.”
If you feel your use of code examples falls outside fair use or the permission given above, feel free to contact us at [email protected].
Safari® Books Online
Safari Books Online is an on-demand digital library that
delivers expert content in both book and video form from the world’s leading authors in technology and business.
Technology professionals, software developers, web designers, and business and crea‐ tive professionals use Safari Books Online as their primary resource for research, prob‐ lem solving, learning, and certification training.
Safari Books Online offers a range of product mixes and pricing programs for organi‐ zations, government agencies, and individuals. Subscribers have access to thousands of books, training videos, and prepublication manuscripts in one fully searchable database from publishers like O’Reilly Media, Prentice Hall Professional, Addison-Wesley Pro‐ fessional, Microsoft Press, Sams, Que, Peachpit Press, Focal Press, Cisco Press, John Wiley & Sons, Syngress, Morgan Kaufmann, IBM Redbooks, Packt, Adobe Press, FT Press, Apress, Manning, New Riders, McGraw-Hill, Jones & Bartlett, Course Technol‐ ogy, and dozens more. For more information about Safari Books Online, please visit us online.
How to Contact Us
Please address comments and questions concerning this book to the publisher:
O’Reilly Media, Inc.
1005 Gravenstein Highway North Sebastopol, CA 95472
800-998-9938 (in the United States or Canada) 707-829-0515 (international or local)
707-829-0104 (fax)
We have a web page for this book, where we list errata, examples, and any additional information. You can access this page at http://oreil.ly/java-performance-tdg.
To comment or ask technical questions about this book, send email to bookques [email protected].
For more information about our books, courses, conferences, and news, see our website at http://www.oreilly.com.
Find us on Facebook: http://facebook.com/oreilly
Follow us on Twitter: http://twitter.com/oreillymedia
Watch us on YouTube: http://www.youtube.com/oreillymedia
Acknowledgments
I would like to thank everyone who helped me as I worked on this book. In many ways, this book is an accumulation of knowledge gained over my past 15 years in the Java Performance Group at Sun Microsystems and Oracle, so the list of people who have provided positive input into this book is quite broad. To all the engineers I have worked with during that time, and particularly to those who patiently answered my random questions over the past year, thank you!
I would especially like to thank Stanley Guan, Azeem Jiva, Kim LiChong, Deep Singh, Martijn Verburg, and Edward Yue Shung Wong for their time reviewing draft copies and providing valuable feedback. I am sure that they were unable to find all my errors, though the material here is greatly improved by their input.
CHAPTER 1
Introduction
This is a book about the art and science of Java performance.
The science part of this statement isn’t surprising; discussions about performance in‐ clude lots of numbers and measurements and analytics. Most performance engineers have a background in the sciences, and applying scientific rigor is a crucial part of achieving maximum performance.
What about the art part? The notion that performance tuning is part art and part science is hardly new, but it is rarely given explicit acknowledgment in performance discussions. This is partly because the idea of “art” goes against our training.
Part of the reason is that what looks like art to some people is fundamentally based on deep knowledge and experience. It is said that magic is indistinguishable from suffi‐ ciently advanced technologies, and certainly it is true that a cell phone would look magical to a knight of the Round Table. Similarly, the work produced by a good per‐ formance engineer may look like art, but that art is really an application of deep knowl‐ edge, experience, and intuition.
This book cannot help with the experience and intuition part of that equation, but its goal is to help with the deep knowledge—with the view that applying knowledge over time will help you develop the skills needed to be a good Java performance engineer. The goal is to give you an in-depth understanding of the performance aspects of the Java platform.
This knowledge falls into two broad categories. First is the performance of the Java Virtual Machine (JVM) itself: the way in which the JVM is configured affects many aspects of the performance of a program. Developers who are experienced in other languages may find the need for tuning to be somewhat irksome, though in reality tuning the JVM is completely analogous to testing and choosing compiler flags during com‐ pilation for C++ programmers, or to setting appropriate variables in a php.ini file for PHP coders, and so on.
The second aspect is to understand how the features of the Java platform affect perfor‐ mance. Note the use of the word platform here: some features (e.g., threading and syn‐ chronization) are part of the language, and some features (e.g., XML parsing perfor‐ mance) are part of the standard Java API. Though there are important distinctions between the Java language and the Java API, in this case they will be treated similarly. This book covers both facets of the platform.
The performance of the JVM is based largely on tuning flags, while the performance of the platform is determined more by using best practices within your application code. In an environment where developers code and a performance group tests, these are often considered separate areas of expertise: only performance engineers can tune the JVM to eke out every last bit of performance, and only developers worry about whether their code is written well. That is not a useful distinction—anyone who works with Java should be equally adept at understanding how code behaves in the JVM and what kinds of tuning is likely to help its performance. Knowledge of the complete sphere is what will give your work the patina of art.
A Brief Outline
First things first, though: Chapter 2 discusses general methodologies for testing Java applications, including pitfalls of Java benchmarking. Since performance analysis re‐ quires visibility into what the application is doing, Chapter 3 provides an overview of some of the tools available to monitor Java applications.
Then it is time to dive into performance, focusing first on common tuning aspects: just-in-time compilation (Chapter 4) and garbage collection (Chapter 5 and Chapter 6). The remaining chapters focus on best practice uses of various parts of the Java platform: memory use with the Java heap (Chapter 7), native memory use (Chapter 8), thread performance (Chapter 9), Java Enterprise Edition APIs (Chapter 10), JPA and JDBC (Chapter 11), and some general Java SE API tips (Chapter 12).
Appendix A lists all the tuning flags discussed in this book, with cross-references to the chapter where they are examined.
Platforms and Conventions
update release provides an important change to JVM behavior, the update release is specified like this: 7u6 (Java 7 update 6).
Sections on Java Enterprise Edition (Java EE) are based on Java EE 7.
This book does not address the performance of previous releases of Java, though of course the current versions of Java build on those releases. Java 7 is a good starting point for a book on performance because it introduces a number of new performance features and optimizations. Chief among these is a new garbage collection (GC) algorithm called G1. (Earlier versions of Java had experimental versions of G1, but it was not considered production-ready until 7u4.) Java 7 also includes a number of new and enhanced performance-related tools to provide vastly increased visibility into the workings of a Java application. That progress in the platform is continued in Java 8, which further enhances the platform (e.g., by introducing lambda expressions). Java 8 offers a big performance advantage in its own right—the performance of Java 8 itself is much faster than Java 7 in several key areas.
There are other implementations of the Java Virtual Machine. Oracle has its JRockit JVM (which supports Java SE 6); IBM offers its own compatible Java implementation (including a Java 7 version). Many other companies license and enhance Oracle’s Java technology.
Oracle’s Commercial JVM
Java and the JVM are open source; anyone may participate in the development of Java by joining the project at http://openjdk.java.net. Even if you don’t want to actively par‐ ticipate in development, source code can be freely downloaded from that site. For the most part, everything discussed in this book is part of the open source version of Java.
Oracle also has a commercial version of Java, which is available via a support contract. That is based on the standard, open source Java platform, but it contains a few features that are not in the open source version. One feature of the commercial JVM that is important to performance work is Java Flight Recorder (see “Java Flight Recorder” on page 60).
Unless otherwise mentioned, all information in this book applies to the open source version of Java.
Although all these platforms must pass a compatibility test in order to be able to use the Java name, that compatibility does not always extend to the topics discussed in this book. This is particularly true of tuning flags. All JVM implementations have one or more garbage collectors, but the flags to tune each vendor’s GC implementation are product-specific. Thus, while the concepts of this book apply to any Java implementation, the
specific flags and recommendations apply only to Oracle’s standard (HotSpot-based) JVM.
That caveat is applicable to earlier releases of the HotSpot JVM—flags and their default values change from release to release. Rather than attempting to be comprehensive and cover a variety of now-outdated versions, the information in this book covers only Java 7 (up through 7u40) and Java 8 (the initial release only) JVMs. It is possible that later releases (e.g., a hypothetical 7u60) may slightly change some of this information. Always consult the release notes for important changes.
At an API level, different JVM implementations are much more compatible, though even then there might be subtle differences between the way a particular class is imple‐ mented in the Oracle HotSpot Java SE (or EE) platform and an alternate platform. The classes must be functionally equivalent, but the actual implementation may change. Fortunately, that is infrequent, and unlikely to drastically affect performance.
For the remainder of this book, the terms Java and JVM should be understood to refer specifically to the Oracle HotSpot implementation. Strictly speaking, saying “The JVM does not compile code upon first execution” is wrong; there are Java implementations that do compile code the first time it is executed. But that shorthand is much easier than continuing to write (and read) “The Oracle HotSpot JVM…”
JVM Tuning Flags
With a few exceptions, the JVM accepts two kinds of flags: boolean flags, and flags that require a parameter.
Boolean flags use this syntax: -XX:+FlagName enables the flag, and -XX:-FlagName
disables the flag.
Flags that require a parameter use this syntax: -XX:FlagName=something, meaning to set the value of FlagName to something. In the text, the value of the flag is usually rendered with something indicating an arbitrary value. For example, -XX:NewRatio=N
means that the NewRatio flag can be set to some arbitrary value N (where the implications of N are the focus of the discussion).
Client Class and Server Class
Java ergonomics is based on the notion that some machines are “client” class and some are “server” class. While those terms map directly to the compiler used for a particular platform (see Chapter 4), they apply to other default tunings as well. For example, the default garbage collector for a platform is determined by the class of a machine (see Chapter 5).
Client-class machines are any 32-bit JVM running on Microsoft Windows (regardless of the number of CPUs on the machine), and any 32-bit JVM running on a machine with one CPU (regardless of the operating system). All other machines (including all 64-bit JVMs) are considered server class.
The JVM that is downloaded from Oracle and OpenJDK sites is called the “product” build of the JVM. When the JVM is built from source code, there are many different builds that can be produced: debug builds, developer builds, and so on. These builds often have additional functionality in them. In particular, developer builds include an even larger set of tuning flags so that developers can experiment with the most minute operations of various algorithms used by the JVM. Those flags are generally not con‐ sidered in this book.
The Complete Performance Story
This book is focused on how to best use the JVM and Java platform APIs so that pro‐ grams run faster, but there are many outside influences that affect performance. Those influences pop up from time to time in the discussion, but because they are not specific to Java, they are not necessarily discussed in detail. The performance of the JVM and the Java platform is a small part of getting to fast performance.
Here are some of the outside influences that are at least as important as the Java tuning topics covered in this book. The Java knowledge-based approach of this book comple‐ ments these influences, but many of them are beyond the scope of what we’ll discuss.
Write Better Algorithms
There are a lot of details about Java that affect the performance of an application, and a lot of tuning flags are discussed. But there is no magical -XX:+RunReallyFast option.
Ultimately, the performance of an application is based on how well it is written. If the program loops through all elements in an array, the JVM will optimize the array bounds-checking so that the loop runs faster, and it may unroll the loop operations to provide an additional speedup. But if the purpose of the loop is to find a specific item, no
optimization in the world is going to make the array-based code as fast as a different version that uses a HashMap.
A good algorithm is the most important thing when it comes to fast performance.
Write Less Code
Some of us write programs for money, some for fun, some to give back to a community, but all of us write programs (or work on teams that write programs). It is hard to feel like a contribution to the project is being made by pruning code, and there are still those managers who evaluate developers by the amount of code they write.
I get that, but the conflict here is that a small well-written program will run faster than a large well-written program. This is true in general of all computer programs, and it applies specifically to Java programs. The more code that has to be compiled, the longer it will take until that code runs quickly. The more objects that have to be allocated and discarded, the more work the garbage collector has to do. The more objects that are allocated and retained, the longer a GC cycle will take. The more classes that have to be loaded from disk into the JVM, the longer it will take for a program to start. The more code that is executed, the less likely that it will fit in the hardware caches on the machine. And the more code that has to be executed, the longer it will take.
We Will Ultimately Lose the War
One aspect of performance that can be counterintuitive (and depressing) is that the performance of every application can be expected to decrease over time—meaning over new release cycles of the application. Often, that performance difference is not noticed, since hardware improvements make it possible to run the new programs at acceptable speeds.
Think what it would be like to run the Windows Aero interface on the same computer that used to run Windows 95. My favorite computer ever was a Mac Quadra 950, but it couldn’t run Mac OS X (and it if did, it would be so very, very slow compared to Mac OS 7.5). On a smaller level, it may seem that Firefox 23.0 is faster than Firefox 22.0, but those are essentially minor release versions. With its tabbed browsing and synced scroll‐ ing and security features, Firefox is far more powerful than Mosaic ever was, but Mosaic can load basic HTML files located on my hard disk about 50% faster than Firefox 23.0.
But the irony remains: as new features are added and new standards adopted—which is a requirement to match competing programs—programs can be expected to get larger and slower.
I think of this as the “death by 1,000 cuts” principle. Developers will argue that they are just adding a very small feature and it will take no time at all (especially if the feature isn’t used). And then other developers on the same project make the same claim, and suddenly the performance has regressed by a few percent. The cycle is repeated in the next release, and now program performance has regressed by 10%. A couple of times during the process, performance testing may hit some resource threshold—a critical point in memory use, or a code cache overflow, or something like that. In those cases, regular performance tests will catch that particular condition and the performance team can fix what appears to be a major regression. But over time, as the small regressions creep in, it will be harder and harder to fix them.
I’m not advocating here that you should never add a new feature or new code to your product; clearly there are benefits as programs are enhanced. But be aware of the trade-offs you are making, and when you can, streamline.
Oh Go Ahead, Prematurely Optimize
Donald Knuth is widely credited with coining the term “premature optimization,” which is often used by developers to claim that the performance of their code doesn’t matter, and if it does matter, we won’t know that until the code is run. The full quote, if you’ve never come across it, is “We should forget about small efficiencies, say about 97% of the time; premature optimization is the root of all evil.”
The point of this dictum is that in the end, you should write clean, straightforward code that is simple to read and understand. In this context, “optimizing” is understood to mean employing algorithmic and design changes that complicate program structure but provide better performance. Those kind of optimizations indeed are best left undone until such time as the profiling of a program shows that there is a large benefit from performing them.
What optimization does not mean in this context, however, is avoiding code constructs that are known to be bad for performance. Every line of code involves a choice, and if there is a choice between two simple, straightforward ways of programming, choose the more performant one.
At one level, this is well understood by experienced Java developers (it is an example of their art, as they have learned it over time). Consider this code:
log.log(Level.FINE, "I am here, and the value of X is " + calcX() + " and Y is " + calcY());
This code does a string concatenation that is likely unnecessary, since the message won’t be logged unless the logging level is set quite high. If the message isn’t printed, then unnecessary calls are also made to the calcX() and calcY() methods. Experienced Java developers will reflexively reject that; some IDEs (such as NetBeans) will even flag the code and suggest it be changed. (Tools aren’t perfect, though: NetBeans will flag the string concatenation, but the suggested improvement retains the unneeded method calls.)
This logging code is better written like this:
if (log.isLoggable(Level.FINE)) { log.log(Level.FINE,
"I am here, and the value of X is {} and Y is {}", new Object[]{calcX(), calcY()});
}
This avoids the string concatenation altogether (the message format isn’t necessarily more efficient, but it is cleaner), and there are no method calls or allocation of the object array unless logging has been enabled.
Writing code in this way is still clean and easy to read; it took no more effort than writing the original code. Well, OK, it required a few more keystrokes and an extra line of logic. But it isn’t the type of premature optimization that should be avoided; it’s the kind of choice that good coders learn to make. Don’t let out-of-context dogma from pioneering heroes prevent you from thinking about the code you are writing.
We’ll see other examples of this throughout this book, including in Chapter 9, which discusses the performance of a benign-looking loop construct to process a Vector of objects.
Look Elsewhere: The Database Is Always the Bottleneck
If you are developing standalone Java applications that use no external resources, the performance of that application is (mostly) all that matters. Once an external resource —a database, for example—is added, then the performance of both programs is im‐ portant. And in a distributed environment, say with a Java EE application server, a load balancer, a database, and a backend enterprise information system, the performance of the Java application server may be the least of the performance issues.
Bugs and Performance Issues Aren’t Limited to the JVM
The performance of the database is the example used in this section, but any part of the environment may be the source of a performance issue.
I once faced an issue where a customer was installing a new version of an application server, and testing showed that the requests sent to the server took longer and longer over time. Applying Occam’s Razor (see the next tip) led me to consider all aspects of the application server that might be causing the issue.
After those were ruled out, the performance issue remained, and there was no backend database on which to place the blame. The next most likely issue, therefore, was the test harness, and some profiling determined that the load generator—Apache JMeter—was the source of the regression: it was keeping every response in a list, and when a new response came in, it processed the entire list in order to calculate the 90th% response time (if that term is unfamiliar, see Chapter 2).
Performance issues can be caused by any part of the entire system where an application is deployed. Common case analysis says to consider the newest part of the system first (which is often the application in the JVM), but be prepared to look at every possible component of the environment.
On the other hand, don’t overlook that initial analysis. If the database is the bottleneck (and here’s a hint: it is), then tuning the Java application accessing the database won’t help overall performance at all. In fact, it might be counterproductive. As a general rule, when load is increased into a system that is overburdened, performance of that system gets worse. If something is changed in the Java application that makes it more efficient —which only increases the load on an already-overloaded database—overall perfor‐ mance may actually go down. The danger there is then reaching the incorrect conclusion that the particular JVM improvement shouldn’t be used.
This principle—that increasing load to a component in a system that is performing badly will make the entire system slower—isn’t confined to a database. It applies when load is added to an application server that is CPU-bound, or if more threads start accessing a lock that already has threads waiting for it, or any of a number of other scenarios. An extreme example of this that involves only the JVM is shown in Chapter 9.
Optimize for the Common Case
It is tempting—particularly given the “death by 1,000 cuts” syndrome—to treat all per‐ formance aspects as equally important. But focus should be given to the common use case scenarios.
This principle manifests itself in several ways:
• Optimize code by profiling it and focusing on the operations in the profile taking the most time. Note, however, that this does not mean looking at only the leaf methods in a profile (see Chapter 3).
• Apply Occam’s Razor to diagnosing performance problems. The simplest explan‐ ation for a performance issue is the most conceivable cause: a performance bug in new code is more likely than a configuration issue on a machine, which in turn is more likely than a bug in the JVM or operating system. Obscure bugs do exist, and as more credible causes for a performance issue are ruled out, it does become pos‐ sible that somehow the test case in question has triggered such a latent bug. But don’t jump to the unlikely case first.
• Write simple algorithms for the most common operations in an application. Take the case of a program that estimates some mathematical formula, where the user can decide if she wants an answer within a 10% margin of error, or a 1% margin. If most users will be satisfied with the 10% margin, then optimize that code path— even if it means slowing down the code that provides the 1% margin of error.
Summary
Java 7 and 8 introduce a number of new features and tools that make it even easier to get the best possible performance from a Java application. This book should help you understand how best to use all the features of the JVM in order to end up with fast-running programs.
In many cases, though, remember that the JVM is a small part of the overall performance picture. A systemic, system-wide approach to performance is required in Java environ‐ ments where the performance of databases and other backend systems is at least as important as the performance of the JVM. That level of performance analysis is not the focus of this book—it is assumed the due diligence has been performed to make sure that the Java component of the environment is the important bottleneck in the system.
CHAPTER 2
An Approach to Performance Testing
This chapter discusses four principles of getting results from performance testing; these principles form the basis of the advice given in later chapters. The science of perfor‐ mance engineering is covered by these principles.
Most of the examples given in later chapters use a common application, which is also outlined in this chapter.
Test a Real Application
The first principle is that testing should occur on the actual product in the way the product will be used. There are, roughly speaking, three categories of code that can be used for performance testing, each with its own advantages and disadvantages. The category that includes the actual application will provide the best results.
Microbenchmarks
The first of these categories is the microbenchmark. A microbenchmark is a test de‐ signed to measure a very small unit of performance: the time to call a synchronized method versus a nonsynchronized method; the overhead in creating a thread versus using a thread pool; the time to execute one arithmetic algorithm versus an alternate implementation; and so on.
Microbenchmarks may seem like a good idea, but they are very difficult to write cor‐ rectly. Consider the following code, which is an attempt to write a microbenchmark that tests the performance of different implementations of a method to compute the 50th Fibonacci number:
public void doTest() { // Main Loop double l;
long then = System.currentTimeMillis();
for (int i = 0; i < nLoops; i++) { l = fibImpl1(50);
}
long now = System.currentTimeMillis();
System.out.println("Elapsed time: " + (now - then)); }
...
private double fibImpl1(int n) {
if (n < 0) throw new IllegalArgumentException("Must be > 0"); if (n == 0) return 0d;
if (n == 1) return 1d;
double d = fibImpl1(n - 2) + fibImpl(n - 1);
if (Double.isInfinite(d)) throw new ArithmeticException("Overflow"); return d;
}
This may seem simple, but there are many problems with this code.
Microbenchmarks must use their results
The biggest problem with this code is that it never actually changes any program state. Because the result of the Fibonacci calculation is never used, the compiler is free to discard that calculation. A smart compiler (including current Java 7 and 8 compilers) will end up executing this code:
long then = System.currentTimeMillis(); long now = System.currentTimeMillis();
System.out.println("Elapsed time: " + (now - then));
As a result, the elapsed time will be only a few milliseconds, regardless of the imple‐ mentation of the Fibonacci method, or the number of times the loop is supposed to be executed. Details of how the loop is eliminated are given in Chapter 4.
There is a way around that particular issue: ensure that each result is read, not simply written. In practice, changing the definition of l from a local variable to an instance variable (declared with the volatile keyword) will allow the performance of the meth‐ od to be measured. (The reason the l instance variable must be declared as volatile can be found in Chapter 9.)
Threaded Microbenchmarks
The need to use a volatile variable in this example applies even when the mi‐ crobenchmark is single-threaded.
Consider the case of two threads calling a synchronized method in a microbenchmark. Because the benchmark code is small, most of it will execute within that synchronized method. Even if only 50% of the total microbenchmark is within the synchronized method, the odds that as few as two threads will attempt to execute the synchronized method at the same time is quite high. The benchmark will run quite slowly as a result, and as additional threads are added, the performance issues caused by the increased contention will get even worse. The net is that the test ends up measuring how the JVM handles contention rather than the goal of the microbenchmark.
Microbenchmarks must not include extraneous operations
Even then, potential pitfalls exist. This code performs only one operation: calculating the 50th Fibonacci number. A very smart compiler can figure that out and execute the loop only once—or at least discard some of the iterations of the loop since those oper‐ ations are redundant.
Additionally, the performance of fibImpl(1000) is likely to be very different than the performance of fibImpl(1); if the goal is to compare the performance of different im‐ plementations, then a range of input values must be considered.
To overcome that, the parameter passed to the fibImpl1() method must vary. The solution is to use a random value, but that must also be done carefully.
The easy way to code the use of the random number generator is to process the loop as follows:
for (int i = 0; i < nLoops; i++) { l = fibImpl1(random.nextInteger()); }
Now the time to calculate the random numbers is included in the time to execute the loop, and so the test now measures the time to calculate a Fibonacci sequence nLoops times, plus the time to generate nLoops random integers. That likely isn’t the goal.
In a microbenchmark, the input values must be precalculated, for example:
int[] input = new int[nLoops]; for (int i = 0; i < nLoops; i++) { input[i] = random.nextInt(); }
long then = System.currentTimeMillis(); for (int i = 0; i < nLoops; i++) { try {
l = fibImpl1(input[i]);
} catch (IllegalArgumentException iae) { }
}
long now = System.currentTimeMillis();
Microbenchmarks must measure the correct input
The third pitfall here is the input range of the test: selecting arbitrary random values isn’t necessarily representative of how the code will be used. In this case, an exception will be immediately thrown on half of the calls to the method under test (anything with a negative value). An exception will also be thrown anytime the input parameter is greater than 1476, since that is the largest Fibonacci number that can be represented in a double.
What happens in an implementation where the Fibonacci calculation is significantly faster, but where the exception condition is not detected until the end of the calculation? Consider this alternate implementation:
public double fibImplSlow(int n) {
if (n < 0) throw new IllegalArgumentException("Must be > 0"); if (n > 1476) throw new ArithmeticException("Must be < 1476"); return verySlowImpl(n);
}
It’s hard to imagine an implementation slower than the original recursive implementa‐ tion, but assume one was devised and used in this code. Comparing this implementation to the original implementation over a very wide range of input values will show this new implementation is much faster than the original one—simply because of the range checks at the beginning of the method.
If, in the real world, users are only ever going to pass values less than 100 to the method, then that comparison will give us the wrong answer. In the common case, the fibImpl() method will be faster, and as Chapter 1 explained, we should optimize for the common case. (This is obviously a contrived example, and simply adding a bounds test to the original implementation makes it a better implementation anyway. In the general case, that may not be possible.)
What About a Warm-Up Period?
One of the performance characteristics of Java is that code performs better the more it is executed, a topic that is covered in Chapter 4. For that reason, microbenchmarks must include a warm-up period, which gives the compiler a chance to produce optimal code.
The advantages and disadvantages of a warm-up period are discussed in depth later in this chapter. For microbenchmarks, a warm-up period is required; otherwise, the mi‐ crobenchmark is measuring the performance of compilation rather than the code it is attempting to measure.
package net.sdo;
Even this microbenchmark measures some things that are not germane to the Fibonacci implementation: there is a certain amount of loop and method overhead in setting up the calls to the fibImpl1() method, and the need to write each result to a volatile variable is additional overhead.
Beware, too, of additional compilation effects. The compiler uses profile feedback of code to determine the best optimizations to employ when compiling a method. The
profile feedback is based on which methods are frequently called, the stack depth when they are called, the actual type (including subclasses) of their arguments, and so on—it is dependent on the environment in which the code actually runs. The compiler will frequently optimize code differently in a microbenchmark than it optimizes that same code when used in an application. If the same class measures a second implementation of the Fibonacci method, then all sorts of compilation effects can occur, particularly if the implementation occurs in different classes.
Finally, there is the issue of what the microbenchmark actually means. The overall time difference in a benchmark such as the one discussed here may be measured in seconds for a large number of loops, but the per-iteration difference is often measured in nano‐ seconds. Yes, nanoseconds add up, and “death by 1,000 cuts” is a frequent performance issue. But particularly in regression testing, consider whether tracking something at the nanosecond level actually makes sense. It may be important to save a few nanoseconds on each access to a collection that will be accessed millions of times (for example, see Chapter 12). For an operation that occurs less frequently—for example, maybe once per request for a servlet—fixing a nanosecond regression found by a microbenchmark will take away time that could be more profitably spent on optimizing other operations.
Writing a microbenchmark is hard. There are very limited times when it can be useful. Be aware of the pitfalls involved, and make the determination if the work involved in getting a reasonable microbenchmark is worthwhile for the benefit—or if it would be better to concentrate on more macro-level tests.
Macrobenchmarks
The best thing to use to measure performance of an application is the application itself, in conjunction with any external resources it uses. If the application normally checks the credentials of a user by making LDAP calls, it should be tested in that mode. Stubbing out the LDAP calls may make sense for module-level testing, but the application must be tested in its full configuration.
As applications grow, this maxim becomes both more important to fulfill and more difficult to achieve. Complex systems are more than the sum of their parts; they will behave quite differently when those parts are assembled. Mocking out database calls, for example, may mean that you no longer have to worry about the database perfor‐ mance—and hey, you’re a Java person; why should you have to deal with someone else’s performance problem? But database connections consume lots of heap space for their buffers; networks become saturated when more data is sent over them; code is optimized differently when it calls a simpler set of methods (as opposed to the complex code in a JDBC driver); CPUs pipeline and cache shorter code paths more efficiently than longer code paths; and so on.
the real world, deadlines loom, and optimizing only one part of a complex environment may not yield immediate benefits.
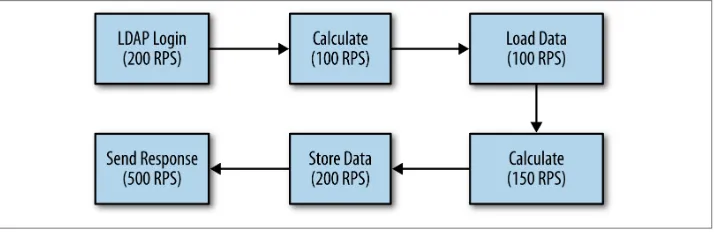
Consider the data flow shown in Figure 2-1. Data comes in from a user, some proprietary business calculation is made, some data based on that is loaded from the database, more proprietary calculations are made, changed data is stored back to the database, and an answer is sent back to the user. The number in each box is the number of requests per second (e.g., 200 RPS) that the module can process when tested in isolation.
Figure 2-1. Typical program flow
From a business perspective, the proprietary calculations are the most important thing; they are the reason the program exists, and the reason we are paid. Yet making them 100% faster will yield absolutely no benefit in this example. Any application (including a single, standalone JVM) can be modeled as a series of steps like this, where data flows out of a box (module, subsystem, etc.) at a rate determined by the efficiency of that box. (In this model, that time includes the code in that subsystem and also includes network transfer times, disk transfer times, and so on. In a module model, the time includes only the code for that module.) Data flows into a subsystem at a rate determined by the output rate of the previous box.
Assume that an algorithmic improvement is made to the business calculation so that it can process 200 RPS; the load injected into the system is correspondingly increased. The LDAP system can handle the increased load: so far, so good, and 200 RPS will flow into the calculation module, which will output 200 RPS.
But the database can still process only 100 RPS. Even though 200 RPS flow into the database, only 100 RPS flow out of it and into the other modules. The total throughput of the system is still only 100 RPS, even though the efficiency of the business logic has doubled. Further attempts to improve the business logic will prove futile until time is spent improving the other aspects of the environment.
Full System Testing with Multiple JVMs
One particularly important case of testing a full application occurs when multiple ap‐ plications are run at the same time on the same hardware. Many aspects of the JVM are tuned by default to assume that all machine resources are available to them, and if those JVMs are tested in isolation, they will behave well. If they are tested when other appli‐ cations are present (including, but not limited to, other JVMs), their performance will be quite different.
Examples of this are given in later chapters, but here is one quick preview: when exe‐ cuting a GC cycle, one JVM will (in its default configuration) drive the CPU usage on a machine to 100% of all processors. If CPU is measured as an average during the pro‐ gram’s execution, the usage may average out to 40%—but that really means that the CPU is 30% busy at some times and 100% busy at other times. When the JVM is run in isolation, that may be fine, but if the JVM is running concurrently with other applica‐ tions, it will not be able to get 100% of the machine’s CPU during GC. Its performance will be measurably different than when it was run by itself.
This is another reason why microbenchmarks and module-level benchmarks cannot necessarily give you the full picture of an application’s performance.
It’s not the case that the time spent optimizing the calculations in this example is entirely wasted: once effort is put into the bottlenecks elsewhere in the system, the performance benefit will finally be apparent. Rather, it is a matter of priorities: without testing the entire application, it is impossible to tell where spending time on performance work will pay off.
Mesobenchmarks
I work with the performance of both Java SE and EE, and each of those groups has a set of tests they characterize as microbenchmarks. To a Java SE engineer, that term connotes an example even smaller than that in the first section: the measurement of something quite small. Java EE engineers tend to use that term to apply to something else: bench‐ marks that measure one aspect of performance, but that still execute a lot of code.
This kind of test is not a macrobenchmark either: there is no security (e.g., the user does not log in to the application), no session management, and no use of a host of other Java EE features. Because it is only a subset of an actual application, it falls somewhere in the middle—it is a mesobenchmark. Mesobenchmarks are not limited to the Java EE arena: it is a term I use for benchmarks that do some real work, but are not full-fledged applications.
Mesobenchmarks have fewer pitfalls than microbenchmarks and are easier to work with than macrobenchmarks. It is unlikely that mesobenchmarks will contain a large amount of dead code that can be optimized away by the compiler (unless that dead code actually exists in the application, in which case optimizing it away is a good thing). Mesobench‐ marks are more easily threaded: they are still more likely to encounter more synchro‐ nization bottlenecks than the code will encounter when run in a full application, but those bottlenecks are something the real application will eventually encounter on larger hardware systems under larger load.
Still, mesobenchmarks are not perfect. A developer who uses a benchmark like this to compare the performance of two application servers may be easily led astray. Consider the hypothetical response times of two application servers shown in Table 2-1.
Table 2-1. Hypothetical response times for two application servers
Test App server 1 App server 2
Simple JSP 19 ms 50 ms JSP with session 75 ms 50 ms
The developer who uses only a simple JSP to compare the performance of the two servers might not realize that server 2 is automatically creating a session for each request. She may then conclude that server 1 will give her the fastest performance. Yet if her appli‐ cation always creates a session (which is typical), she will have made the incorrect choice, since it takes server 1 much longer to create a session. (Whether the performance of subsequent calls differs is yet another matter to consider, but it is impossible to predict from this data which server will do better once the session is created.)
Even so, mesobenchmarks offer a reasonable alternative to testing a full-scale applica‐ tion; their performance characteristics are much more closely aligned to an actual ap‐ plication than are the performance characteristics of microbenchmarks. And there is of course a continuum here. A later section in this chapter presents the outline of a common application used for many of the examples in subsequent chapters. That ap‐ plication has an EE mode, but that mode doesn’t use session replication (high availa‐ bility) or the EE platform-based security, and though it can access an enterprise resource (i.e., a database), in most examples it just makes up random data. In SE mode, it mimics some actual (but quick) calculations: there is, for example, no GUI or user interaction occurring.
Mesobenchmarks are also good for automated testing, particularly at the module level.
Quick Summary
1. Good microbenchmarks are hard to write and offer limited val‐ ue. If you must use them, do so for a quick overview of perfor‐ mance, but don’t rely on them.
2. Testing an entire application is the only way to know how code will actually run.
3. Isolating performance at a modular or operational level—a mes‐ obenchmark—offers a reasonable compromise but is no substi‐ tute for testing the full application.
Common Code Examples
Many of the examples throughout the book are based on a sample application that calculates the “historical” high and low price of a stock over a range of dates, as well as the standard deviation during that time. Historical is in quotes here because in the application, all the data is fictional; the prices and the stock symbols are randomly generated.
The full source code for all examples in this book are on my GitHub page, but this section covers basic points about the code. The basic object within the application is a StockPrice object that represents the price range of a stock on a given day:
public interface StockPrice { String getSymbol(); DategetDate();
BigDecimal getClosingPrice(); BigDecimal getHigh();
BigDecimal getLow();
BigDecimal getOpeningPrice(); boolean isYearHigh();
boolean isYearLow();
Collection<? extends StockOptionPrice> getOptions(); }
The sample applications typically deal with a collection of these prices, representing the history of the stock over a period of time (e.g., 1 year or 25 years, depending on the example):
public interface StockPriceHistory { StockPrice getPrice(Date d);
Collection<StockPrice> getPrices(Date startDate, Date endDate); Map<Date, StockPrice> getAllEntries();
Map<BigDecimal,ArrayList<Date>> getHistogram(); BigDecimal getAveragePrice();
BigDecimal getHighPrice();
The basic implementation of this class loads a set of prices from the database:
public class StockPriceHistoryImpl implements StockPriceHistory { ...
public StockPriceHistoryImpl(String s, Date startDate, DateendDate, EntityManager em) {
The architecture of the samples is designed to be loaded from a database, and that functionality will be used in the examples in Chapter 11. However, to facilitate running the examples, most of the time they will use a mock entity manager that generates random data for the series. In essence, most examples are module-level mesobenchmarks that are suitable for illustrating the performance issues at hand—but we would only have an idea of the actual performance of the application when the full application is run (as in Chapter 11).
One caveat is that a number of the examples are therefore dependent on the performance of the random number generator in use. Unlike the microbenchmark example, this is by design, as it allows the illustration of several performance issues in Java. (For that matter, the goal of the examples is to measure the performance of some arbitrary thing, and the performance of the random number generator fits that goal. That is quite dif‐ ferent than a microbenchmark, where including the time for generating random num‐ bers would affect the overall calculation.)
The examples are also heavily dependent on the performance of the BigDecimal class, which is used to store all the data points. This is a standard choice for storing currency
data; if the currency data is stored as primitive double objects, then rounding of half-pennies and smaller amounts becomes quite problematic. From the perspective of writ‐ ing examples, that choice is also useful as it allows some “business logic” or lengthy calculation to occur—particularly in calculating the standard deviation of a series of prices. The standard deviation relies on knowing the square root of a BigDecimal number. The standard Java API doesn’t supply such a routine, but the examples use this method:
public static BigDecimal sqrtB(BigDecimal bd) { BigDecimal initial = bd;
BigDecimal diff; do {
BigDecimal sDivX = bd.divide(initial, 8, RoundingMode.FLOOR); BigDecimal sum = sDivX.add(initial);
BigDecimal div = sum.divide(TWO, 8, RoundingMode.FLOOR); diff = div.subtract(initial).abs();
diff.setScale(8, RoundingMode.FLOOR); initial = div;
} while (diff.compareTo(error) > 0); return initial;
}
This is an implementation of the Babylonian method for estimating the square root of a number. It isn’t the most efficient implementation; in particular, the initial guess could be much better, which would save some iterations. That is deliberate since it allows the calculation to take some time (emulating business logic), though it does illustrate the basic point made in Chapter 1: often the better way to make Java code faster is to write a better algorithm, independent of any Java tuning or Java coding practices that are employed.
The standard deviation, average price, and histogram of an implementation of the StockPriceHistory interface are all derived values. In different examples, these values will be calculated eagerly (when the data is loaded from the entity manager) or lazily (when the method to retrieve the data is called). Similarly, the StockPrice interface references a StockOptionPrice interface, which is the price of certain options for the given stock on the given day. Those option values can be retrieved from the entity manager either eagerly or lazily. In both cases, the definition of these interfaces allows these different approaches to be compared in different situations.
protected void processRequest(HttpServletRequest request, HttpServletResponse response)
throws ServletException, IOException { try {
String symbol = request.getParameter("symbol"); if (symbol == null) {
symbol = StockPriceUtils.getRandomSymbol(); }
... similar processing for date and other params... StockPriceHistory sph;
DateFormat df = localDf.get();
sph = stockSessionBean.getHistory(symbol, df.parse(startDate), df.parse(endDate), doMock, impl);
String saveSession = request.getParameter("save"); if (saveSession != null) {
.... Store the data in the user's session .... .... Optionally store the data in a global cache for .... use by other requests
}
if (request.getParameter("long") == null) { // Send back a page with about 4K of data request.getRequestDispatcher("history.jsp"). forward(request, response);
} else {
// Send back a page with about 100K of data request.getRequestDispatcher("longhistory.jsp"). forward(request, response);
} }
This class can inject different implementations of the history bean (for eager or lazy initialization, among other things); it will optionally cache the data retrieved from the backend database (or mock entity manager). Those are the common options when dealing with the performance of an enterprise application (in particular, caching data in the middle tier is sometimes considered to be the big performance advantage of an application server). Examples throughout the book will examine those trade-offs as well.
System Under Test
Even though this book is primarily focused on software, benchmarks are just as much a measure of the hardware that they are run on.
For the most part, the examples in this book were run on my desktop system, which has an AMD Athlon X4 640 CPU with four cores (four logical CPUs) and 8 GB of physical memory, running Ubuntu Linux 12.04 LTS.