IOSR Journal of Mechanical and Civil Engineering (IOSRJMCE) ISSN : 2278-1684 Volume 1, Issue 6 (July-August 2012), PP 24-27 www.iosrjournals.org
www.iosrjournals.org 24 | Page
The Impact of Climate Change on The Beginning of Wet Season
Rr. Rintis Hadiani
1, Susilowati
2, A.P. Saido
3, Setiono
41,2,3,4
(Civil Engineering, University of Sebelas Maret, Surakarta, Indonesia)
Abstract: The Impact of Climate Change on the Start of Wet Season Climate Change is the change in the start of the wet and dry season. The start of the wet season is to be marked with a cumulative of 2 month rainfall. It will be different in each catchment area. This number is often used as a benchmark of planting time. That is why the beginning of the wet season known as the beginning of planting time. If planting start can be predicted, then it may be some adaptation on cropping patterns.
The aim of research is to find the climate change based on characteristic of historical data, and then predict the start of wet and dry season on the next time series period.The method is the model predictionof Artificial Neural Network Back Propagation. The results showed that the initial season was shifted 2 weeks until 6 weeks. This study concluded that climate change causes changes to the monsoon in the next 6 years. The impact of climate Change in the start of the wet season is the start of planting time. The reliability model is 80%.
Keyword: Climate Change, wet season.
I. Introduction
In the short term, the aim is to predict the wet season and planting season to determine the discharge is available during the planting season. Climatic conditions can greatly affect on planting conditions ([5]).
The science has been developing rapidly within the last decade, especially the Hydrological Sciences. If hydrological science is followed by the use of technology, there will be very meaningful or itself and the development of technology as well. The hydrological science can be used and applied easily in daily life ([1]; [7]).
In this research, it is called the start of the wet season when rainfall occurs 2 consecutive months with certain cumulative. The value of cumulative data on each watershed is different ([3]). The Climate change effect on the rainfall and either with the discharge in the watershed ([2]). This will affect the early occurrence of wet season ([3]).
II. Research Method
The method used in this research was literature review and building model based on artificial neural network. The model was verified towards a watershed area with similar characteristic (sub watershed of the Bengawan Solo River), and the model to be applied to other sub watersheds (in The Bengawan Solo watershed). The data are used in the model must be consistent. Consistency test is made by double mass curve. If the graphic is linear line, then the data time series can be said consistently. Historical data must according to the model. To determine the input data must be known in advance of data characters. The character data are determined by autocorrelation test ([3]). Analysis of lag the time series data will determine to the pattern of data inputs to the neural network ([4]).
The drought is analyzed based on calculating the water balance, by calculating the deficit condition in the watershed ([1]). Analysis of the threshold is determined based on the probability ([8]). The probability is according to the distribution function of historical rainfall data. Analysis of distribution function performed with Minitab to find normal distribution or gamma distribution ([4]). The Selected distribution is used to find the probability of rainfall 50% or P50 (median) and an average rainfall (Paverage) ([8]).
The outliers of data are determined by statistical analysis. If there is, then this data will disrupt the pattern formed by the model ([6]). If the data has been qualified, then it will build a neural network model ([7]; [5]).
The Impact of Climate Change on The Beginning of Wet Season
www.iosrjournals.org 25 | Page III. ResultAnd Discussion
The requirement of the model is consistency. Based on that requirement, a statistical test was conducted and showed that the data was consistent, so that the data was valid to be processed in the artificial neural network model. The data had 24 lags which meant the period 1 of January 2007 was influenced by the period 1 of January 2006, etc. As shown in Fig. 1.
Fig. 1. Autocorrelation of rainfall data based on a 1991-2008 (with 5% significance limits for author relations) Furthermore, it was necessary to determine the distribution, from Fig. 2a and 2b, the AD value then to be obtained. The smallest value indicated the right distribution was gamma.
400
Fig. 2a. AD value of normal distribution of the historical data (95% CI)
1000
Fig. 2b. AD value of gamma distribution (95% CI)
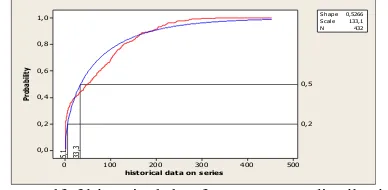
Data in gamma distribution is shown in Fig. 3. The red line is a cdf function of rainfall data, and the blue one if gamma distribution functions. The historical data has a valueof median 33.3 means that a normal height of rainfall is 33.3 mm.
500
Fig. 3.Cdfof historical datafrom Gamma distribution
The Impact of Climate Change on The Beginning of Wet Season
www.iosrjournals.org 26 | Page
output asli train
input 350
300 250 200 150 100 50 0
D
at
a
Fig. 4.Boxplot of 3 groups of historical data comprising input, training and output data.
The result of thesimulation showed that simulation data have a similar characteristicof input data, shown in Fig. 5.
140 126 112 98 84 70 56 42 28 14 1 350 300 250 200 150 100 50 0
Index
D
at
a
33,3 5,1
real output output sim Variable
Fig. 5. Data obtained from the model (real data and simulation data)
1600 1400 1200 1000 800 600 400 200 0 1,0 0,8 0,6 0,4 0,2 0,0
kum 2 output real_1
P
ro
b
a
b
ili
ty
0,2
19
0,5
11
8
Shape 0,5373 Scale 453,7
N 141
Fig. 6. Cumulative cdf of historical rainfall 2 monthly data (by Gamma distribution)
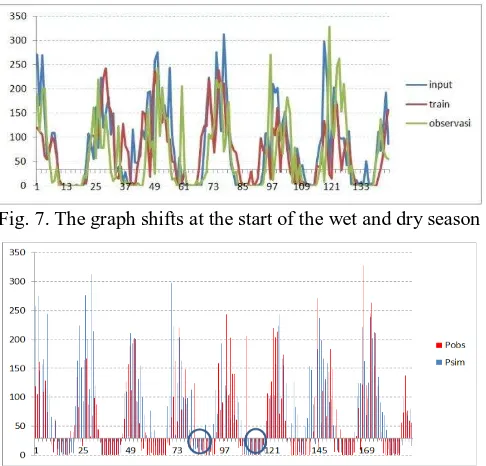
Based on the above analysis, it can be seen that a cumulative probability of 2 monthly of P50 is 118, it means that wet season will start if rainfall cumulative reach 118mm ~ 100mm. The result of analysis of historical data shows a shift in start of season as is seen in Fig. 7 and Fig. 8.
Fig. 7. The graph shifts at the start of the wet and dry season
The Impact of Climate Change on The Beginning of Wet Season
www.iosrjournals.org 27 | Page „Pobs‟ is the observation data of rainfall. „Psim‟ is the simulation data of rainfall. The circle shows that the data was not in the same time. It‟s indicated that the time of that condition were moved (wet condition).
It means that the historical data indicate the start of season shift from 2 to 4 points or one to two months. The result of prediction shows that the year 2011-2013 will be in dry. The result of the test shows thatthe model is still valid until 80%.
IV. Conclusion
The wet season will start when cumulative of 2 monthly rainfall reach 118mm~100mm, bothwet and dry season in historical data shift 1-2 month backward.The result of prediction based on rainfall data show that there does not exist rainfall (little rainfall along 2011-2012)
V. Acknowledgements
Thank you to “Direktorat Jenderal Pendidikan Tinggi, Indonesia” for funding this research.
References
[1]. Asdak, C., HidrologidanPengelolaan Daerah Aliran Sungai. (Yogyakarta, Gadjahmada Press.,2004).
[2]. Evans, Jason P.,Modelling climate-surface hydrology interactions in data sparse areas. Australian National University (Australia,
2001), 338 pp.
[3]. Hadiani,,R.,AnalisisKea ndalanMetodeAutoregresidalamMenentukanMusimTanam.Thesis. Bandung Institute of Technology, 1994
[4]. “AnalisisKekeringanberdasarkan Data Hidrologi.” Doctora l diss. Bandung Institute of Technology, 2009
[5]. Kartasapoetra, Ance Ginarsih Ir, Klimatologi : Pengaruh Iklim Terhadap Tanah dan Tanaman. Bandung, 2004, Bumi Aksara.
[6]. RedaTaha,.Artificial Neural Network (ANNs) in Structural Engineering.http://www.reda_taha.com/research/ANN.htm,, 2002
[7]. Mays, LW.,Water Resources Handbook. (AmerikaSerikat, McGraw-Hill. 1996)
[8]. Tallaksen, LM., Van Lannen, HAJ.,. Hydrological Drought. Process and Estimation Methods for Streamflow and Groundwater.
Elsevier. UK., 2006
[9]. Turban,E.,Aronso,E., Liang, TP.,. Decision Support Systems and Intelligent Systems (SistemPendukungKeputusanDanSistemCerdas).