2015
Analysing Self-Reported Risky Behaviours of Motorcyclists in Bali using
Structural Equation Modelling
Dewa Made Priyantha WEDAGAMA
Department of Civil Engineering, the University of Udayana, Bali, 80361 Indonesia E-mail: [email protected]
Abstract: This study investigates cause and effect relationships among risk perception,
positive affect and risky behaviours of motorcyclists in Denpasar, Bali using Structural Equation Modelling. Questionnaires were distributed to collect age, gender, self-reported risky riding behaviour, perceived risk and positive affect of motorcyclists. This study found that positive affect influences more than risk perception on risky riding behaviours. Accordingly, this shows that motorcyclists on the road are relied more on intuitive than rational processes. Motorcyclists have also been found to consistently perceive and behave on such a risky behaviour that may distract them on the road, for instance using a mobile phone while riding. In addition, riding fast on curves is a behaviour factor which strongly indicates both rational and intuitive processes of motorcyclists’ decision making while on the road. Further studies should be more focused on the influence of positive affect of motorcyclists’ ages and gender on risky riding behaviours.
Keywords: Positive Affect, Risk Perception, Risky Behaviour, Motorcyclist.
1. INTRODUCTION
Human factors have long been recognised to significantly influence road accidents (Matthews and Moran, 1986; Sabey and Taylor, 1980). Previous studies found that road user behaviours contributed to 95% of road accidents (Sabey and Taylor, 1980; Ulleberg and Rundmo, 2003 in Hongsranagon, et.al, 2011). In fact, these studies were conducted in developed countries. Many accident studies conducted in developing countries however, indicated the road user behaviours significantly influencing road accidents (Indriastuti and Sulistio, 2010; Ramli, et.al, 2014). In addition, in a country where motorcycles are dominant, motorcyclists and their behaviours become highly significant to influence road accidents and fatalities. For instance, motorcyclists contributed more than 50% and 80% to road fatalities in Malaysia (Ambak, et.al, 2011) and in Thailand (Swaddiwudhipong, et. al, 1994 in Hongsranagon, et.al, 2011) respectively. Meanwhile, there were 12,133 road accidents consisting 2,948 fatal and 5,887 serious casualties during the period 2009-2013 in Bali. Of those accidents and casualties, more than 70% involved motorcyclists (Bali Regional Police, 2014).
2016
accidents and casualties in Bali. An understanding of traffic risk behaviours and perceptions therefore, is useful to predict road users' actions on the road (Hongsranagon, et.al, 2011).
There have been a few studies however, in relation to road user behaviours conducted in Indonesia. A study by Joewono, et.al (2015) argued that understanding factors which cause violation of traffic rules is essential to promote road safety in urban roads. The study conducted in three cities in Indonesia namely Bandung, Yogyakarta and Surabaya. Structural equation modeling was employed to investigate factors which contribute to traffic violations by motorcyclists and their causal relationships. The study found that the shortage of engineering and maintenance conditions of the road infrastructure significantly contributed to disobedience to traffic rules by motorcyclists in Indonesia.
Meanwhile, motorists theoretically considered dual processes of decision making while driving or riding on the road. These processes involve a rational and analytic process in one hand and experimental and intuitive process on the other hand. For instance, risk perception and positive affect or the psychological affective preferences (i.e., what people like or dislike) represent rational and intuitive processes respectively. These models have not been used widely in road safety modelling (Rhodes and Pivik, 2011). A previous study conducted by Budiartha R.M (2014) however, has recently investigated factors influencing car drivers and
motorcyclists’ risky behaviours in Bali using such models. The risky behaviour models were
measured using two variables consisting risk perception and positive affect following previous studies by Jonah (1986) and Rhodes and Pivik (2011). In analysing the relationship among the three variables, Budiartha R.M (2014) used direct effect and mediation analyses and regression models.
These previous studies indicated that changes are required for road user behaviour to reduce road accidents. Certainly, human factors including motivations, risk perception or culture should be carefully considered. As a matter of fact, technological developments of motor vehicles and infrastructures, including road signs and pavement markings, have almost reached a satisfactory standard in Bali. A more full comprehension on road user behaviour therefore, should offer a better improvement in road safety.
This study aims to investigate the influence of risk perception and positive affect on risky behaviours of motorcyclists in Denpasar, Bali. This study involves a survey of motorcyclists to collect various data such as personal characteristics, self-reported risky riding behaviours and decision making data consisting positive affect and risk perception. The developed model for this study however, is different to those of the relevant past studies (Jonah, 1986; Rhodes and Pivik, 2011; Budiartha, R.M, 2014). This study focuses on cause and effect relationships among risk perception, positive affect and risky behaviour of motorcyclists. The contributing factors are identified using Factor Analysis (FA) and subsequently the assessment and prediction models are developed using Structural Equation Modelling (SEM).
2. LITERATURE REVIEW
2.1. Risky Behaviour, Risk Perception and Positive Affect
2017
Meanwhile, risky driving/riding behaviour is defined as an unbearable activity in public with possible negative results if negligence increases including speeding, impaired driving and violation involvement. According to Rhodes and Pivik, (2011), motorists on the road consider dual process of decision making consisting rational and intuitive processes. These rational and intuitive processes can be represented with risk perceptions and positive affect respectively. In theory, accident risk perception is described as overall perceived risks of an accident involvement while driving/riding and specific driver behaviours or driving situations. Thus, risk perception may refer to the perceived likelihood of an event such as an accident while driving or the chance that the incident occurred in negative situations, for instance a fatal accident. Meanwhile, positive affect is defined as a person who accounted for loving of risky driving/riding behaviour such as the enjoyment of speeding (Jonah, 1986; Rhodes and Pivik, 2011).
The purpose of this study therefore, is to examine on how positive affect and risk
perception contribute to motorcyclists’ risky behaviours. In so doing, hypothesised models are
initially required to test the relationship among the measures as follows:
H1 : risk perception is the awareness of motorcyclists on these 12 behaviour measures. H2 : positive affect is the enjoyment of motorcyclists on these 12 behaviour measures. H3 : risk perception (RP) and positive affect (PA) is expected to influence risky
behaviours (RB) of motorcyclists.
H4 : risky behaviour is the occurrence of motorcyclists involved in such 12 behaviour measures.
In this study, risky behaviour, positive affect and perceived risk of the motorcyclists are measured with twelve items as shown in Table 1.These measures refer to the study results originally conducted in the UK and the US. Some measures were partly obtained by categorising and contextualising risk taking behaviour of car drivers in the UK through studying their motivations and attitudes towards risk ((Musselwhite, 2006). In the meantime, the other parts were resulted from emerging themes from preliminary focus group data conducted in the US (Rhodes and Pivik, 2011).
These measures however, are generally regarded as relevant to represent the existing
motorcyclists’ behaviours in Bali, despite some riding characteristics in Bali have been
observed differently to those in the UK and the US, for instance motorcyclists are commonly speeding and manoeuvring among stationary or moving vehicles to get ahead of the congested traffic (Wedagama and Dissanayake, 2010b). Further studies therefore, are required to identify more on these riding characteristics in Bali.
Table 1. Twelve behaviour measures
7. Passengers doing things that can distract you while riding Y7 X7 Z7
8. Run a red light Y8 X8 Z8
9. Doing thing that can distract you while riding Y9 X9 Z9
10. Braking hard to stop in time Y10 X10 Z10
11. Peak hour riding Y11 X11 Z11
2018
Meanwhile, Structural Equation Model (SEM) has been widely used to give numerical estimates which suggesting the strength of the relationships among the model parameters. In this study therefore, SEM is used to test the conceptual models above and to analyse the measures variables which are good indicators of the latent variables.
2.2. Structural Equation Model (SEM)
Structural Equation Modelling (SEM) is a statistical tool used to resolve simultaneous multilevel models that can not be solved by linear regression. In addition, SEM can be considered as a combination among multiple regression, path and factor analyses. SEM can be used to construct the model equations with a large number of endogenous and exogenous variables and latent (unobserved) variables. These variables are classified as linear combinations of the observed variables. Hypotheses regarding causal relationships among observed and unobserved variables are tested with each direct effect corresponds to an arrow in a path diagram. The analysis is based on matrix covariance which providing more accurate than the linear regression analysis (Hair, et.al, 2010). This modelling technique is able to examine simultaneous dependence relationships so it helps to address such complicated human behavioural issues.
An assessment whether the developed model fits the data is also an important stage in SEM. There have been many criteria however, for assessing the goodness of fit of the constructed models (Hooper, et.al, 2008; Schermelleh-Engel and Moosbrugger, 2003). The indices for model assessment do not count on comparison with a baseline model. Instead, a measure of goodness of fits of the model is compared to no model at all (Jöreskog and Sörbom, 1993, in Hooper, et.al, 2008). These include the Chi-Squared test, Root Mean Square Error of Approximation (RMSEA), Goodness-of-Fit Index (GFI), Adjusted Goodness-of-Fit Index (AGFI), Root Mean Square Residual (RMR) and Standarised Root Mean Square Residual (SRMR) (Hooper, et.al, 2008).
The Chi-Square value has long been used to measure overall model fit. This value shows the difference between the sample and fitted covariance matrices. Due to its limitation, the relative chi square which is the ratio between 2 and df (degree of freedom) has been used to assess model fit. A rule of thumb for this index is ranged from as high as 5.0 to as low as 2.0 (Wheaton et al, 1977 and Tabachnick and Fidell, 2007 in Hooper, et.al, 2008). An SRMR will be low however, as model consisting high number of parameters and using large sample sizes. Both AGFI and GFI are also likely to increase with sample size. Consequently, they are not used as an individual index considering the effect of sample size on these indices (Hooper, et.al, 2008).
2019
Table 2. Structural equation model evaluations: some rules of thumb
Fit Measures Good Fit Acceptable Fit
Root Mean Square Error of Approximation (RMSEA) 0 <RMSEA< 0.05 0.05 RMSEA 0.10 Standarised Root Mean Square Residual (SRMR) 0 SRMR 0.05 0.05<SRMR 0.10
Normed Fit Index (NFI) 0.95NFI1 0.90NFI0.95
Non-Normed Fit Index (NNFI) 0.97NNFI1 0.95NNFI0.97
Comparative Fit Index (CFI) 0.97CFI1 0.95CFI0.97
Goodness-of-Fit Index (GFI) 0.95GFI1 0.90GFI0.95
Adjusted Goodness-of-Fit Index (AGFI) 0.90AGFI1 0.85AGFI0.90
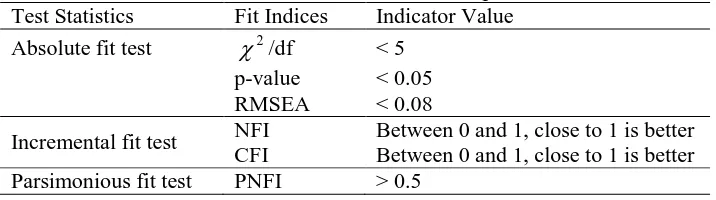
In addition, Lai (2011) considers Parsimony Normed Fit Index (PNFI) as a fit index and summarises criteria to assess goodness-of-fit for overall Structural Equation Models as shown in Table 3. More details on structural equation modelling can be found in Hair, et.al (2010).
Table 3. Goodness of fit for structural equation model
Test Statistics Fit Indices Indicator Value
Absolute fit test 2/df < 5
p-value < 0.05
RMSEA < 0.08
Incremental fit test NFI CFI
Between 0 and 1, close to 1 is better Between 0 and 1, close to 1 is better
Parsimonious fit test PNFI > 0.5
3. METHODS
3.1. Data Collection
Denpasar, the capital city of Bali Province, is used as the case study area. It has an area of 123.98 km2 and the population is about 863,600 in 2013 (Statistics of Bali Province, 2014). Motorcycles are accounted for by more than 85% of total modes of transport running on the road in Denpasar (Statistics of Bali, 2014). They are used for multipurpose trips including working, shopping and leisure. In addition, motorcycle has been widely believed to be more useful in dealing with traffic congestion and more efficient compared to either private cars or public transport (Wedagama and and Dissanayake, 2010a). Motorcycles therefore, are considered as the most favourite vehicle among other transportation modes in Denpasar.
In this study, questionnaires are developed following a past study by Rhodes and Pivik (2011) and used to collect the data. There were 400 questionnaires were distributed to randomly selected motorcyclists living in Denpasar in June-July 2014. The motorcyclists were informed on the purpose of the survey and asked for their willingness to participate before the survey begins. Only 328 samples however, are effectively used generating the response rate of 82%. All respondents aged between 16 and 57 years old of which 160 (48.8%) and 168 (51.2%) were male and female respectively. For the age division, young motorcyclists under 26 years old were 64.33% of the total respondents. In addition, the mean and standard deviation of age of the participants were 26.60 years old and 10.96 years respectively.
2020
measured with a 5-point scale. The motorcyclists pointed out on a 5-point scale how
frequently they engaged in risky behaviours from “Never (1)” to “Always (5)”, subsequently
followed with their perception from “Not risky at all (1)” to “Extremely risky (5)” on the involvement in each behaviour. Lastly, the motorcyclists described their affection in each behaviour from “Dislike a lot (1)” to “Like a lot (5).”
3.2. Preliminary Data Analysis
Figures 1, 2 and 3 show the survey results of self-reported risky behaviour measures of motorcyclists in Denpasar. Figure 1 shows that more than 70% of motorcyclists perceive drink and ride (X6) is extremely risky behaviours. Generally, less than 10% of the motorcyclists perceive all measures are not risky at all. In other words, the motorcyclists mostly consider all measures can potentially be resulted in motorcycle accidents.
Figure 1. Self-reported risk perceptions of motorcyclists in Denpasar
Figure 2 describes that more than 60% of motorcyclists potentially like to changing lane (Z1) while riding on the road. About 90% of motorcyclists are not favourable of drunk riding (Z6) while less than 20% of motorcyclists like to do all measures while on the road.
0% 10% 20% 30% 40% 50% 60% 70% 80% 90% 100% X1
X11 X8 X7 X2 X10 X3 X9 X12 X4 X5 X6
Risk Perception
2021
Figure 2 Self-reported positive affect of motorcyclists in Denpasar
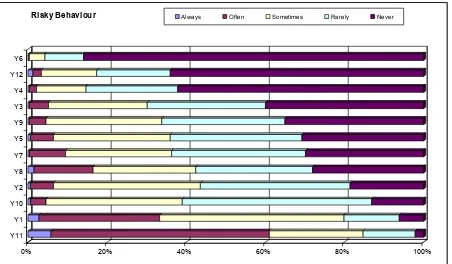
As shown in Figure 3, nearly 90% of motorcyclists have never been drunk while riding motorcycle (Y6) and about 60% of those have frequently been riding during peak hours (Y11). Interestingly, only less than 10% of the motorcyclists have never been changing lanes (Y1) while on the road. In addition, Figures 1, 2 and 3 indicates that drunk riding is the most risky perceived, the least preferred and the least frequent behaviour conducted by motorcyclists respectively in Denpasar.
Figure 3 Self-reported risky behaviours of motorcyclists in Denpasar
0% 20% 40% 60% 80% 100%
Y11 Y1 Y10 Y2 Y8 Y7 Y5 Y9 Y3 Y4 Y12 Y6
Risky Behaviour Always Often Sometimes Rarely Never
0% 20% 40% 60% 80% 100%
Z1 Z7 Z3 Z2 Z11 Z10 Z8 Z9 Z5 Z4 Z12 Z6
Postive Affect
2022
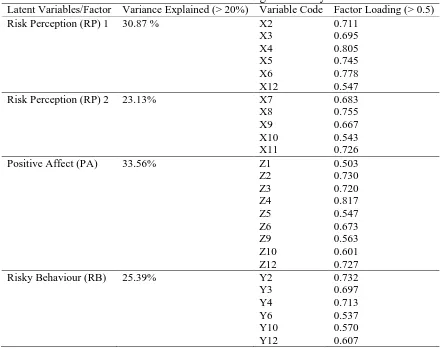
In order to examine the variable inclusion in the model, each variable is subjected to Factor Analysis. The maximum variance method (MVM) is used to determine the main components. As the results, loading factors of six observations consisting X1, Y1, Y5, Y7, Y8, Y9, and Y11 are considered insignificant (loading factors < 0.5). In addition, three observations of Z7, Z8 and Z11 are grouped into a factor which explained less than 20% of variance which is considered insignificant (Hooper, et.al, 2008). Consequently, these observations are not included in model construction. Table 4 shows variables and factors included in the model development.
The risk perception (RP) is separated into two latent variables consisting RP1 and RP2. A group of observed variables (X2, X3, X4, X5, X6 and X12) reflecting riding style is classified as a latent variable of RP1. Meanwhile, some observed variables (X7, X8, X9, X10 and X11) indicating riding disturbances are grouped into a latent variable of RP2.
Table 4. Variables selection using factor analysis
Latent Variables/Factor Variance Explained (> 20%) Variable Code Factor Loading (> 0.5)
Risk Perception (RP) 1 30.87 % X2
4. MODEL DEVELOPMENT AND ANALYSIS
2023
Perceptions (RPs) 1 and 2. These factors have 6 (X2-X6, X12) and 5 (X7-X11) observed variables respectively while Positive Affect (PA) and Risky Behaviours (RB) contain 9 (Z1-Z6, Z9-Z10, Z12) and 6 (Y2-Y4, Y6, Y10, Y12) observed variables respectively. Thus, RP and PA are expected independently to influence risky riding behaviours.
Figure 4. The developed model
In this study, the combined model validity criteria of Schermelleh-Engel and Moosbrugger (2003) and Lai (2011) is used to assess the goodness of fit of the developed model as shown in Table 5. As the result, the NFI, NNFI, CFI, GFI and AGFI values are less than the cut off point shown in Table 2. However, based on 2/df, RMSEA, SRMR and PNFI values, the developed model is statistically acceptable.
Table 5. Goodness of fit of the developed structural equation model
Fit Measures
2
df p-value
2
/df RMSEA SRMR NFI NNFI CFI GFI AGFI PNFI
Developed
Model 1384.45 293 0 4.72 0.1 0.07 0.85 0.87 0.88 0.75 0.71 0.77
2024
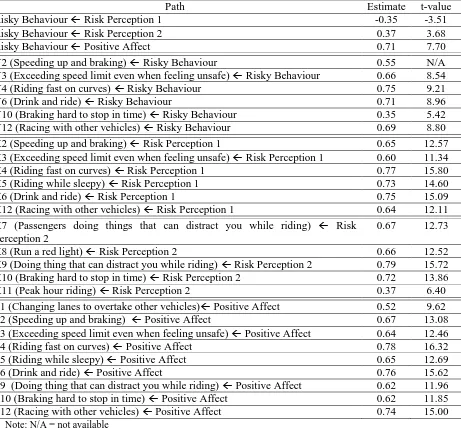
Y3 (Exceeding speed limit even when feeling unsafe) Risky Behaviour 0.66 8.54
Y4 (Riding fast on curves) Risky Behaviour 0.75 9.21
Y6 (Drink and ride) Risky Behaviour 0.71 8.96
Y10 (Braking hard to stop in time) Risky Behaviour 0.35 5.42
Y12 (Racing with other vehicles) Risky Behaviour 0.69 8.80
X2 (Speeding up and braking) Risk Perception 1 0.65 12.57
X3 (Exceeding speed limit even when feeling unsafe) Risk Perception 1 0.60 11.34
X4 (Riding fast on curves) Risk Perception 1 0.77 15.80
X5 (Riding while sleepy) Risk Perception 1 0.73 14.60
X6 (Drink and ride) Risk Perception 1 0.75 15.09
X12 (Racing with other vehicles) Risk Perception 1 0.64 12.11
X7 (Passengers doing things that can distract you while riding) Risk Perception 2
0.67 12.73
X8 (Run a red light) Risk Perception 2 0.66 12.52
X9 (Doing thing that can distract you while riding) Risk Perception 2 0.79 15.72
X10 (Braking hard to stop in time) Risk Perception 2 0.72 13.86
X11 (Peak hour riding) Risk Perception 2 0.37 6.40
Z1 (Changing lanes to overtake other vehicles) Positive Affect 0.52 9.62
Z2 (Speeding up and braking) Positive Affect 0.67 13.08
Z3 (Exceeding speed limit even when feeling unsafe) Positive Affect 0.64 12.46
Z4 (Riding fast on curves) Positive Affect 0.78 16.32
Z5 (Riding while sleepy) Positive Affect 0.65 12.69
Z6 (Drink and ride) Positive Affect 0.76 15.62
Z9 (Doing thing that can distract you while riding) Positive Affect 0.62 11.96
Z10 (Braking hard to stop in time) Positive Affect 0.62 11.85
Z12 (Racing with other vehicles) Positive Affect 0.74 15.00
Note: N/A = not available
The positive affect (loading factor = 0.71) is found to influence more than all risk perception measures on risky behaviours. Accordingly, this specifies that motorcyclists in Denpasar are more relied on intuitive than rational processes while on the road. This is consistent with a past study findings which concluded that positive affect, which is characterised by positive emotions in driving pleasures, is a strong predictor for risky behaviour for teen and male drivers than for adult and female drivers (Rhodes and Pivik (2011). In addition, a previous study by Budiartha R.M (2014) found that positive affect is
significantly related to teens’ risky driving/riding behaviours in Denpasar. As with both previous studies, this study therefore, suggested that further studies should focus on the role of positive affect of motorcyclists on risky behaviours. These further studies are expected to find some more explanations to reduce risky riding behaviours.
2025
Statistically, the strongest predictor of these 6 measures for negative influences on risky behaviours is riding fast on curves with a loading factor of 0.77.
In contrast, there are positive causal relationships (estimated value = 0.37) between the other 5 risk perception measures and risky riding behaviours. These measures consist of passengers doing things that can distract a motorcyclist while riding, run a red light, a motorcyclists does something that can distract him/herself while riding, braking hard to stop in time, and peak hours riding. This result may be described as motorcyclists perceive and behave consistently on such measures while riding on the road. With a loading factor of 0.79, a motorcyclist doing something that can distract him/herself while riding (e.g. using mobile phone) is statistically considered as the most risky behaviours. In fact, more than 40% of the respondents perceived such an action as extremely risky and risky behaviours while consistently have rarely and never been doing so while riding motorcycles.
In the meantime, the positive affect or riding experiences enjoyed by motorcyclists is significantly found connected with risky riding behaviours (estimated value = 0.71). This shows that positive affect influences more than risk perceptions on risky behaviours. These positive affect measures consist of changing lanes to overtake other vehicles, speeding up and braking, exceeding speed limit even when feeling unsafe, riding fast on curves, riding while sleepy, drink and ride, doing thing that can distract motorcyclists while riding, and braking hard to stop in time. The strongest predictor of enjoyment for risky riding behaviours is riding fast on curves with a loading factor of 0.78. Interestingly, based on the survey results, about 5% the respondents perceive riding fast on curves as not risky at all. In addition, less than 20% of the respondents enjoy it while more than 30% frequently (always and often) do so.
Being a significant indicator for risky riding behaviour, riding fast on curves can be described as negatively perceived and positively enjoyed by motorcyclists. In fact, motorcyclists can be seriously injured if they fail to negotiate curves because of excessive speed. This indicated that riding fast on curves may considerably be accounted for both rational and intuitive processes of motorcyclists’ decision making while riding on the road.
In this study, the models are also subsequently developed based on age consisting younger (under 26 years old) and mature (above and equal 26 years old) motorcyclists and gender (female and male motorcyclists). The model results however, are not statistically significant. This is possibly due to the insufficient sample size for each of age division and gender models. Further studies therefore, are expected to consider more sample size particularly in modelling motorcyclists’ behaviour based on age division and gender.
5. CONCLUSIONS
This study found that risk perceptions and positive affect measures have the influence on risky riding behaviours. Risk perception measures have both positive and negative influences on risky riding behaviours. Further, positive affect influences more than risk perception on risky behaviours. More specifically, motorcyclists have been found to consistently perceive and behave on such a risky behaviour that may distract them on the road, for instance using a mobile phone while riding a motorcycle. In addition, riding fast on curves may considerably
be accounted for both rational and intuitive processes of motorcyclists’ decision making while
riding on the road.
2026
traffic regulations, education and campaigns are required to control the positive affect of motorists, in particular motorcyclists, to minimise motorcycle accidents.
REFERENCES
Ambak, K., Ismail, R., Abdullah, R.A. and Borhan, M.N, (2011) Using Structural Equation Modelling and the Behavioral Sciences Theories in Predicting Helmet Use, Paper presented at the International Conference on Advanced Science, Engineering and Information Technology, Putrajaya, Malaysia, January, 14-15.
Bali Regional Police. 2014 Accident Data Report.
Budiartha R.M, N. (2014) Factors Influencing Car Drivers and Motorcyclists’ Risky
Behaviours in Bali, Journal of Society for Transportation and Traffic Studies, 5 (2), 12-22.
Hair, J.F., Black, W.C., Babin, B.J, and Anderson, R.E. (2010) Multivariate Data
Analysis, 7th Edition. Pearson Prentice Hall, New York.
Hongsranagon, P., Khompratya, T., Hongpukdee, S., Havanond, P, and Deelertyuenyong, N. (2011) Traffic Risk Behavior and Perceptions of Thai Motorcyclists: A Case Study.
Journal of International Association of Traffic and Safety Sciences (IATSS) Research,
35, 30–33.
Hooper, D., Coughlan, J. and Mullen, M. (2008) Structural Equation Modelling: Guidelines for Determining Model Fit. Electronic Journal of Business Research
Methods, 6(1), 53-60.
Indriastuti, A.K. and Sulistio, H. (2010) Influencing Factors on Motorcycle Accident in Urban Area of Malang, Indonesia. International Journal of Academic Research, 2 (5), 252–255.
Joewono, T.B., Vandebona, U. and Susilo, Y.O. (2015) Behavioural Causes and Categories of Traffic Violations by Motorcyclists in Indonesian Urban Roads. Journal
of Transport Safety and Security, 7(2), 174-197.
Jonah, B.A. (1986) Accident Risk and Risk-Taking Behaviour among Young Drivers.
Accident Analysis and Prevention, 18(4), 255-271.
Lai, S.F. (2011) The Accident Risk Measuring Model for Urban Arterials, Paper Presented at the 3rd International Conference on Road Safety and Simulation, Indianapolis, USA, September 14-16.
Matthews, M.L. and Moran, A.R. (1986) Age Differences in Male Drivers’ Perception of
Accident Risk: The Role of Perceived Driving Ability. Accident Analysis and
Prevention, 18(4), 299-313.
Musselwhite, C. (2006) Attitudes towards Vehicle Driving Behaviour: Categorising and Contextualising Risk. Accident Analysis and Prevention, 38, 324-334.
Ramli, R., Oxley, J., Noor, F.M., Abdullah, N.K., Mahmood, M.S., Tajuddin, A.K. and McClure, R. (2014) Fatal Injuries among Motorcyclists in Klang Valley, Malaysia.
Journal of Forensic and Legal Medicine, 26, 39-45.
Rhodes, N. and Pivik, K. (2011) Age and Gender Differences in Risky Driving: The Roles of Positive Affect and Risk Perception. Accident Analysis and Prevention, 43(3), 923-931.
Sabey, B.E. and Taylor, H. (1980) The Known Risks We Run: The Highway. Transport
and Road Research Laboratory Supplementary Report 567. The United Kingdom.
Schermelleh-Engel., K. and Moosbrugger, H. (2003). Evaluating The Fit of Structural Equation Models: Tests of Significance and Descriptive Goodness of-Fit Measures.
2027 Statistics of Bali Province. (2014) Bali in Figures.
Wedagama, D.M.P. (2009a) Predicting The Influence of Accident Related Factors on Motorcycle Fatal Accidents Using Logistic Regression (Case Study: Tabanan, Bali).
Jurnal Teknik Sipil - Institut Teknologi Bandung, 16(1), 29-37.
Wedagama, D.M.P. (2009b) The Influence of Young and Male Motorists Accident Factors on Motorcycle Injuries in Bali. Journal of International Association of Traffic
and Safety Sciences (IATSS) Research, 33(2), 64-75.
Wedagama, D.M.P. and Dissanayake, D. (2010a) Analysing Motorcycle Injuries on Arterial Roads in Bali using a Multinomial Logit Model. Journal of the Eastern Asia
Society for Transportation Studies, 8,1892 -1904.
Wedagama, D.M.P. and Dissanayake, D. (2010b) The Influence of Accident Related Factors on Road Fatalities Considering Bali Province in Indonesia as a Case Study.