THE EFFECT OF USING MIND MAPPING ON THE WRITING COMPREHENSION ABILITY OF THE TENTH GRADE STUDENTS AT
SMA TIGA MARET YOGYAKARTA IN THE ACADEMIC YEAR OF 2014/2015
A Thesis
Submitted as Partial Fulfillment of the Requirements for the Attainment of the Degree of Sarjana Pendidikan in English Language Education
by:
Ari KurniaWijaya 07202244149
ENGLISH EDUCATION PROGRAM FACULTY OF LANGUAGE AND ARTS
PERNYATAAN
Yang bertandatangan dibawah ini:
Nama : Ari KurniaWijaya
Nim : 07202244149
Program Studi : Pendidikan Bahasa Inggris Fakultas : Bahasa dan Seni
JudulSkripsi : THE EFFECT OF USING MIND MAPPING ON THE WRITING COMPREHENSION ABILITY OF THE TENTH GRADE STUDENTS AT SMA TIGA MARET YOGYAKARTA IN THE ACADEMIC YEAR OF 2014/2015
menyatakan bahwa karya ilmiah ini adalah hasil karya saya sendiri dan sepengetahuan saya tidak berisi materi yang ditulis oleh orang lain kecuali bagian-bagian tertentu yang saya ambil sebagai acuan dengan mengikuti tata cara dan etika penulisan karya ilmiah yang lazim.
Apabila terbukti bahwa pernyataan saya ini tidak benar, sepenuhnya menjadi tanggung jawab saya.
Yogyakarta, Maret 2016 Yang membuat pernyataan
DEDICATION
MOTTOS
ACKNOWLEDGMENTS
First of all, praise be to Allah SWT for the blessing and mercy given to me during my study so that I finally can finish this thesis.
First, I would like to thank my first consultant, Dr. AgusWidyantoro, M.Pd., whose advice, encouragement, criticism and suggestion have been a feature of the writing process from the very beginning of this thesis.
Then, I wish to thank my academicconsultant, Jamilah , M.Pd and all lecturers of English Education Department of State University ofYogyakarta for the guidance, support, and knowledge that they have given to me.
Thanks are also due to the principaland the English teacher of SMA Tiga Maret Yogyakarta for the guidance, helping, and cooperation.
I would like to thank my beloved parents, Sofyannoor and Alm. Irma Suryani. My brothers and sister,Ahoex, Kapy, Rama, Idan, and my grandmotherwho always prays for me.Also thank for my family in UKM SICMA UNY, that always give support to me.And last, my deepest gratitude goes toSha for her support.
I realize that this thesis is not perfect. Therefore, I welcome all criticisms and suggestions from those interested in the similar topic. By looking at the other side of these imperfections, I do expect this thesis will be useful for whoever reads it, particularly the students of English Education Department of State University ofYogyakarta.
Yogyakarta,Maret 2016
Researcher,
TABLE OF CONTENTS
TABLE OF CONTENTS ... viii
LIST OF TABLE ... xi
LIST OF APPENDICES ... xiii
CHAPTER I INTRODUCTION ... 1
A. Background of the Study ... 1
B. Identification of the Problem ... 3
C. Limitation of the Problem ... 4
D. Formulation of the Problem ... 5
E. The Objective of the Study ... 5
F. Significance of the Study ... 6
CHAPTER II REVIEW OF RELATED THEORIES ... 7
A. LITERATURE REVIEW ... 7
1. Writing Skill... 7
2. Teaching of Writing ... 11
3. The Teaching of Writing at Senior High School ... 15
4. Micro Skill of Writing ... 16
5. Strategies in Teaching Writing ... 18
6. The Mind Mapping ... 20
B. RELEVANT STUDY ... 24
CHAPTER III ... 27
RESEARCH METHODS... 27
A. Research Type ... 27
B. Research Variable ... 28
C. Population and Sample ... 28
D. Time and Place ... 30
E. Research Design ... 30
F. Research Instrument ... 31
G. The Validity and the Reliability of the Researcher Instrument ... 31
1. The Validity of the Research Instrument ... 31
2. Reliability of the Research Instrument ... 32
H. Data Collection Procedure ... 32
I. Data Analysis Technique ... 33
a. Descriptive Analysis ... 33
b. Inferential Analysis ... 35
CHAPTER IV RESEARCH FINDING AND DISCUSSIONS ... 38
A. Descriptive Analysis ... 38
1. Control Class ... 38
2. Experimental Class ... 42
B. Inferential Analysis ... 47
1. Pre-testing Analysis ... 47
2. Hypothesis Testing... 49
C. Discussion ... 50
CHAPTER V ... 54
CONCLUSION, IMPLICATION, AND SUGGESTION ... 54
A. Conclusions ... 54
B. Implication ... 54
REFERENCES ... 57
VALIDITY AND RELIABILITY OF RESEARCH INSTRUMENT ... 63
A. VALIDITY OF THE INSTRUMENTS ... 64
B. RELIABILITY OF THE INSTRUMENT ... 68
APPENDIX 3 STATISTICAL ANALYSIS OF THE DATA ... 77
DATA ANALYSISS ... 78
A. Descriptive Analysiss ... 78
B. Inferential Analysiss ... 78
1. Normality Test ... 78
2. Homogeneity Test ... 78
3. Hypothesis Test ... 79
APPENDIX 4 STUDENTS’ SCORE ... 80
APPENDIX 5COURSE GRID, LESSON PLANS, AND LEARNING MATERIALS ... 83
APPENDIX 6 EXAMPLE OF STUDENTS’ WRITING PRODUCT ... 106
APPENDIX 7 PHOTOGRAPHS ... 111
LIST OF TABEL
Table 1: Standard of Competence and Basic Competence of Writing Skill
for Senior High School Students Grade X Semester One ... 15
Table 2: Nonequivalent Control Group Design ... 27
Table 3: The Distribution of the Samples... 29
Table 4: Value of the Reliability Coefficient ... 32
Table 5: Data Collecting Schedule ... 33
Table 6: Guidelines for Providing Interpretation of Research Variables ... 35
Table 7: Frequency Distribution of the Pre-test Scores on Student’s Writing Ability of the Control Class...39
Table 8: Frequency Distribution of the Pre-test Scores on Student’s Writing Ability of the Control Class ... 39
Table 9: Frequency Distribution of the Posttest Scores on Student’s Writing Ability of the Control Class ... 40
Table 10: Frequency Distribution of the Posttest Scores on Student’s Writing Ability of the Control Class. ... 41
Table 11: Statistical Data of the Pre-Test and Post-Test Scores of the Control Class ... 42
Table 12: Frequency Distribution of the Pre-test Scores on Student’s Writing Ability of the Control Class ... 43
Table 14: Frequency Distribution of the Post-test Scores on Student’s Writing Ability of the Experimental Class ... 45 Table 15: Frequency Distribution of the Posttest Scores on Student’s
Writing Ability of the experimental class...46
Table 16: Statistical Data of the Pre-Test and Post-Test Scores of the Experimental Class ... 47 Table 17: The Normality Test of the Students’ Writing Test in the
LIST OF APPENDICES Appendix 1:Research Instrument
Appendix 2: Validity and Reliability of the Instrument Appendix 3: Statistical Analysis Of the Data
Appendix 4: Student’s Score
Appendix 5: Course Grid, Lesson Plans, And Learning Materials Appendix 6: Example of Student’s Writing Product
THE EFFECT OF USING MIND MAPPING ON THE WRITING
COMPREHENSION ABILITY OF THE TENTH GRADE STUDENTS AT SMA TIGA MARET YOGYAKARTA IN THE ACADEMIC YEAR OF 2014/2015
ABSTRACT
Ari Kurnia Wijaya/ 07202244149
This research is aimed at finding and describing the effect of using mind mapping on the writing comprehension ability of the tenth grade students at SMA Tiga Maret Yogyakarta in the academic year of 2014/2015. This research was conducted from Mayto June 2015.
This research was classified as a quasi-experimental study. It involved 31 students from two groups, Class B (16 students) as the experimental group and Class A (15 students) as the control group. The experimental group was students taught using mind mapping whereas the control group was students taught using conventional technique. The data were obtained by using pre-test and post-test. The pre-test was given to both groups before the treatment and the test was given after the treatment. The data of the pre-test and post-test of both groups were analyzed by using descriptive and inferential statistics. After the data were tested and found to be homogeneous and
normal, the hypothesis was tested using ANCOVA (Analysis of Covariance). The result of the research shows that the difference in the writing ability between the students taught using mind mapping and those taught not using mind mapping is not too significant. It can be seen in the result of the hypothesis testing through ANCOVA (Analysis of Covariance). The
HAPTER I INTRODUTION
A. Background of the Study
reason why learning techniques are needed in learning activities to help the students.
A technique is a method that is used during the learning process. One technique that has proven and is capable of optimizing learning outcomes is the mapping technique called mind maps (Mind Mapping). According to Edward (2009: 64), mind mapping is the most effective and efficient way to enter, store and retrieve data from or to the brain. Mind Mapping is a way of noting the subject matter that allows students to learn writing.
A technique popularized by Buzan is an effective technique to improve writing skills. Mind Mapping is to write the main theme as a central point and to make branches of each theme. That means the focus of learning is directed at the main theme, the finer points of the theme that is being studied, the development of each of these important points and find the relationship between any points. In this way, it can be obtained an overview of what has been known and which areas are still not yet well understood.
Mind Mapping will greatly assist students in exploiting the potency of both sides of their brain. A good interaction between the two parts of the brain can trigger creativity that provides convenience in the process of writing. The students that always use and develop their potency of the brain parts will achieve an increase in some aspects, namely concentration, creativity, and understanding, then they can develop writing through mind mapping.
From observations conducted by the researcher at SMA Tiga Maret Yogyakarta, the English teacher of the tenth grade students has not used the technique of Mind Mapping in learning. In English learning, especially writing, the teacher basically just gave the material in textbooks or manuals used as a reference in teaching. Therefore, the student experience of writing is less spacious and limited. The strategy was not attractive enough that makes the low creativity in writing.
These factors encouraged the researcher conducted research on the effectiveness of mind mapping technique in writing. The result of this study is expected to become evidence that the technique of mind mapping can be one of proper technique in teaching writing.
B. Identification of the Problem
process of writing in the classroom. Based on the preliminary observation at SMA Tiga Maret Yogyakarta, there were some problems related to the teaching learning process of writing.
The first problem that the researcher found is coming from the students. The teacher gave them an example of texts and explained how to make it. When the teacher asked them to write with their own idea, they did not know what to be written, some students were confused and some did not have ideas. During making a text, there were many errors in their text such as spelling, capitalization, grammar, and tenses.
The second problem is related to the learning materials. In that meeting, the teacher only used a course book as a reference. The teacher explained the material in that course book well but it did not attract the students to contribute in learning.
. Limitation of the Problem
Knowing the effect of mind mapping on writing that can help the teacher to present the materials and help the students to find and develop the idea and write the idea into a text is the focus in this study. The reasons why the researcher chose mind mapping as the technique is mind mapping can make the students more interested in the topic of the lesson. Mind mapping can attract student’s attention with many pictures and many colors. The teacher can also use association in this technique.
The teachers also can present many English words in interesting ways. In this study, the subjects were the tenth grade students of SMA Tiga Maret Yogyakarta. The researcher found that some students still had difficulties dealing with writing. It is a difficult subject to learn for them because teacher does not teach them to make writing as a habit.
D. Formulation of the Problem
E. The Objective of the Study
The objective of the research can be stated as to find out whether there is a significant difference in writing ability between grade ten students of SMA Tiga Maret Yogyakarta taught by using the mind mapping technique and those who are taught not using the mind mapping technique.
F. Significance of the Study
It is expected that this study can be useful to the English teachers, English Education Department students, and other researchers.
. For the English teachers
This research is expected to give contribution to the English teachers that mind mapping technique is an alternative technique in teaching writing.
2. For the English Education Department student
It is expected that they will be able to use this technique to fix the student’s problems related to the writing ability.
3. For other researchers
HAPTER II
LITERATURE REVIEW AND ONEPTUAL FRAMEWORK
A. LITERATURE REVIEW
1. Writing Skills
a. Definition of Writing
Writing is a process that transforms our mind or idea into the written form. It should be organized into the coherent and cohesive paragraphs. “Coherence means the sentences must hold together, that is the movement from one sentence to the next must be logical and smooth” (Oshima and Hogue, 2006: 94). It holds together within and among the paragraphs. The sentences in a paragraph have to show the coherence of the paragraph. It means that the paragraphs are related to the previous and the next ones. The use of techniques such as transitional words, pronoun, repeated key words, and the parallel structure is called cohesion. The application of coherence and cohesion is useful to make the texts clear and easy to be understood.
related to the elements of the writing, in order the readers can understand the message conveyed by the author. Therefore, the author should use the structure such as a word, phrase, paragraphs, and others well.
Writing must have goals or aims. When the writers write, they generate the ideas and transform it into a text. Then they have to be able make their reader understand about the writing. The way of the writers communicates their writing gives big impact about how easy or not the reader understands the writing.
Knowledge of grammar and rhetoric such as arranging words, phrases, sentences, and paragraphs in such a way that attract the reader’s attention is needed to consider a text as a good writing. It can be seen that writing is an ability to express the ideas, mind, knowledge and experiences of life through written language clearly, so the readers can understand what the author means.
Lenneberg in Brown (200:334) argues that human being universally learns to talk, but writing is learned to be behavior. The students are expected to make good behavior in writing skill in order to ensure one of his communicative competences. Writing is a visual representation of listening and speaking, and the language learner must be engaged in communicating his ideas and feelings. A writing should be effective and be able to send its messages in a good way. The students get to keep practicing on how to make a good writing.
Elbow (973) in Brown (200: 336) also says that writing is a two-step process. The first process is figuring out the meaning and the second process is putting the meaning into language. Writing represents what we think and what we feel. Writing also reflects things, which stay in the mind and heart. The students find many difficulties when they start looking for some reasons to write and producing their ideas into a text.
The students have to use their own ability to write. The teacher also must give motivation continuously to them in order they want to write by their own idea. The teacher should help the students by using an instructional media like mind mapping to motivate them in writing, which is believed can improve the understanding of the student. The using of mind mapping can make the students confident and can increase the student’s interest in the learning of writing. From its objective, writing is viewed as a means of communication which is commonly used to express and impress (Nunan: 2003). It means that the writers compose their writing works with a purpose. That is to express what on their mind and to impress the reader with their writing.
2. Teaching of Writing
Brown (200, 343-346) stated five major categories of classroom writing performance. They are imitative, intensive, self-writing, display writing, and real writing.
a. Imitative, or writing down
At the beginning of writing, the students will write down English letters, words, and sentences. They will learn the conventions of the orthographic code.
b. Intensive, or controlled writing
The students will learn about grammatical concepts. This will be like a written grammar exercises that has function to improve grammar ability of them.
c. Self-writing
The activity of this category in classrooms is note-taking, where the students take notes for the purpose of later recall.
d. Display writing
The short answer exercises, essay examinations, and research reports are the elements of display.
e. Real writing
is an advancement of students’ occupation. And personal involves the writing of diaries, letter, post card, notes, and personal message.
Brown (200: 346-356) develops some principles for designing interactive writing techniques. They are as follows.
) Incorporating practices of “good” writers. A good writer has some criteria. They are: a) Focusing on goals or main ideas in writing. b) Gauging their audience perceptively.
c) Spending some time (but not too much) planning to write. d) Letting their first ideas flow onto the paper easily.
e) Following the general organizational plan as they write. f) Soliciting and utilizing feedback on their writing. g) Are not wedded to certain surface structure. h) Revising their work willingly and efficiently. i) Making as many revisions as needed patiently. 2) Balancing process of product
3) Accounting for cultural/literary backgrounds
The teacher has to see literary background of every student and help them to use of acceptable English rhetoric.
4) Connecting reading and writing
Reading can help the student to observe what they already wrote or how to find more information and error.
5) Providing as much authentic writing as possible
Publishing a class newsletter, writing letters to people outside of class, writing a script for a skit or dramatic presentation, writing a resume, writing advertisements-all these can be seen as authentic writing.
6) Framing the techniques in terms of prewriting, drafting and revising stages Process writing approaches tend to be framed in three stages of writing. The prewriting stage encourages the generation of ideas, which can happen in numerous ways. The drafting and revising stages are the core of process writing.
that the teacher should be able to guide and facilitate the students to use the language.
There are several steps to teach English writing well. Harmer (2004: 4) explains that there must be five steps at least in teaching writing.
The first step in teaching English writing is demonstrating. In this stage, the teacher show the students all about material that is going to be learned. Then the teacher demonstrates how to make it, what the purpose and the functions.
After demonstrating, the second stage is motivating and provoking the students. In this steps, the teacher must be giving motivation and provoking the students in generating or finding the ideas with simple and easy ways. It will be better for the teacher to prepare what they will do in class. For example, the teacher prepares some mind mapping picture to be shown in class. From the picture, the students can generate their own idea and then they can write in a correct sentence.
The third step in teaching English writing are supporting. The teacher should support anytime when the students need their helps in the classroom.
The last step is evaluating. The teacher must evaluate in every task and activity. In evaluating the student’s works, the teacher judge their work as the final product. The teacher gives the feedback to the students in order they can learn from their mistake and avoid it on the next task and activity.
3. The Teaching of Writing at Senior High School
According to the Regulation of National Education Ministry (Permendiknas) no.2, year 2006 about the standard of competences and basic competences for English teaching-learning process which has proposed by BSNP 2006 (Badan Standar Nasional Pendidikan) the Senior High School students grade X in the first semester have to pose several competences as follows.
Table 1: Standard of ompetence and Basic ompetence of Writing Skill for Senior High School Students Grade X Semester One
Standard of competence Basic competence
To express an idea in a short functional written text in the
context of daily life
To express short, simple, functional essays in the genres
of recount, narrative, and procedure in the context of
daily life
To express meanings and steps of rhetorical essays in accurate, fluent, and acceptable way using written style in the context of
daily life in the genres of recount, narrative, and procedure
Some treatments were given in the process of teaching-learning by the researcher. The students are expected to master the materials during 6 meetings. The researcher used the mind mapping as a technique to find its effect to the student’s writing skill.
4. Micro Skills of Writing
connecting and relating a sentence to other sentence or a paragraph to other paragraph in a sequence way.
Every skill has its own micro skills. Brown (2004: 343) describes the micro skills for writing production as follows.
) Produce graphemes and orthographic patterns of English.
2) Produce a writing at an efficient rate of speed to suit the purpose.
3) Produce an acceptable core of the words and use appropriate word order patterns.
4) Use acceptable grammatical system (e.g., tense, agreement, and pluralisation), patterns, and rules.
5) Express a particular meaning in different grammatical forms. 6) Use cohesive devices in written discourse.
7) Use the rhetorical forms and conventions of written discourse.
8) Appropriately accomplish the communication functions of written texts according to form and purpose.
9) Convey links and connections between events and communicate such relations as main idea, supporting idea, new formation, given information, generalization, and exemplification.
0) Distinguish between literal and implied meanings when writing.
2) Develop and use a battery of writing strategies, such as accurately assessing the audience’s interpretation, using prewriting devices, writing with fluency in the first drafts, using paraphrases and synonyms soliciting peer and instructor feedback. And using feedback for revising and editing.
5. Strategies in Teaching Writing
The teacher must have a strategy to make attractive and interesting learning. Harmer (2004: ) states that the students should pay attention not only in what to write but also in how to write. Writing means the process of generating the idea to become a meaningful sentence or paragraph. There are several strategies to make good writing.
a. The Way The Teacher Get The Student to Plan
b. The Way the Teacher Encouraging the Student to Draft, Reflect, and
Revise
In this stage the student have to make a draft and finish it as a proper writing or text. The teacher should check their draft and help them to reflect and revise it. Teacher can give an instruction for the students to check their draft to each other. It will lead them to collaborative writing. In this process, they will work collaboratively with their classmates in order to produce a good writing. They must give respond to each other’s drafts in terms of language and content and give suggestion to each other. They will share any ideas that are significant to their writing.
c. The Way the Teachers Respond to the Student’s Writing
6. The Mind Mapping
a. The Nature of the Mind Mapping
Mind Mapping Technique is a concept invented by Buzan. According to Buzan (2009: 2), the concept of Mind Mapping is based on how the brain stores information. A credible research shows that the brain is a collection of nerve cell branches that can store the information. It has so many branches. The brain has the ability to store information that is very much from word to word even columns. To recall rapidly, the brain needs a way so that the parts that have been saved can be expressed back into diverse forms.
According to Buzan (2009: 2), Mind Mapping is a storage system, withdrawal data, and exceptional access to giant library, which actually exist in the amazing brain, because the Mind Mapping helps collate and store as much information as desired, and group with a natural way.
effort to develop the activity of thinking in all directions, capturing thoughts in different angles and develop divergent thinking and creative thinking.
Mind Mapping has a number of advantages over linear recording forms. The advantages (2009: 06) described are as follows.
a). The main idea of the center section is more clearly defined. b). The relative importance of each idea is clearly indicated.
c).The relationship between key concepts will immediately be recognized because of the proximity and relationship.
d). As a result of the above advantages, memory and review both will be more effective and faster.
e). The nature of the structure that allows the addition of new information easily without graffiti and tuck in profanity,
f). Each different map will help to remember,
b. How to Make the Mind Mapping
Before making Mind Mapping, the students need some materials, namely blank paper, pens and colored pencils, and imagination. Buzan (2008: 2-23), suggests there are seven steps to make Mind Mapping. Seven steps are as follows. ) Putting the main idea in the center
Placing the main idea or topic in the middle of page will give maximum space for other ideas to radiate out from the center. It gives freedom to expand the ideas to any direction which is a perfect example of radiant thinking in action. 2) Using a picture or photo for the central idea
Pictures have a strong impact on imagination and memory. It also pleases sight and keeps attention focused.
3) Using colors
The use of color is a very good memory marker. Colors on mind mapping are not only to engage the right brain active, but also to help the grouping information.
4) Connecting main branches to the center picture and connect the second and third branches to the first and second.
at once. The connections among branches make it easier to understand and remember.
5) Making a curve line connector, not a straight line
Draw a connector curve line in each branch to make it more attractive and beautiful.
6) Using one key word for each line
A single key word gives more energy and flexibility for mind mapping. 7) Using pictures
An image has a lot of meanings because it can replace a keyword or simply reinforce key words that have been written previously.
c. Teaching Writing Using the Mind Mapping
Based on Feez and Joyce (2002: 27), there are some stages used to teach writing. Those can be described as follows.
) Building Knowledge of the Field (BKOF)
In this stage, teacher brainstorms the students. They have to think what they are going to learn. They can share it with their teacher and friends. This is pre topic before students studying material in details.
2) Modeling of the Texts ( MOT)
3) Joint Construction of the Texts ( JCOT)
In this stage, the students have to participate to do an writing exercise related to the topic. They can do it in group, in pairs or individually.
4) Independent Construction of the Texts (ICOT)
The students have to be able to practice their speaking. For example, the students can tell a story about their experience in front of the class. In writing aspect, the students are hoped to be able to write their ideas into writing and develop their idea using mind mapping.
5) Linking Related Texts
In this stage, the students have to recall or conclude what they have learnt in this teaching learning. Thus, the teacher should make sure that the task in the preceded stages: Building Knowledge of the Field, Modeling of Text, Joint Construction of Text, and Independent Construction of Text has been well accomplished so that the students are able to do the independent tasks.
B. Relevant Studies
mapping technique to improve the student’s writing for narrative text. The result showed that the mind mapping technique stimulated the student’s writing.
. onceptual Framework
The purpose of language teaching is to help students develop communication skills, both orally and in writing. One of the student ability is the ability to express their ideas using written language. Writing is one of the four language skills that are productive and expressive which contained activities to transform the ideas into a good language and present it to the reader.
The students are expected to get practice as good as theory of writing and mind mapping. Teacher has to be a facilitator who can support and develop the writing ability of all of the students. Mind Mapping technique is one of the innovative learning techniques. The students are invited to be creative with a variety of shapes, colors, and symbols. They will also be easier get and share the ideas creatively. The use of Mind Mapping technique is intended to train them to develop creative ability in writing.
HAPTER III RESEARH METHODS
A. Research Type
This research was conducted with a quasi-experimental research design because researcher is attempting to search the effect of a variable to another variable (Sudjana, 2009: 9). The quasi-experimental study consists of three main characteristics, they are: () the independent variables are manipulated, (2) the control or control all other variables except the independent variable, and (3) the observation or measurement of the dependent variable as the effect of independent variables (Sudaryanto 2009: 9).
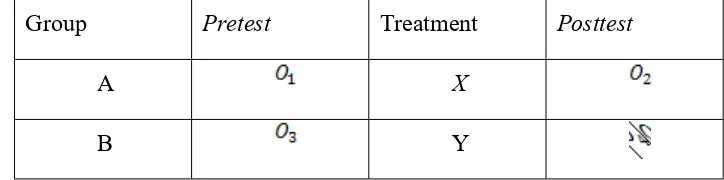
The research design chosen by the researcher is a quasi-experimental research design which is divided into two types of designs; they are time series design and nonequivalent control group. This study uses a nonequivalent control group. Here is a design pattern nonequivalent control group.
Table 2: onequivalent Control Group Design
Group retest Treatment osttest
A X
B. Research Variable
According to Sudaryanto (2000: 72), variables are traits or characteristics of individuals that are in a group or community. Arikunto (2006: 8) states that the variable is the object of study, or what is the point of a study.
Based on Sudaryanto (2000: 74) in experimental research, the variable is divided into two kinds, they are the independent variable and the dependent variable. The independent variable in a position apart from the influence of the dependent variable, while the dependent variable is the variable that is affected by the independent variable. In this study, the independent variable is mind mapping learning, while the dependent variable is student’s writing.
. Population and Sample
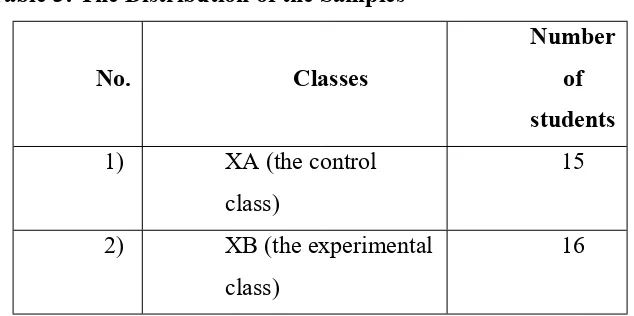
The population in this study was taken from ten grade students of SMA Tiga Maret Yogyakarta academic year of 204/205. All students are divided into two classes, namely XA with 5 students and XB with 6 students.
1) Sample
researcher chose a control and experiment class based on the available classes of the tenth grade students of SMA Tiga Maret Yogyakarta.
The tenth grade students of SMA Tiga Maret Yogyakarta in the academic year of 204/205 have the same chance to be the subjects of this study. The researcher consulted to the English teacher about student’s heterogeneity in ability, difficulties and needs of the tenth grade students. Based on the
consultation, it was known that the students of class A and class B tended to have same ability, difficulties and needs in the learning process. Finally, the researcher chose the class randomly to determine which class will be the experimental class and which class will be the control glass. As a result, class A became the control class and class B became the experimental class. The distribution of the sample is presented in Table 3:
Table 3:The Distribution of the Samples
No. lasses
2) XB (the experimental class)
D. Time and Place
This research was held from st – 20th June 205 at SMA Tiga Maret
Yogyakarta which is located in Gejayan, Yogyakarta.
E. Research Design
The research design of this study is pretest-posttest control group design. The researcher prepared two groups: the control group and the experimental group. The determination of these two groups was using simple random sampling technique. The researcher determined the control group and the experimental group was using lottery.
After determining the sample, the researchers prepared the materials and instruments that would be used to teach. Then the researcher made a pretest to both the control group and the experimental group. A pretest was held in order to determine the initial results of writing ability of the control group and the experimental group before treatment. A pretest was also made to equalize between the control group and the experimental group. This is done because both groups must be set off from the same state
did not use mind mapping, whereas treatment in the experimental class was using mind mapping.
After the groups received treatment, the next step was providing same posttest to both groups. Giving posttest of writing skills was aimed to look at the differences in learning outcomes after both groups were treated. In this process, it is known whether the experimental group experienced a greater improvement and significance from the control group.
F. Research Instrument
The research instrument is a tool used to collect data in research. The instruments used in this study were a pretest in the first meeting and a posttest in the last meeting. These were used to measure or to know the score of writing ability of students. The test was constructed based on the course outline of the tenth grade in curriculum. The researcher also observed course book that used by the teacher as a reference.
G. The Validity and the Reliability of the Researcher Instrument
1) The Validity of the Research Instrument
these instruments have reflected the results. The test was constructed based on the course outline of the tenth grade SMA curriculum. The validity that was applied in the writing test was content and constructs validity.
2) Reliability of the Research Instrument
Johnson and Christensen (2008: 44) state that reliability refers to the consistency or stability of the test scores. After that, researcher used inter-rater
reliability to measure the reliability of the instrument. To obtain inter-rater
reliability, researcher used correlation coefficient among two raters (Interclass Correlation Coefficient). Inter-rater reliability is the degree of agreement between two or more raters or scorers, (Johnson and Christensen, 2008: 50).
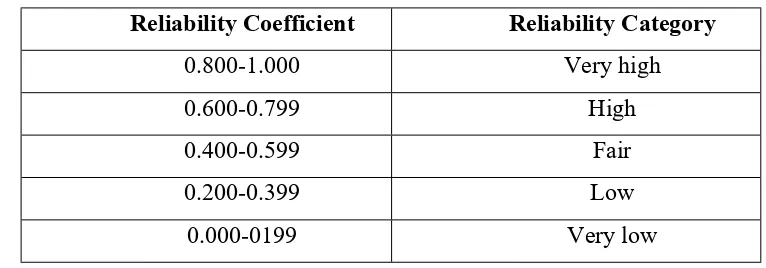
Table 4: Value of the Reliability oefficient (Suharto, 2006: 84)
Reliability oefficient Reliability ategory
0.800-.000 Very high 0.600-0.799 High 0.400-0.599 Fair 0.200-0.399 Low
0.000-099 Very low
H. Data ollection Procedure
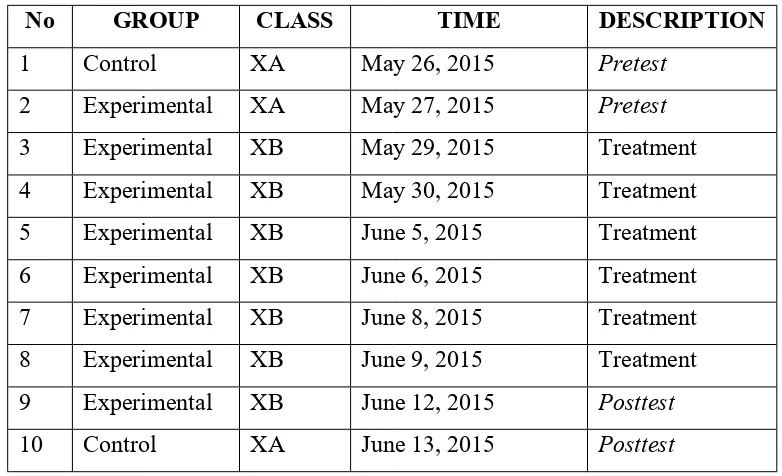
and posttest conducted after the treatment. Each meeting had sixty minutes duration. Table 5 is the schedule of the pretest, treatment, and posttest.
Table 5: Data ollecting Schedule
No GROUP LASS TIME DESRIPTION
Control XA May 26, 205 retest
2 Experimental XA May 27, 205 retest
3 Experimental XB May 29, 205 Treatment 4 Experimental XB May 30, 205 Treatment 5 Experimental XB June 5, 205 Treatment 6 Experimental XB June 6, 205 Treatment 7 Experimental XB June 8, 205 Treatment 8 Experimental XB June 9, 205 Treatment 9 Experimental XB June 2, 205 osttest
0 Control XA June 3, 205 osttest
I. Data Analysis Technique
a. Descriptive analysis.
1) Mean and Standard Deviation
Hatch and Farhady (982: 55) state that mean is commonly used measurement of central tendency because the mean takes all score into account. The mean is same as average of score.
Hatch and Farhady (982: 57) state that standard deviation is used to measure variability. The larger the standard deviation, the more variability from the central point in the distribution and the smaller the standard deviation, the closer the distribution is to the central point.
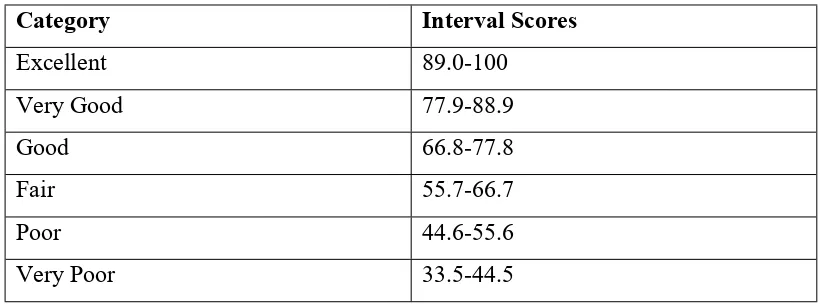
2) ategorization
Data categorization was based on the ideal mean as an ideal benchmark and standard deviation, which are then grouped into sic categories, while the distance determination uses the standard deviation within 6 standard deviation.
To calculate the ideal average (Mi) used the formula: Mi = ½ (the highest ideals + the lowest ideals)
While the ideal standard deviation (SDi) is calculated using formula: SDi = /6 (the highest ideals - the lowest ideals)
Table 6: Guidelines for Providing Interpretation of Research Variables
ategory Interval Scores
Excellent 89.0-00 Very Good 77.9-88.9 Good 66.8-77.8 Fair 55.7-66.7 Poor 44.6-55.6 Very Poor 33.5-44.5
b. Inferential Analysis
1) Test of Normality
Test of normality aims to determine whether the distribution of responses has a normal distribution or not. Test of normality was using Kolmogorov Smirnov
formula.
The interpretation of the test of normality can be concluded as follows: (a)If the value of Asymp. Sig. (2-tailed) is greater than the rate of 5% Alpha
(Asymp. Sig. (2-tailed)> 0.05) it can be concluded that the data derived from populations that are normally distributed.
2) Test of Homogeneity
Test of homogeneity aims to determine whether the sample taken from the population have the same variance or do not show any significant differences from each other. Interpretation of the results of the homogeneity test is by looking at the value of Sig. (2-tailed).
The interpretation can be concluded as follows:
(a) If the significance is less than 0.05 (Sig. (2-tailed) <0.05), the variants differ significantly (not homogeneous).
(b) If the significance is greater than 0.05 (Sig. (2-tailed)> 0.05), the variants are significantly similar (homogeneous).
3) Test of Hypothesis
To analyze the data of pretest and the data of posttest scores, the researcher employed ANCOVA (analysis of covariance). The purposes of this test are: . To increase the precision of comparisons between groups by accounting to
variation on important prognostic variables;
2. To "adjust" comparisons between groups for imbalances in important prognostic variables between these groups.
HAPTER IV
RESEARH FINDING AND DISUSSIONS
This study aims to determine the difference between the grade tenth students of SMA Tiga Maret Yogyakarta taught by using a mind mapping technique and those who are taught by using a conventional technique. In addition, this study also aims to determine the effectiveness of mind mapping in writing class. The data in this study include the initial score data (pretest) and the final score data (posttest).
A. Descriptive Analysis
1. ontrol lass
a. Pretest
The control class is the class taught without using mind mapping. A pretest was conducted to determine the results of the writing test. Subjects in the control group pretest are 5 students. From the results of the pretest, data showed the highest score achieved by students is 75 and the lowest score is 45.
Tabel 7: Frequency Distribution of the Pre-test Scores on Students’ Writing Ability of the ontrol class
o Interval F %
1 34-47.2 2 13.3
2 47.3-60.5 7 46.7 3 60.6-73.8 5 33.3
4 73.9-87.1 1 6.7
5 87.2-100 0 0
TOTAL 15 100
Based on Table 7, it is known that there are 2 students who have score 34-47.2, 7 students who have score 47.3-60.5, 5 students who have score 60.6-73.8, student who got a score 73.9-87 and 0 students who score 87.2-00.
From the statistical data, the category of a pretest scores of control class are divided into four categories, namely excellent, good, poor, and very poor.
Table 8: Frequency Distribution of the Pre-test Scores on Students’ Writing Ability of the ontrol class
Table 8 shows that there was no student (0 %) classified into an excellent category. There were 4 students (27%) in a good category, 8 students (53%) in a poor category, and 3 students (20%) in a very poor category. It can be concluded that the majority of the students belonged to a poor category in the pre-test.
b. Posttest
A posttest of the control class aims to look at outcomes of learning of writing without using mind mapping. From the results of the posttest, the data showed the highest score achieved by students is 75 and the lowest score is 37.5.
By using SPSS, it is known that the average score (mean) achieved by students in the control group posttest is 55.7; mode is 49; median is 52.5; and the standard deviation is .768. The frequency distribution of posttest scores of writing skills with the control group are shown in Table 9 below.
Tabel 9: Frequency Distribution of the Posttest Scores on Students’ Writing Ability of the ontrol class
o Interval F %
1 34-47.2 3 20
2 47.3-60.5 6 40
3 60.6-73.8 5 33.3
4 73.9-87.1 1 6.7
5 87.2-100 0 0
Based on Table 9, it is known that there are 3 students who have score 34-47.2, 6 students who have score 47.3-60.5, 5 students who have score 60.6-73.8, student who got a score 73.9-87 and 0 students who score 87.2-00. From the statistical data, the categories of control group pretest are divided into four categories, namely excellent, good, poor, and very poor.
Table 10: Frequency Distribution of the Posttest Scores on Students’ Writing Ability of the ontrol class
no interval Category F % 1 X ≤ 50.5 Very poor 6 40 2 50.5 ≤ X < 67 Poor 6 40 3 67 ≤ X ≤ 83.5 Good 3 20 4 X ≤ 83.5 excellent 0 0
Table 0 shows that there was no student (0 %) classified into an excellent category. There were 3 students (20%) in a good category, 6 students (40%) in a poor category, and 6 students (40%) in a very poor category. It can be concluded that the majority of the students belonged to a very poor category in the posttest.
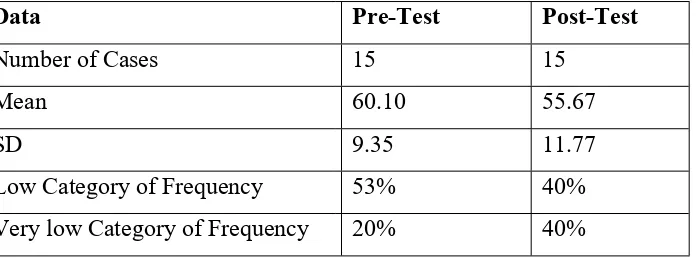
c. omparison between the Pre-Test and Post-Test Scores of the ontrol lass
score. Besides the improvement of the mean value, there was an improvement of the scoring categorization from poor to good category. It means that the writing ability of the control class improved slightly after being treated using traditional technique.
Table 11: Statistical Data of the Pre-Test and Post-Test Scores of the ontrol lass
Data Pre-Test Post-Test
Number of Cases 5 5 Mean 60.0 55.67
SD 9.35 .77
Low Category of Frequency 53% 40% Very low Category of Frequency 20% 40%
In addition, the standard deviation (SD) for the pre-test was 9.35 while the post-test was .77. Thus, the SD of the post-test is higher than that of the pre-test. Then, it can be interpreted that the students’ writing ability of the control class based on the pre-test and post-test scores was homogenous.
2. Experimental group a. Pretest
Tabel 12: Frequency Distribution of the Pre-test Scores on Students’ Writing Ability of the ontrol class
o Interval F %
1 34-47.2 7 43.75
2 47.3-60.5 5 31.25
3 60.6-73.8 4 25
4 73.9-87.1 0 0
5 87.2-100 0 0
TOTAL 16 100
Table 13:Frequency Distribution of the Pre-test Scores on Students’ Writing Ability of the experimental class
no interval Category F % 1 X ≤ 50.5 Very poor 9 56 2 50.5 ≤ X < 67 Poor 6 38 3 67 ≤ X ≤ 83.5 Good 1 6 4 X ≤ 83.5 excellent 0 0
Table 3 shows that there was no student (0 %) classified into an excellent category. There was student (6 %) in a good category, 6 students (38 %) in a poor category, and 9 students (56 %) in a very poor category. It can be concluded that the majority of the students belonged to a very poor category in the experimental group pre-test.
b. Experimental group posttest
A posttest of experimental class aims to determine the result of student learning ability after treatment. From the posttest, data showed the highest score achieved by students is 67 and the lowest score is 34.5.
Tabel 14: Frequency Distribution of the Post-test Scores on Students’ Writing Ability of the Experimental lass
o Interval F %
1 34-47.2 10 62.5
2 47.3-60.5 5 31.25 3 60.6-73.8 1 6.25
4 73.9-87.1 0 0
5 87.2-100 0 0
TOTAL 16 100
Based on Table 4, it is known that there are 0 students who have score 34-47.2, 5 students who have score 47.3-60.5, student who has score 60.6-73.8, 0 students who has score 73.9-87, and 0 students who have score 87.2-00.
From the statistical data, the categories of experimental class posttest are divided into four categories, namely excellent, good, poor, and very poor.
Table 15: Frequency Distribution of the Posttest Scores on Students’ Writing Ability of the experimental class
Table 5 shows that there was no student (0 %) classified into an excellent category. There was student (6.25%) in a good category, 4 students (25%) in a poor category, and students (68.75 %) in a very poor category. The conclusion is that the majority of the students belonged to a very poor category in the posttest.
c. omparison between the Pre-Test and Post Scores of the Experimental lass
Table 16: Statistical Data of the Pre-Test and Post-Test Scores of the Experimental lass
Data Pre-Test Post-Test
Number of Cases 6 6 Mean 5.3 45.9 SD 0.8 0.04 Low Category of Frequency 38 % 25% Very low Category of
Frequency
56 % 68.75 %
B. Inferential Analysis
1. Pre-testing Analysis
2. Normality Test
The normality test was conducted on the data that obtained from the pretest and posttest, both the control group and the experimental group. Data is said to be normally distributed if the p value obtained from the calculation is greater than 0.05. The result of the normality test is presented as follows.
Table 17: The Normality Test of the Students’ Writing Test in the Pre-Test and Post-Test for both Experimental and ontrol lass.
c p Values α Statement
Writing Test (Pre-test Experimental) 0.77 0.05 Test distribution is normal Writing Test (Post-test Experimental) 0.844 0.05 Test distribution is normal Writing Test (Pre-test Control) 0.993 0.05 Test distribution is normal Writing Test (Post-test Control) 0.933 0.05 Test distribution is normal
The normality test results are known that Asymp value. Sig. (2-tailed) is greater than 0.05 (5%), so it can be concluded that the distribution of the data of pretest and the data of the posttest both experimental and control groups are normal.
3. Homogeneity Test
The homogeneity test is done after the normality test. Data is said to be homogeneous if the significance value is greater than 0.05 (significance level).
able 18: est of Homogeneity of Variances
retest
Levene Statistic df1 df2 Sig.
1.206 1 29 .281
Table 8 shows that the value of p (Sig.) of the pre-test (0.28) was greater than 0.05. It means that the sample variance was homogeneous.
4. Hypothesis Testing
The hypothesis testing is aimed to reveal whether there is significant difference between students’ writing skills taught using mind mapping and those taught not using mind mapping. Firstly, the hypothesis must be changed to the null hypothesis (Ho) before the hypothesis was rejected or accepted. Therefore,
the null hypothesis (H0) is “There is no significant difference between students’
writing skills taught using mind mapping and those taught not using mind mapping”.
In this case, the researcher used SPSS for windows computer program. The data were gained by employing ANCOVA. It was applied because there were two variables in this research and the scores for both pre-test-and post-test and the mean score were different. Theoretically, the hypothesis is accepted if the value of the significant level is lower than 0.05.
Between-Subjects Factors
Squares df Mean Square F Sig.
Corrected Model 3221.833a 2 1610.917 42.151 .000
Intercet 1.345 1 1.345 .035 .853
retest 2371.669 1 2371.669 62.056 .000
treatment 28.884 1 28.884 .756 .392
Error 1070.102 28 38.218
Total 82594.000 31
Corrected Total 4291.935 30
a. R Squared = .751 (Adjusted R Squared = .733)
From the Table above, it can be seen that the Sign. (2-tailed) reveals the significance point 0.392. There was no significant effect of writing ability in the post-test. The value of Sig. (2-tailed) was greater than significant level (0.392 > 0.05), then Ho was accepted. It means “There is no significant difference between
. Discussion
Writing is a complex and difficult activity. It needs more effort to study about writing. Regarding to the research which was done in SMA Tiga Maret Yogyakarta, it was considered that there is no significant difference between students’ writing skills taught using mind mapping and those taught not using mind mapping. Based on the computation of the post-test result, the mean score of experimental class on their writing ability was 45.9 while that of the control class was 55.67. It can be interpreted that the mean score of the control group taught using a conventional or traditional technique was higher than that of the experimental class taught using mind mapping.
There are some factors that make mind mapping not useful for the students of SMA Tiga Maret as follow.
. The students are not interested to writing. As they mind mapped, they only attracted to draw the map.
2. The student’s ability to exchange their ideas into a text is so limited. The students are lack of vocabulary, grammar, and not motivated.
3. The researcher had no more time to do research. The limited time given by school is not enough to develop the ability of students.
It has been discussed in Chapter II that mind mapping is a creative note taking technique in a visualization and graphic forms that is used to make people find it easy to enter information into their brains, keeping information in a long term memory and taking it out from their brains easily by engaging imagination and association (Buzan 2006: 6; Buzan 2008: 0). Mind mapping can attract the student’s eagerness to start the writing and developing their ideas.
HAPTER V
ONLUSION, IMPLIATION, AND SUGGESTION
A. onclusions
Based on the results of the research and discussion that has been presented in the previous chapter, it can be concluded that there is no significant differences in learning outcomes of the students who learned writing through mind mapping with the students who took the learning without mind mapping. Learning outcomes of mind mapping are shown by the results of ANCOVA of experimental group posttest and control group. The value of Sig. (2-tailed) was greater than significant level (0.392 > 0.05), then Ho was accepted. It means “There is no significant difference between student’s writing skills taught using mind mapping and those taught not using mind mapping”. This shows that mind mapping is not effective to be used in teaching writing for X students of SMA Tiga Maret Yogyakarta.
B. Implication
ideas and enhance student's skills in developing language skills; it can be seen from the good results of mind mapping of the students. In fact, it is difficult for the students to change their ideas (mind mapping) into a text. The use of mind mapping in the learning process requires active participation of the teacher and the students so that mind mapping can be maximized to improve writing skills and the student’s activity in writing. Therefore, mind mapping can be applied in SMA Tiga Maret but it requires an additional technique or media to improve student’s writing skills.
. Suggestion
Based on the conclusion and the implication of the research, the researcher suggests for the following parties: the teachers, the students, and other researchers.
. English Teachers
2. The students of English Language Education Department
The students of English Education Department have to develop the use of mind mapping as a teaching technique in teaching writing. In order mind mapping can be more effective and efficient technique in writing.
3. Other Researchers
REFERENES
Arikunto, S. 2002. rosedur enelitian. Jakarta: PT Rineka Cipta.
Azwar, Saiffudin. (200). enyusunan Skala sikologi. Yogyakarta: Pustaka Pelajar.
Badan Standar Nasional Pendidikan (BSNP). (2006). Standar Kompetensi dan
Kompetensi Dasar SMA/MA. Jakarta: Depdikbud.
Brown, H, Douglas. 200. Teaching by rinciples, an Interactive Approach to
Language edagogy. New York: Addison Wesley Longman.
Brown, H. Douglas. 2004. How to Teach Writing. England: Pearson Education Limited.
Buzan, T. (2005). Buku intar Mind Map. Jakarta: Gramedia.
_______. (2006). How to Mind Map: Mind Map untuk Meningkatkan Kreativitas. Jakarta: PT Gramedia Pustaka Utama.
_______. (2008). Buku intar Mind Map untuk Anak:Agar Anak Mudah
Menghafal dan Berkonsentrasi. Jakarta: PT Gramedia Pustaka Utama.
.
Edward, Caroline. 2009. Mind Mapping untuk Anak Sehat dan Cerdas. Yogyakarta: Sakti.
Feez, S. and Joyce, H. (2002). Text-Based Syllabus Design. Sydney: Macquarie University.
Harmer, Jeremy. 2004. How to Teach Writing. New York: Pearson Education Limited. Longman.
Hatch, E. and Farhady, H. (982) Research Design and Statistics for Applied
Linguistics. Rowley, Mass.: Newbury House.
Johnson, R. B. & Christensen, L. B. (2008) Educational research: Quantitative,
Nunan, David. (2003). ractical English Language Teaching. New York: The McGraw-Hill Companies, Inc.
Oshima, A and Hogue, A. 2006. Writing academic English 4th Edition.Harlow:
Pearson Education.
Permendiknas no. 22, year 2006 Departemen Pendidikan Nasional. 2006.
Kurikulum SM Mata elajaran Bahasa Inggris
Richards, Jack C. and Renandya, Willy A. 2002. Methodology in Language
Teaching: An Anthologyof Current ractice. Cambridge: Cambridge
University press
Spratt, M., Pulverness, A. and Williams, M. 2005. The Teaching Knowledge Test
Course. Cambridge: Cambridge University Press.
Sudaryanto. 2003. Metode enelitian. Yogyakarta: Pustaka Pelajar.
Sudjana. (2009).enelitian dan enilaian endidikan. Bandung: Sinar Baru Algesindo.
APPENDIX 1
A. PRE-TEST Name :
Class :
Try to remember anything that you like or you know well. It could be a folk tale, a legend, or your own experience. Write down your story at least 2 paragraph which consist of 250 words. Use your own words.
B. POST-TEST Name :
Class :
Now write anything that you like or you know well. Write down at least 2 paragraphs which consist of 250 words. Use your own words.
APPENDIX 2
VALIDITY AND RELIABILITY OF
A. VALIDITY OF THE INSTRUMENTS
Validity of pretest of the control group
Correlations
rater1_pretest_c ontrolclass
rater2_pretest_c ontrolclass
rater1_pretest_controlclass Pearson Correlation 1 .837**
Sig. (2-tailed) .000
N 15 15
rater2_pretest_controlclass Pearson Correlation .837** 1
Sig. (2-tailed) .000
N 15 15
**. Correlation is significant at the 0.01 level (2-tailed).
Validity of posttest of the control group
rater1_posttest_controlclass Pearson Correlation 1 .928**
Sig. (2-tailed) .000
N 15 15
rater2_posttest_controlclass Pearson Correlation .928** 1
Sig. (2-tailed) .000
N 15 15
Validity of pretest of the experimental group
rater1_pretest_expclass Pearson Correlation 1 .903**
Sig. (2-tailed) .000
N 16 16
rater2_pretest_expclass Pearson Correlation .903** 1
Sig. (2-tailed) .000
N 16 16
**. Correlation is significant at the 0.01 level (2-tailed).
Validity of posttest of the experimental group
Correlations
rater1_posttest_ expclass
rater2_posttest_ expclass
rater1_posttest_expclass Pearson Correlation 1 .888**
Sig. (2-tailed) .000
N 16 16
rater2_posttest_expclass Pearson Correlation .888** 1
Sig. (2-tailed) .000
N 16 16
ASSESSMENT RUBRIC FOR WRITING
SCORE
LEVEL CRITERIA
CONTENT
30-27
EXCELLENT TO VERY GOOD:knowledgeable, substantive, thorough development of thesis, relevant to
assign topic.
26-22
GOOD TO AVERAGE: some knowledge of subject, adequate range, limited development of thesis, mostly
relevant to topic, but lacks detail.
21-17 FAIR TO POOR: limited knowledge of subject, little substance, inadequate of development of topic.
16-13 VERY POOR: does not show knowledge of subject, non – substantive, not pertinent, or not enough to evaluate.
ORGANIZATION
20-18
EXCELLENT TO VERY GOOD: fluent expression, ideas clearly stated/supported, succinct, well-organized, logical
sequencing, cohesive.
17-14
GOOD TO AVERAGE: somewhat choppy, loosely organized but main ideas stand out, limited support, logical
but incomplete sequencing.
13-10 FAIR TO POOR: non- fluent, ideas confused or disconnected, lacks logical sequencing and development.
9-7 VERY POOR: does not communicate, no organization, not enough to evaluate.
VOCABULARY
20-18
EXCELLENT TO VERY GOOD: sophisticated range, effective word/idiom choice and usage, word form mastery,
appropriate register.
17-14
GOOD TO AVERAGE: adequate range, occasional errors of word/idiom form, choice, usage but meaning not
obscured.
13-10 FAIR TO POOR: limited range, frequent errors of word/idiom, choice, usage, meaning confused or obscured.
LANGUAGE USE
25-22
EXCELLENT TO VERY GOOD: effective complex construction, few errors of agreement, tense, number, word
order/function, article, pronouns, preposition.
21-18
GOOD TO AVERAGE: effective but simple construction, minor problems in complex construction, several errors of
agreement, , tense, number, word order/function, article,
pronouns, preposition but meaning seldom obscured.
17-11
FAIR TO POOR: major problem in simple/ complex construction, frequent errors of negation, agreement, tense,
number, word order/function, article, pronouns, preposition
and/or fragment, run-ons, deletions, meaning confused or
obscured.
10-5
VERY POOR: virtually no mastery of sentence construction rules, dominated by errors, does not
communicate, or not enough to evaluate.
MECHANICS
5
EXCELLENT TO VERY GOOD: demonstrated mastery of convention, few errors of spelling, punctuation,
capitalization, paragraphing.
4
GOOD TO AVERAGE: occasional errors of spelling, punctuation, capitalization, paragraphing but meaning
obscured.
3
FAIR TO POOR: frequent errors of spelling, punctuation, capitalization, paragraphing, poor handwriting, meaning
confused or obscured.
2
VERY POOR: no mastery of conventions, dominated by errors of spelling, punctuation, capitalization, paragraphing,
B. RELIABILITY OF THE INSTRUMENT
INTER RATER RELIABILITY
Case Processing Summary
N %
Cases Valid 31 100.0
Excludeda 0 .0
Total 31 100.0
a. Listwise deletion based on all variables in the procedure.
Reliability Statistics
Cronbach's Alpha
Cronbach's Alpha Based on
Standardized
Items N of Items
PERHITUNGAN KELAS INTERVAL
1. PRETEST KELAS KONTROL
1 nmax 75.00 2 nmin 45.00 3 mean 60.10 4 modus 61.5 5 median 61.00 6 std dev 9.35 KI RD F
1 34-47.2 2 2 47.3-60.5 7 3 60.6-73.8 5 4 73.9-87.1 1 5 87.2-100 0 no interval kriteria %
1 X ≤ 0.5 sangat rendah 20
2 50. ≤ X < rendah 53
3 ≤ X ≤ 3.5 tinggi 27
Chart 1: Frequency Distribution of the Pre-test Scores on Students’ Writing Ability of the Control class
0 1 2 3 4 5 6 7 8
34-47.2 47.3-60.5 60.6-73.8 73.9-87.1 87.2-100
2. POSTEST KELAS KONTROL
1 nmax 75.00 2 nmin 37.50 3 mean 55.67 4 modus 49 5 median 52.50 6 std dev 11.76 KI RD F
1 34-47.2 3 2 47.3-60.5 6 3 60.6-73.8 5 4 73.9-87.1 1 5 87.2-100 0
no interval kriteria F % 1 X ≤ 0.5 sangat rendah 6 40
2 50. ≤ X < rendah 6 40
3 ≤ X ≤ 3.5 tinggi 3 20
Chart 2: Frequency Distribution of the Pre-test Scores on Students’ Writing Ability of the Control class
0 1 2 3 4 5 6 7 8
34-47.2 47.3-60.5 60.6-73.8 73.9-87.1 87.2-100
3. PRETEST KELAS EKSPERIMENTAL
1 nmax 72.50 2 nmin 40.00 3 mean 51.13 4 modus 43 5 median 48.00 6 std dev 10.18 KI RD F
1 34-47.2 7 2 47.3-60.5 5 3 60.6-73.8 4 4 73.9-87.1 0 5 87.2-100 0
no interval kriteria F %
1 X ≤ 0.5 sangat rendah 9 56
2 50. ≤ X < rendah 6 38
3 ≤ X ≤ 3.5 tinggi 1 6
Chart 3: Frequency Distribution of the Pre-test Scores on Students’ Writing Ability of the Control class
0 1 2 3 4 5 6 7 8
34-47.2 47.3-60.5 60.6-73.8 73.9-87.1 87.2-100
4. POSTEST KELAS EKSPERIMENTAL
1 nmax 67.00 2 nmin 34.50 3 mean 45.19 4 modus 36 5 median 43.75 6 std dev 10.04 KI RD F
1 34-47.2 10 2 47.3-60.5 5 3 60.6-73.8 1 4 73.9-87.1 0 5 87.2-100 0
no interval kriteria F %
1 X ≤ 0.5 sangat rendah 11 69
2 50. ≤ X < rendah 4 25
3 ≤ X ≤ 3.5 tinggi 1 6
Chart 4: Frequency Distribution of the Pre-test Scores on Students’ Writing Ability of the Control class
0 2 4 6 8 10 12
34-47.2 47.3-60.5 60.6-73.8 73.9-87.1 87,2-100
APPENDIX 3
STATISTICAL ANALYSIS OF THE
DATA ANALYSIS A. Descriptive Analysis
1. Normality Test
2. Homogeneity Test
pretest
Levene Statistic df1 df2 Sig.