Optimizing Microbial Protein Synthesis in
the Rumen through Supplementation w ith
Vitamin and Mineral in Ration Based on
King Grass to increase Bali Cattle
Productivity
By
Ida Bagus Gaga Part ama, I. Gust i Lanang Oka Cakra,
and A.A. Ayu Trisnadewi
I SSN 0970- 4973 ( Print)
I SSN 2319- 3077 ( Online/ Electronic)
I ndex Copernicus I nternational Value
I C Value of Journal 4.21 ( Poland, Europe) ( 2012) Global I mpact factor of Journal: 0.587 ( 2012) Scientific Journals I mpact Factor: 2.597
J. Biol. Chem. Research
Volume 31 ( 2) 2014 Pages No. 822- 840
Journal of
Biological and
Chemical Research
( An I nternational Journal of Life Sciences and Chemist ry)
Indexed, Abstracted and Cited: Index Copernicus International (Europe), Universal Impact Factor, Polish M inistry of Science and Higher Education (Poland, Europe) Scientific Journals Impact Fact or M ast er List, Research Bible (Japan), Directory of Research Journals Indexing (DRJI),Indian Science. In, Dat abase Electronic Journals Library (Germany), Open J-Gate, Google Scholar, CAS, J Gate e-Journal Portal, Info Base Index, International Impact Fact or Services (IIFS) (Singapore) International Institute of Organized Research (I2OR) and Eye Source.
( An I nternational Journal of Life Sciences and Chemistry)
Ms 31/ 1/ 114/ 2014, All right s reserved I SSN 09 70 -4973 ( Print)
I SSN 23 19 -3077 ( Online/ Electronic)
Dr. I.B. Gaga Partama
http:/ / w w w .jbcr.in jbiolchemres@ gmail.com
RESEARCH PAPER Received: 05/ 03/ 2014 Revised: 28/ 05/ 2014 Accepted: 12/ 06/ 2014
Optimizing Microbial Protein Synthesis in the
Rumen through Supplementation w ith Vitamin
and Mineral in Rat ion Based on King Grass to
increase Bali Cattle Productivity
Ida Bagus Gaga Part ama, I. Gust i Lanang Oka Cakra,
and A.A. Ayu Trisnadewi
Faculty of Animal Husbandry, Udayana University, Denpasar-Bali, Indonesia
ABSTRACT
Bali cattle have a great potency to supply National meet demand w hich increase progressively every yea r. The main constrain in Bali cattle farming is the deficiency in trace minerals on native grass resulting in low Bali cattle productivity. The present study w as done to determine the effect of vitamin-mineral supplementation in the ration based on king grass on rumen microbial protein synthesis and its relation to productivity of Bali cattle steer. Randomized Complete Block Design was used in this study consisted of four treat ments and five groups based on differences in live w eight cattle. Treatment consisting of four treatments and five groups based on differences in live w eight of cattle. Treatments consist of: S0 = concentrat e as much as 5 kg + king grass given ad libitum, S1, S2, and S3 = S0 successively added 0.1%, 0.2% and 0.3% vitamin-mineral in concentrate. Variables observed w ere intake and ration digestibility, product of rumen fermentation, deposition of nutrients, microbial protein synthesis in the rumen, live w eight gain of the a nimals, and feed efficiencies. The data obtained w ere analyzed by variance, and regression analysis used to predict the optimal level of supplementation. Results show ed that vitamin-mineral supplementation has significant ly (P <0.05) effect to most of the observed variables, except the coefficient of rations digestibilit y. Supplementation levels of 0.2 to 0.3% can reduce the consum ption of nutrients, but supplementation levels of 0.1% can increase concentration of propionat e acid up t o 37%, 12% ret ention of energy, efficient use of the ration 16%, microbial protein synthesis 15%, reduce methane emissions of up to 18%, a nd can increase live w eight gain of Bali cattle steer up to 14% (0.58 vs. 0.66 kg/ day) than cattle w ithout supplements. The research concluded that vitamin-mineral supplementation 0.1 to 0.3% in ration based on king grass can increase microbial protein synthesis in t he rumen and live w eigh gain of Bali cattle steer, and there is a clear relationship bet ween microbial protein synthesis (X) w ith live w eight gain of cattle (Y) w hich follow s the equation: Y = 0.002X - 0.002, R2 = 0.73 Keyw ords: Bali Cattle, M icrobial Protein, Supplementation and Vitamin-M ineral.
INTRODUCTION
Bali cat tle are considered as Indonesian native germ plasm a t hat should be preserved and developed optim ally in order t o im prove t he welfare of societ y and t he nat ion of Indonesia. Approxim at ely 55% farmers in m ost part s of Indonesia raise t his breed of cat t le because t hey are easily maint ained and have m any advant ages. Bali cat t le breeding has significant ly cont ribut ed t o increasing farm ers' incom e breeders and accept ance (PAD), as w ell as t he beef supply in order t o fulfill dom est ic needs (Direkt orat Perbibit an, Dir. Jen Pet ernakan Dept an and PSP3-IPB, 2005).
Bali cat tle belong t o ruminant s w hich have rum en. Rum en microbes as biological machines in rum inant s have a large role on t he product ivit y of livest ock. Rumen is com posed of a number of bact eria, protozoa and fungi cont ained in t he ruminant rum en in general and Bali cat t le in particular. One of t he im port ant roles of rum en m icrobes are t he abilit y to digest t he nut rient s cont ained in food such as carbohydrat es, fat s, and prot eins with enzym es produced. Result s from digest ion are utilized by beef cat t le for grow t h and product ion. In addit ion t o exploit ing t he result s of the digest ion of nut rient s by t he anim al, cat t le can also t ake advant age of m icrobial prot ein for grow t h. Num erous st udies have indicat ed t hat rum en m icrobial protein production correlat ed positively w it h t he productivit y of Bali cat tle (Part am a et al., 2007a, Part ama et al., 2007b). This proves t he im port ance of opt imizing bioprocess t o im prove rum en microbial prot ein synt hesis t hat significant ly affect s t he grow t h of cat t le. Opt imizing rum en m icrobial prot ein product ion in Bali cat t le can st ill be im proved t o achieve maxim um grow t h of Bali cat tle. Ways t hat are com monly used are t o provide nut rient cont ent of diet s w it h adequat e and balanced. Adequacy of nut rient s such as prot eins, carbohydrat es, fat s, vit amins and minerals is crucial for rumen microbial prot ein production. However, t he result s show ed t hat the m ineral and vit amin cont ent of animal feed ingredients in the t ropics in general and Indonesia in particular is low (Kaunang, 2004). Therefore, m ineral and vit amin supplement at ion in ruminant rat ions is import ant in enhancing cat tle productivit y. Supplement at ion of vit amins and minerals in t he diet has been shown to increase t he product ivit y of Bali catt le (Part ama et al., 2003; Part am a, 2006). Vit amins and minerals can st imulate productivit y of m icrobial prot ein synthesis and optim izat ion of t he rum en digest ive funct ions of fiber (Wanapati and Somm art , 1992, Part am a et al., 2007a; Part ama et al., 2007b; Ast awa, 2007; Joy, 2008), and high animal productivit y is also a reflect ion of t he high microbial prot ein synthesis (Firkin et al., 2006; M ullik, 2007, Part ama et al, 2007a; Part ama et al., 2007b). Thus, t he success of rumen microbial growt h spurred a great effect on the fulfillment of am ino acids for ruminant s. M ixt ure of m inerals and vit am ins not only supplement ed t o m eet t he needs of m icrobes, but also to m eet t he needs of livest ock. In t his regard, t he research is feasible to det erm ine opt im al m icrobial prot ein synt hesis in relat ion to live w eight increase in fat t ening Bali catt le fed King grass-based rat ions wit h vit am in and m ineral supplem ent ation in concent rat e.
M ATERIAL AND M ETHODS
This st udy consist ed of a series of field and laborat ory experim ent s. Field t rials conduct ed in t he Village Serongga, dist rict of Gianyar, Gianyar regency. Laborat ory t est s w ere conduct ed at t he Lab.
Optimizing……….Productivity Partama et. al., 2014
Nut rit ion and Food Livest ock, Facult y of Animal Husbandry- Udayana Universit y, and Lab. Analytical Udayana Universit y. Experim ent s w ere conduct ed for six months, st art ing from t he preparat ion up to t he observat ion or measurem ent activit ies in the field.
The experim ent w as conduct ed in individual cages. Cage is designed t o m eet t he maint enance requirement s of fatt ening Bali catt le. Tw ent y (20) individual cages w ere required t o accom modat e 20 Bali cat t le st eers w ith an average live w eight of 319 kg or w ith the range of 279-367 kg. Cat tle w ere random ly placed in individual cages w it h a capacit y of one larvae per cage and given rat ion treat m ent according to the experim ent al design used.
Ration m at erials consist of, King grass, concent rates and pignox (com mercial product as a source of vit amins and minerals). The m at erials used t o form ulat e diet s w ith cedar mult i vit am in and mineral supplement at ion differently.
Ration t reat m ent s consist ed of King grass, concent rat es, and pignox (comm ercial product as a source of vit amins and minerals). The m at erials w ere used t o formulat e diet s w ith cedar m ult i vit amin and mineral supplem ent at ion different ly.
Ration t reat ment s consist ed of King grass and concent rat es supplement ed w ith pignox. There w ere four t reat m ent s in concent rat e rat ions for four t reat m ent s, i.e. S0, S1, S2, and S3. Concent rat e on S0 is without adding pignox, w hile concent rat e on the S1, S2, and S3 w ere supplement ed with pignox at 0.1%, 0.2% and 0.3%, respect ively (Table 1).
Provision of rat ions conduct ed t wo tim es a day in t he m orning at 9:00 and lunch at 14.00 pm . Five (5) kg of concent rat e w as given per cat t le per day in t wo times provision in the morning and aft ernoon, as m entioned above. King grass w as given unlimit ed (ad libit um). The concent rat e w as given first and follow ed the King grass on every provision of both morning and aft ernoon. Similarly, w at er w as supplied ad libit um provided separat ely w it h
t he feeding.
Table 1. Nutrient content of the experiment diets.
Nut rient
Concent rat es King grass
S0 S1 S2 S3
Dry mat t er (%) 87,64 87,64 87,64 87,64 24,80
Organic mat t er(%) 64,13 64,13 64,13 64,13 71,84
Crude prot ein (%) 12,13 12,13 12,13 12,13 5,01
Crude fiber (%) 7,76 7,76 7,76 7,76 27,20
Energy (GE, M cal/ kg) 3,22 3,22 3,22 3,22 3,39
Sulfur (S, ppm ) 685,50 694,09 702,68 711,28 -
Zinc (Zn, ppm) 45,09 65,09 85,09 105,09 26,12
Descript ion: S0, S1, S2 and S3 = vit am in-mineral supplem ent ation in concent rat e at 0%, 0.1%, 0.2% and 0.3%, respect ively.
Experimental Design
This research use randomized block design with four t reat m ent s rat ion S0, S1, S2, and S3 and five groups based on the w eight of livest ock. Thus t here w ere 20 m ale Bali cat tle in t his experim ent . One unit w as the first experiment in which m ale Bali cat tle w ere randomly placed in individual cages in accordance w it h the experim ent al design. Diet ary t reat m ent s are: S0 = 5 kg concent rat e + King grass w as given ad libit um; S1 = S0 + 0.1% pignox in concent rat e; S2 = S0 + 0.2% pignox in concent rat e; and S3 = S0 + 0.3% pignox in concent rat e.
Observed Variables
Variables observed w ere dry m at t er int ake (concent rat e and grass) and nut rient s, ration digest ibilit y, rumen fluid pH and amm onia, volatile fat t y acids (VFA), m et hane gas em issions and energy, nit rogen ret ent ion, deposition of nut rient s t hrough the conversion of body com position (Bart le et al., 1983), levels of urinary alllant oin to calculat e rum en microbial prot ein production (Bowen, 2003), cat tle w eight gain, and feed efficiencies (FCR = feed conversion rat io).
Variables M easurement Procedure
Live W eight Gain. Live w eight gain of cat tle w as obt ained by calculating t he difference bet w een t he initial w eight and final w eight . Furt hermore average daily live gain w eight can be det ect ed by dividing the w eight difference wit h t he t im e t rial. Livestock w eight w as m easured every t w o w eeks in t he m orning before t he anim als w ere given food and w at er. Weighing w as done by using elect ronic scales w it h a capacity of 1000 kg w it h accuracy 100 g.
Dry M atter and Nutrient Consumption
Ration dry m at t er consumpt ion w as measured by calculat ing t he difference bet ween t he am ount of rat ion (w eight ) given and the remaining rat ions t hat there w ere not consum ed. St eaming feed int ake is done every day until the experim ent ended. To det erm ine t he nut rient cont ent of rat ions, samples of rat ions were analyzed. Furtherm ore, t he am ount of nut rient s consumed can be det ect ed by using the equation:
Nut rient consumption = t ot al feed int ake x % of dry m at t er x % of nut rient .
Analysis of prot ein samples was done with the M acro-Kjedhal m et hod (AOAC, 1980). Ash cont ent det ermined by burning sam ples in a furnace at a t em perat ure of 600 0C for six hours, while det erm inat ion t he energy cont ent of the sam ples w as carried out using adiabatic bomb calorim et er by analyzing 1 g of sample.
Ration digestibility
Digest ibilit y and nut rient ret ent ion of t he four experim ent al rations can be det ect ed by recording every day for 7-9 days (t ot al collect ion period) to t he number given rat ions,
excret ion of feces and urine. Digest ibilit y and nut rient ret ent ion coefficient can be calculat ed using the formula:
C = (K - F) / K X 100% and RN = K - F - U
By underst anding: C = coefficient of digest ibilit y (%); RN = ret ent ion of nut rient s; K = nut rient s consum ed; F = nut rient s removed t hrough feces and U = nut rient s rem oved t hrough urine.
The Acidity level (pH) Rumen Fluid
Acidit y is m easured using the rumen fluid pH met er Hanna HI 9025 t ype. Rumen fluid sam pling w as done t hree hours aft er t he cat t le w ere fed, using vacuum suct ion throu gh t he mout h as m uch as 10 ml per cat t le. Rumen fluid pH value is know n by looking at t he quant um of pH met ers m onitor screen.
Ammonia of Rumen Fluid
Concent rat ions of N-am monia (NH3-N) of rum en fluid w ere det ermined by m icro-diffusion t echnique of Conw ay (Depart m ent of Dairy Science, 1966). A tot al of 1 ml supernat ant fluid w as placed in one side of t he cup near Conw ay and on the ot her hand is placed one ml of sat urat ed NaOH solut ion. The cent ral part w as placed a cup Conw ay ml boric acid solut ion w ith indicat or. The cup sealed w it h pet roleum jelly assist ance. Supernat ant and t he NaOH solution w ere m ixed evenly and shake t he cup. Ammonia released from t he react ion bet w een t he t wo m at erials will t hen be arrest ed by the boric acid which is shown by color changes. Aft er 24 hours, ammonium borat e w as t it rat ed w it h solution 0.005 N H2SO4 until the color changes t o the original color of boric acid.
N-amm onia concent ration is calculat ed using the formula: N-Am monia = (ml H2SO4 X NH2SO4 X 1000) mM Total VFA Concentration
Tot al VFA concent rat ion analysis was perform ed using St eam Dist illat ion (Depart ment of Dairy Science, 1966). A t ot al of 5 ml of rum en fluid supernat ant sample was int roduct ion into t he dist illat ion tube M arkham heat ed w it h hot w at er boiled in a flask dist illers. Tube w as sealed im mediat ely aft er addition of 1 ml solution of 15% H2SO4 solution. VFA will be driven by hot wat er vapor condensed t hrough cooling tubes and then st ored w it h t he previous erlenm ayer filled w ith 0.5 N NaOH up to 100-300 ml. Then 2-3 drops of indicat or w ere added t o the next fenolpalin perform ed t it rat ion w it h 0.5 N HCl. Tit ration is t erm inat ed at t he t im e t he st art ing point of a pink color change becam e clear. Blank t it rat ion w as also perform ed on 5 m l of NaOH. Tot al VFA concent rat ion w as calculat ed using the follow ing form ula:
Tot al VFA = (bs) X NHCl X 1000 / 5 m M By underst anding:
s = Volum e of t it rant sam ple (ml) b = Volume of tit rant blank (ml) N = Norm alit y of HCl solut ion
Individual VFA Concentration
Analysis of individual VFA levels was conduct ed by gas chromat ography t echnique. Rum en fluid was im mediat ely disent rifuged at a speed 10.000 rpm for 15 minut es at a t em perat ure of 4 º C t o obt ain supernat ant s. A total of 2 ml supernat ant was t aken w ith a pipet t e t o be insert ed into a sm all plastic t ube and t hen closed. Int o these t ubes 30 m g 5 sulphosalicylic acid (C6H3 (OH) SO32H2O), w as added, then whipped and then w ere cent rifuged (3000 rpm for 10 minut es at a t emperat ure of 4 º C), t hen filt ered w it h melipori in order t o obt ain clear liquid. A tot al of 1 ml of fluid w as inject ed into the gas chrom atography; st andard solut ion of VFA w as first ly inject ed.
Concent rat ions of individual VFA (cM ) in rumen fluid samples can be calculat ed using t he following formula:
(cM ) = (High Sam ple/ High St andard) x St andard Concent ration
M et hane gas emissions (M ) can be calculat ed using t he form ula: M = 0.5 A - 0.25 P + 0.5 B w ith the underst anding M = M et hane gas, A = Acet ic acid, P = propionat e acid, and B = but yric acid. M et hane energy value (M cal) = 0.2108 x mol M et hane.
Body Composition
Body composition w as m easured using a t echnique of Urea (Urea Space) according to the met hod of Bartle et al. (1983). This measurem ent w as done once, at t he end of t he experim ent . M easurem ent procedure w as as follow s: Blood samples (10 ml) were t aken from t he jugular vein. Then 20% urea as m uch as 0.65 cc w as inject ed into the circulat ion of blood through the jugular vein. Aft er 12 minut es of inject ion of urea, blood sam ple w as t aken again as m uch as 5 cc. The blood sam ples w ere t hen cent rifuged t o obtain plasma fluid. Then t he plasm a w as analyzed t o det erm ine levels of blood urea by t he met hod of product ion of Urea Kit Roche, both before and aft er inject ion of urea. Body com posit ion can be det erm ined by calculat ing a urea according to t he formula suggest ed Bart le et al. (1983) as follow s:
Em pt y body w at er (EBW = em pt y body wat er), body fat and body prot ein (em pt y body prot ein) w as det erm ined by the following form ula:
Wat er bodies (%) = 59.1 + 0.22 RU - 0.04BH (Rule et al., 1986), where UR = urea space (%) and BH = live weight (kg), body fat (%) = 5.19 - 0.31 RU- 0.05 BH. and body prot ein (%) = 5.16 + 0.07 RU - 0.001 BH.
Deposition of Nutrients
Deposit ion of nutrient s (fat , prot ein, and minerals) can be calculat ed by convert ing w eight daily life w ith body composit ion. Based on this nut rient deposit ion, it can be calculat ed t he energy ret ent ion with the provisions of 1g of fat deposition is equivalent t o 9.32 kcal, w hile t he deposit ion of 1 g prot ein, equivalent t o 5.5 kcal (Ørskov and Ryle, 1990). So the ret ent ion of energy per day per cat t le can be calculat ed by summ ing the energy cont ent of the deposition of body fat and prot ein per cat tle per day.
Urine Allantoin Levels
Allantoin concent rat ion in urine w as m easured by t he met hod of M at sumot o et al. (1995). M icrobial protein supply in rum inant s can be predict ed w ith the cont ent of purine derivat ives in urine. Ruminant anim al feed generally cont ain lit t le purine and most experienced ext ensive degradat ion as a result of m icrobial ferm ent at ion. Purine nucleic acids from t he degraded m ainly derived from t he rumen and excret ed in the urine as derivat ives, namely hipoxanthin, xanthin, uric acid and allant oin. The proport ion of these derivat ives in ruminant urine allant oin ranged 60-80%, 10-30%, uric acid and xant hin hipoxanthin added as m uch as 50-10% (Prest on, 1995). In t his measurem ent m et hod, allantoin hydrolyzed in alkaline condit ions w ith a t em perat ure of 100 oC t o allantoat acid w hich w as t hen degraded int o urea and glyoxylat e acid in acid solut ion.
J. Biol. Chem. Research 827 Vol. 31, 2: 822-840 (2014)
(mg)
content
urea
blood
of
change
X
weight
live
X
10
(mg)
injected
urea
(%)
Space
Glyoxylat e acid will react with phenilhidrasin hidrochlorid to becom e phenilhidrazon w hich then w ill form a colored compound with pot assium ferisianida. Then t he solution is
read at λ 522 nm. Measurement procedure is as follows: 1 ml of urine sample / stan
dard solut ion / dist illed wat er int o a t est t ube dipipet . Add 5 ml of dist illed w at er and 1 m l of 0.5 M NaOH, t hen mix t he solution by using a vort ex. Place t he t ube in a boiling w at er bath (PEG boil bath) for 7 minut es. Furt hermore, t he t ube rem oved and cooled. Into each t ube add 1 ml HCl 0.5 M . Then add phenilhidrasin, and t hen the t ube is insert ed back int o t he wat er bath for 7 minut es. Aft erw ard, the tube is cooled by Icy alcohol bath a few minut es. Then pipet t e and mixed w it h 3 ml of concent rat ed HCl with 1 ml of pot assium ferri cyanide and then t ransferred int o a cuvet t e at room t emperat ure. Read the m ixt ure at 522 nm and concent rat ion of allantoin can be calculat ed using the following formula:Allantoin cont ent = Allantoin st andard / Allantoin sample x 100 / 5 (m g/ 1000m l) Allantoin levels as a purine derivat ive in urine is used t o predict microbial prot ein product ion by using the formula Int ernat ional Atom ic Energy Agency (1999), nam ely:
Y = 0.85 X + 0.145W0.75, Y = t ot al allantoin excret ion in urine (m m ol / day), X = microbial purines absorbed (mm ol/ day), 0,145W0.75 = cont ribut ion of endogenous purines at 0,145 per kg m et abolic weight (W0.75) from Bali cat t le, and the number 0.85 = coefficient of absorption of purines. Furt hermore, t he value of X is used to predict rum en microbial nit rogen production using the form ula:
M icrobial N (g/ day) = (70X) / (0.83 x 0.116 x 1000), with the underst anding purine digestibilit y = 0.83; X m icrobial purines absorbed (m mol / day); 70 = N cont ent of purines (mg/ m mol), and 0.116 = 11.6: 100 is t he rat io of purine : N-t ot al in the rum en. Furt hermore, t he m icrobial nit rogen can be convert ed int o microbial prot ein by mult iplying the number 6.25.
Data Analysis
The dat a obt ained w ere analyzed by variance. When a significant eff ect on t reat m ent responce variables w as observed, t he t est w as cont inued by orthogonal contrast t est at level 5%. Regression analysis was used t o det erm ine t he opt im al mineral-vit am in supplement at ion to obt ain live w eight gain the maxim um of Bali catt le in accordance w ith t heir genet ic pot ential (St eel and Torrie, 1986).
RESULTS AND DISCUSSION
Effect of Vitamin-M ineral Supplementation on Nutrient Consumption
Vit am in-m ineral supplem ent ation significantly (P<0.05) effect ed t he grass dry m at t er intake, t ot al dry m at t er, organic m at t er, crude prot ein, crude fiber, m inerals and energy consumption. The highest grass dry mat t er consum pt ion of cat tle w it hout supplement at ion (S0 = cont rol); it was 2.39 kg/ day. How ever, vit amin-m ineral supplement at ion at 0.1% (S1) in concent rat e result ed in grass dry mat t er int ake decreased t o 2.29 kg/ day, but t his decrease w as n ot st at istically significant (P> 0.05). This becomes a real decline in consumpt ion (P <0.05) when cat tle were given concent rat es w ith vit amin-m ineral supplem ent ation at 0.2% (S2) and 0.3% (S3), respect ively of 6% and 12% of t he cont rol diet (Table 2).
Tot al dry mat t er consumpt ion (concent rat e + grass) w ere also influenced significant ly by vit am in-mineral supplem ent at ion in concent rat e. Supplement at ion of 0.1% show ed no significant difference compared w it h no supplem ent s, but the dry m at ter consumption decreased significantly at 360-470 g in the vit amin-m ineral supplement at ion from 0.2 to 0.3% (Table 2)
The highest consum pt ion of organic mat erial in cat t le fed diet s w it hout vit amin-mineral supplement at ion of 4.45 kg/ day, but this consumpt ion w as not significantly different (P>0.05) compare w it h cat tle supplem ent ed wit h 0.1%. This organic m at t er consumption decreased significant ly in catt le fed 0.2% vit am in-mineral supplem ent and 0.3% respect ively to 4.21 and 4.12 kg/ day (Table 2).
Vit am in-m ineral supplem ent at ion had significant effect on consumpt ion of prot ein rat ions. Prot ein consumption per day ranges from 7.32 t o 7.92 g/ kgW0.75, equivalent to 528-571 g per cat t le per day, w hen the average weight of 300 kg cat t le. Consumption of prot ein in cat tle fed t he cont rol diet w as not significant ly different in prot ein int ake in cat t le fed vit amin-m ineral supplem ent 0.1%. M eanwhile, consumption of prot ein in cat t le feed supplement at ion with 0.2% and 0.3%, significant ly low er t han t he consumption of prot ein in cat t le fed t he cont rol diet (Table 2).
In Table 2 also show s that vit am in-mineral supplem ent at ion had significant effect on crude fiber int ake in Bali catt le fed King grass-based rat ions. Increased levels of vit am in-mineral supplem ent at ion of 0.1% to 2% and 0.3% in concent rat es can reduce consumption of crude fiber and minerals. M eanw hile, vit amin-m ineral supplement at ion of 0.1% w as not significantly different from cont rol diet .
Table 2. Nutrient consumption in Bali cattle fed King grass-based rations w ith vitamin mineral supplementation.
Variables Supplem ent at ion Treat m ent
S0 S1 S2 S3
Consumpt ion: Dry m att er (kg/ d):
Concent rat e 4,26a 4,29a
4,05a 4,08a
Grass 2,39b 2,29b
2,24a 2,10a
Tot al 6,65b 6,58b
6,29a 6,18a
Organic m at t er (kg/ d) 4,45b 4,40b 4,21a 4,12a
Crude prot ein (g/ kgW0,75/ d) 7,92b 7,87b 7,44a 7,32a
Crude fiber (g/ kgW0,75/ d) 12,18b 11,84b 11,39a 10,83a
M inerals (g/ kgW0,75/ d) 17,35b 17,19b 16,28a 15,96a
Energy (Kcal/ kgW0,75/ d) 271,52b 267,47b 254,54a 247,33a
Descript ion: Variables wit h similar superscript number did not significant ly different at P<0.05 when compared t o orthogonal cont rast test ; S0, S1, S2 and S3 = vit amin-m ineral supplement at ion in concent rat e at 0%, 0.1%, 0.2% and 0.3%, resvect ively. W0, 75 = met abolic w eight of cat tle; d = day.
The range of crude fiber int ake w as 10.83 to 12.18 g/ kgW0.75/ d, while the consumpt ion of minerals ranging from 15.96 t o 17.35 g/ kgW0.75/ d. Consumption of crude fiber and minerals are t he highest in catt le fed t he cont rol diet and low est in cat tle fed vit am in -mineral supplement 0.3% in concent rat e.
Energy consum ption was also affect ed by vit amin -m ineral supplement at ion in cat tle fed basic rat ion king grass. Rat ion energy consumpt ion in cat tle fed t he highest vit am in -mineral supplem ent at ion of 0.1% in concent rate, but not significantly different from cat t le fed a cont rol diet (Table 2). The range of energy consum ption is 247.33 to 271.52 Kcal/ kgW0.75/ d, equivalent t o 17.8 to 19.6 M cal per cat t le per day, w hen t he average w eight of catt le is 300 kg.
Effect of Vitamin-M ineral Supplementation on Nutrient Digestibility
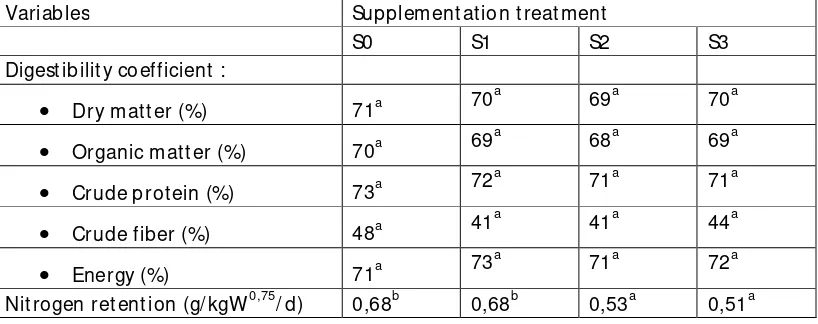
Vit am in-m ineral supplem ent at ion did not significantly affect digest ibilit y coefficient of dry mat t er, organic mat t er, crude prot ein, crude fiber, and energy, but significant effect on nitrogen ret ent ion (Table 3). Dry m at t er digest ibilit y coefficient ranged 69-71%, the highest w as in cat tle fed t he cont rol diet and low est in cat tle fed vit amin-m ineral supplement s in concent rat e 0.2%, but all digest ibilit y coefficient s show ed no significant difference (P> 0.05).
Ration digest ibilit y coefficient of organic mat ter ranging from 68-70%, t he highest digest ibilit y coefficient w as also for cat t le fed t he cont rol diet and low est at 0.2% supplement at ion t reat ment . Digest ibilit y coefficient s of the five groups of catt le t hat w ere given four t reat m ent s of vit am in-mineral supplem ent at ion in concent rat e w ere st at ist ically significant ly differed.
Vit am in-m ineral supplem ent at ion result ed in decreased digest ibilit y coefficient of crude prot ein and crude fiber in Bali cat tle fed King grass based rat ions, but this decrease was not st at istically significant . Crude prot ein digest ibilit y coefficient s ranged 71-73%, while crude fiber digest ibility coefficient ranges of 41-48%. The coefficient of digest ibilit y was highest in catt le fed the cont rol diet (Table 3).
In Table 3, it w as indicat ed t hat lit t le energy digest ibilit y coefficient increased in cat t le fed vit am in-mineral supplem ent at ion of 0.1% and 0.3% in concent rat e com pared w it h catt le w ithout supplement at ion, but this increase w as not st at ist ically significant (P> 0.05). Energy digest ibilit y coefficient w as the highest in cat tle w ith vit amin-m ineral supplement at ion of 0.1% and lowest in cat t le fed t he cont rol diet and cat t le by supplement ing 0.2%, are 71% each.
Vit am in-m ineral supplement at ion significantly affect ed t he ret ent ion of nit rogen (N) in cat t le fed King grass-based rat ions (Table 3). Vit am in-mineral supplement at ion at 0.1% in concent rat e has not result ed in decreased N ret ent ion than cat t le w it hout supplement at ion, but supplement at ion increased t o 0.2% and 0.3% result ed in a decrease in nit rogen ret ent ion t o 22% and 25%, respect ively com pared to catt le w ithout supplement at ion. Overall, N ret ent ion ranged from .51 t o .68 g/ kgW0,75/ d, equivalent to 37-49 g per cat tle per day when the average live w eight of catt le is 300 kg.
Table 3. Nutrient digestibility coefficients and nitrogen retention in Bali cattle fed King grass-based rations w ith vitamin-mineral supplementation.
Variables Supplem ent at ion t reat ment
S0 S1 S2 S3
Digest ibilit y coefficient :
Dry mat t er (%) 71a 70a
69a 70a
Organic m at t er (%) 70a 69a
68a 69a
Crude prot ein (%) 73a 72a
71a 71a
Crude fiber (%) 48a 41a
41a 44a
Energy (%) 71a 73a
71a 72a
Nit rogen ret ent ion (g/ kgW0,75/ d) 0,68b 0,68b 0,53a 0,51a
Descript ion: Variables w ith similar superscript number did not significantly differ at P<0.05 when compared w ith orthogonal cont rast t est ; S0, S1, S2 and S3 = vit amin-m ineral supplement at ion in concent rat e at 0%, 0.1%, 0.2% and 0.3%, respect ively. W0, 75 = met abolic w eight of cat tle; d = day.
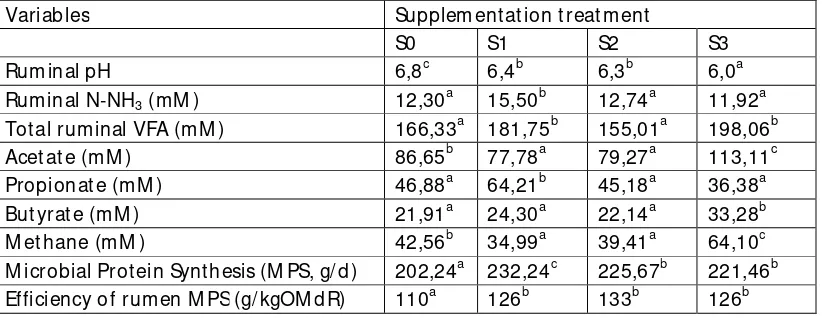
Effect of Vitamin-M ineral Supplementation on Rumen Fermentation
Result s of ferment at ion and microbial prot ein synt hesis in Bali cat tle fed King grass-based rat ions w ere influenced significant ly (P<0.05) by vit amin-m ineral supplem ent at ion in concent rat e (Table 4). Vitamin-m ineral supplement ation can reduce cat t le rumen pH up t o 12% at the level of supplem ent at ion of 0.3% w hen com pared w it h cat tle w ithout supplement at ion. Rum en pH values in t his st udy ranged from 6.0 to 6.8 and t he highest pH values in catt le fed diet s w ithout vit amin-mineral supplement at ion, and the pH value w as significantly higher than supplem ent ation t reat m ent.
Concent rat ions of N-NH3 cat t le rum en fluid w as also significantly influenced by vit am in -mineral supplement at ion. Vit am in--mineral supplem ent at ion at 0.1% in concent rat e produced NH3-N concent rat ion of rum en fluid t hat is 15.50 m M highest compared with cat t le fed diet s w it hout supplem ents and catt le w ith vit amin-m ineral supplem ent ation of 0.2% and 0.3% in concent rat e .
Vit am in-m ineral supplem ent at ion significant ly affect ed the concent ration of volatile fat t y acids (VFA) t ot al, acet at e, propionat e and but yrat e in Bali catt le fed King grass-based rat ions. Tot al VFA concent rat ion ranged from 155.01 to 198.06 mM and the highest concent rat ion in cat t le w ith vit amin-m ineral supplem ent at ion 0.3% and t he lowest concent rat ion in cat tle supplem ent ed w it h 0.2% level.
Vit am in-m ineral supplem ent ation can reduce t he concent ration of acet ic acid significant ly up t o 10% in cat tle w ith supplement at ion of 0.1% compared w it h catt le w ithout supplement at ion (77.78 mM vs. 86.65 m M ). However, im provem ent s in the 0.3% level of supplement at ion result ed in increased concent rat ion of acet ic acid t o 113.11 mM , which is t he highest concent rat ion, and significant ly higher t han other t reat ment s. Overall, t he concent rat ion of acet ic acid ranged from 77.78 to 113.11 mM and the lowest concent rat ions in cat tle w ith supplem ent at ion of 0.1%, but insignificant ly different from 0.2% supplem ent at ion.
Vit am in-m ineral supplem ent ation at 0.1% in concent rat e may increase t he concent rat ion of cat t le rumen fluid propionat e acid up to 37% compared with catt le w ithout supplement at ion (64.21 mM vs. 46.88 mM ). However, supplem ent at ion increased t o 0.3% caused a decrease in propionat e acid concent rat ion t o 36.38 m M (Table 4).
But yric acid concent rat ions have not significant ly change w hen given a vit amin-mineral supplement at ion up to 0.2% in concent rat e. However, increasing levels of supplement at ion up t o 0.3%, causing t he concentrat ion of but yric acid increased t o 33.28 mM of cat t le wit hout supplem ent at ion of t he acid cont ent but yrat e only 21.91 m M (Table 4).
Table 4. Results fermentation and microbial protein synthesis in the rumen of Bali cattle fed King grass-based rations with vitamin-mineral supplementation.
Variables Supplem ent ation t reat m ent
S0 S1 S2 S3
Rum inal pH 6,8c 6,4b 6,3b 6,0a
Rum inal N-NH3 (mM ) 12,30a 15,50b 12,74a 11,92a
Tot al ruminal VFA (m M ) 166,33a 181,75b 155,01a 198,06b
Acet at e (mM ) 86,65b 77,78a 79,27a 113,11c
Propionat e (m M ) 46,88a 64,21b 45,18a 36,38a
But yrat e (m M ) 21,91a 24,30a 22,14a 33,28b
M et hane (mM ) 42,56b 34,99a 39,41a 64,10c
M icrobial Prot ein Synt hesis (M PS, g/ d) 202,24a 232,24c 225,67b 221,46b
Efficiency of rum en M PS (g/ kgOM dR) 110a 126b 133b 126b
Descript ion: Variables wit h different superscript number differed significant ly at P<0.05 w hen compared w it h ort hogonal cont rast t est ; VFA = Volat ile Fat t y Acids; OM dR = organic mat t er degraded in t he rum en = 0.65 x insoluble organic m at ter; S0, S1 , S2 and S3 = vit amin-mineral supplem ent at ion in concent rat e at 0%, 0.1%, 0.2% and 0.3%, respect ively.
The result s of t his st udy showed that vit amin-m ineral supplem ent at ion of 0.1 t o 0.2% in concent rat e t o reduce m et hane emissions at the Bali cat tle fed King grass-based rat ions (Table 4). Vit am in-m ineral supplement at ion at 0.1% in concent rat e t o reduce met hane em issions up to 18% compared with cat tle w ithout supplem ent ation (34.99 mM vs. 42.56 mM ). However, increasing levels of supplem entat ion up t o 0.3% of met hane em issions increased by up to 51% of cat tle w it hout supplement at ion (64.10 mM vs. 42.56 mM ). Vit am in-m ineral supplement at ion of 0.1-0.3% in concent rat e can significantly increase microbial prot ein synthesis in Bali catt le fed King grass-based rat ions (Table 4). Increased microbial prot ein synt hesis w as reached 15% in cat tle w it h vit amin-m ineral supplement at ion of 0.1% when compared w ith cat t le without supplement at ion (232.24 g/ day vs 202.24 g/ day). Efficiency of rumen m icrobial prot ein synt hesis, also increased in cat t le fed vit amin-mineral supplem ent s. Efficiency of rum en m icrobial prot ein synt hesis w as increased t o 21% in catt le w ith supplement at ion of 0.2% in concent rat e com pared w ith cat t le w ithout supplement at ion (133 vs. 110 g/ kg of organic m at erial degraded in t he rum en).
Regression analysis show s t hat there is a real relat ionship bet w een t he level of vit amin -m ineral supple-m ent at ion with ru-men -microbial prot ein synthesis of Bali cat tle w hich follow s t he equat ion: Y = 204.1 + 307.7X - 855.4X2, with a coefficient of det erm inat ion (R2) = 0.501* , w ith the underst anding of X = level of vit amin-m ineral supplem ent at ion in percent (%), and Y = microbial prot ein synthesis in g/ day (Figure 1).
Figure 1. The relationship betw een vitamin-mineral supplementation w ith rumen microbial protein synthesis of Bali cattle fed King grass-based rations.
Based on these quadrat ic equat ions can be predict ed vit amin-m ineral supplement at ion in concent rat e opt imum is 0.18% w hich will cause m aximum rum en m icrobial prot ein synt hesis amount ed to 231.77 g per day.
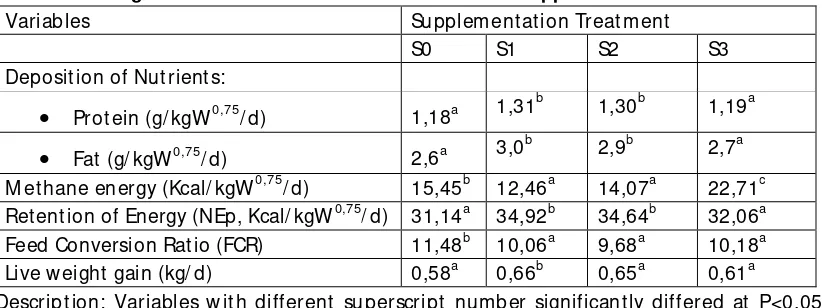
Table 5. Deposition of nutrients and energy for productivity of Bali cattle fed King grass-based rations w ith vitamin-mineral supplementation.
Variables Supplem ent at ion Treat ment
S0 S1 S2 S3
Deposit ion of Nut rient s:
Prot ein (g/ kgW0,75/ d) 1,18a 1,31b
1,30b 1,19a
Fat (g/ kgW0,75/ d) 2,6a 3,0b
2,9b 2,7a
M et hane energy (Kcal/ kgW0,75/ d) 15,45b 12,46a 14,07a 22,71c
Ret ent ion of Energy (NEp, Kcal/ kgW0,75/ d) 31,14a 34,92b 34,64b 32,06a
Feed Conversion Rat io (FCR) 11,48b 10,06a 9,68a 10,18a
Live w eight gain (kg/ d) 0,58a 0,66b 0,65a 0,61a
Descript ion: Variables w it h different superscript number significantly differed at P<0.05 w hen com pared with ort hogonal cont rast t est ; NEp = Net energy for product ion (live w eight gain of cat tle); FCR = t ot al dry m at t er int ake divided by live weight gain per day of Bali catt le; S0, S1, S2 and S3 = vit amin-mineral supplem ent at ion in concent rat e at 0%, 0.1%, 0.2% and 0.3%, respect ively; W0, 75 = m et abolic w eight of cat t le; d = day.
J. Biol. Chem. Research 833 Vol. 31, 2: 822-840 (2014)
0 50 100 150 200 250 300
0 0.05 0.1 0.15 0.2 0.25 0.3 0.35
R
u
m
en
m
ic
ro
b
ia
l
p
ro
te
in
s
y
n
th
es
is
(
g
/d
)
Effect of Vitamin-M ineral Supplementation on Energy Utilization
Vit am in-m ineral supplem ent at ion in concent rat e significant ly affect nut rient deposition, met hane energy, energy ret ention, feed conversion ratio (FCR), and live w eight gain of Bali catt le fed King grass-based rat ions (Table 5). Prot ein and fat deposit ion increased significant ly due to vit amin-m ineral supplement ation from 0.1 to 0.2% in concent rat e. Prot ein deposition ranged from 1.18 to 1.31 g/ kgW0.75/ day equivalent to 85.06 to 94.43 g/ head/ day, and the highest deposition in cat t le w ith vit amin -mineral supplement at ion of 0.1% in concent rat e. M eanwhile, the deposit ion of fat ranged from 2.6 t o 3.0 g/ kgW0.75/ day equivalent to 187.42 t o 216.25 g/ head/ day w hen t he average live w eight of 300 kg of Bali cat tle.
Vit am in-m ineral supplem ent at ion in concent rat e has significant ly affect ed t he energy lost in the form of m et hane gas. Increased levels of supplem ent at ion up t o 0.2% can reduce t he energy of met hane, but supplem ent at ion of 0.3% can increase t he energy of m et hane (Table 5). The energy lost in the form of met hane ranged from 12.46 to 22.71 Kcal/ kgW0.75/ day, equivalent to 0.9-1.64 M cal/ head/ day when t he average w eight of 300 kg of Bali catt le.
Energy ret ent ion to live w eight gain of cat tle w as also influenced significant ly by vit am in-mineral supplem ent ation. Vit amin-m ineral supplem ent at ion up t o 0.2% in concent rat e level can increase t he energy ret ent ion significant ly (P<0.05) in Bali cat tle fed King grass-based rat ions (Table 5). Supplem entation at 0.3% level in concent rat e can also increase t he ret ent ion of energy, but t he increase w as not st at ist ically significant . Energy ret ent ion t o added w eight of live cat t le in t his st udy ranged from 31.14 t o 34.92 Kcal/ kgW0.75/ day and equivalent t o 2.42 to 2.52 M cal / head/ day, w hen the average w eight of 300 kg. The highest energy ret ent ion in cat t le w ith 0.1% supplem ent at ion in concent rat e and lowest w as in cat t le without supplem ent ation.
Ration ut ilizat ion efficiency was also affect ed by vit am in-mineral supplem ent at ion. Vit am in-m ineral supplement at ion can improve t he efficiency of feed ut ilizat ion in Bali cat t le charact erized by increasingly low value of FCR (feed conversion ratio). In Table 5 it show ed t he low est FCR values in cat t le with supplem ent at ion of 0.2% and the highest was in cat tle without supplem ent at ion.
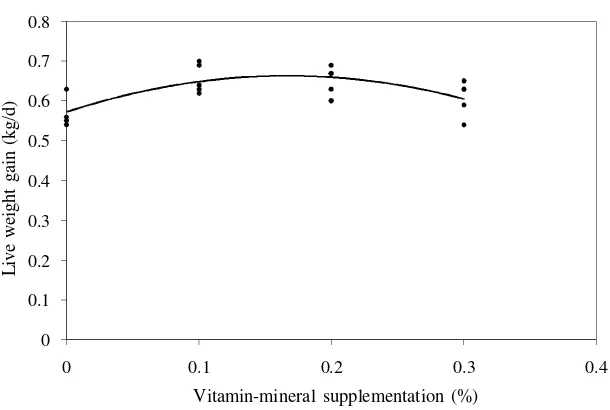
Vit am in-m ineral supplem ent at ion in concent rat e m ay increase t he live w eight gain of Bali cat t le fed King grass-based rat ions, but supplement at ion of 0.2 to 0.3% levels did not differ significantly w ith live w eight gain of Bali cat t le fed a cont rol diet (Table 5). Added cat t le live weight w as reached at 0.1% supplement at ion and the low est on the cont rol diet . There is a clear relat ionship bet ween vit am in-mineral supplement at ion with live w eight gain of Bali cat tle as follow ing regression quadratic equation: Y = 0.583 + 0.959 X - 2.95 X2 w it h a coefficient of determ inat ion (R2) = 0.414* with the underst anding of X = supplement at ion of vit amin-m ineral (%), Y = live w eight gain of Bali catt le (kg/ day) as seen in Figure 1. From this regression equation can be predict ed optim al vit amin-m ineral supplement at ion of 0.16% which produces t he m axim um live w eight gain of Bali cat tle 0.66 kg/ day.
Figure 2. The relationship betw een vitamin-mineral supplementation with live weight gain of Bali cattle fed King grass-based rations.
DISCUSSION
In principle, feed int ake in anim als is t o m eet t he nut rient and energy n eeds. Livest ock w ill st op eat ing when energy needs are m et or st om ach has been filled by the feed nut rient needs exceed the capacit y, although not yet fulfilled. Level of feed int ake is influenced by physiological st at us of livest ock, feed qualit y and palat abilit y. To obt ain t he opt im al level of consumption requires rat ion form ulat ions t hat m at ch t he needs of livest ock rat ions cont aining adequat e and balanced nut rient.
Ration is at t empt ed in this st udy meet s t he nut rient needs of rat ion ingredient s consist ing of 5 kg of concent rat e, King grass w as given ad libit um or given an average of 15 kg per cat t le per day, so that t hese rat ions cont aining dried m at erial (BK) 40.51%, crude prot ein (CP) 10.31%, and energy (GE) 3.27 M cal/ kg, equivalent to 56.29% levels of TDN (Tot al Digest ible Nut rient s). How ever, t he result s of t his experiment showed t hat feed int ake and nut rient levels such as dry mat t er, organic m at t er, crude prot ein, and energy decreased w hen given vit amin-m ineral supplement at ion in concent rat e; especially t he level of supplem ent ation of 0.2 to 0.3% caused a decrease in consumption st at istically significant (Table 2). This decline in consumption caused by an im balance of nut rient s in diet , especially m inerals. This causes t he excess m ineral supplement at ion, especially Zn in cat t le's digest ive t ract causes m et abolic disturbances, loss of appet it e, reduce t he accum ulation of Fe and Cu in the liver and increase spending on S in the feces (Geogievskii, 1982). Thus, this w ill suppress m et abolism disorders feed int ake and nut rient s. Decrease in consumption level has not yet led t o nut rient -deficient cat t le and t his can be proved by t he accret ion of a cat t le live w eight during t he experiment , although feed int ake decreased w ith increasing levels of vit am in-mineral supplem ent at ion (Table 2 and Table 5).
J. Biol. Chem. Research 835 Vol. 31, 2: 822-840 (2014) 0
0.1 0.2 0.3 0.4 0.5 0.6 0.7 0.8
0 0.1 0.2 0.3 0.4
L
iv
e
w
ei
g
h
t
g
ai
n
(
k
g
/d
)
Ration digest ibilit y show ed no significant difference alt hough feed int ake w as significant ly affect ed by vit amin-m ineral supplem ent at ion in concent rat e (Table 3). How ever, t here is a t rend of increased consumpt ion is follow ed by an increase in digest ibilit y coefficient s. This can be underst ood that the higher value of digest ibilit y fast en to em pt y of the digest ive t ract so that fast en the filling t hrough t he higher consumption.
N ret ent ion w as significantly affect ed by vit am in-m ineral supplem ent at ion in concent rat e on Bali cat tle fed King grass-based rat ions. Level of supplement at ion 0.1% to produce N ret ent ion the sam e wit h rat ion w ithout supplem ent at ion, but N ret ent ion decreased w hen the level of supplem ent at ion w as increased t o 0.2-0.3%. This proves t hat t he plant feed or ruminant feed mat erial is st ill lacking m inerals Zn, w hich is t he level of supplement at ion of 0.1% would st ill give positive effect to decrease nit rogen ret ent ion w hen t he level of supplem ent at ion increased. This represent s an indicator of the optim al level of vit amin-m ineral supplem ent at ion in concent rat e. The result s of t his st udy support t he report Kaunang (2004) that t ropical forage plant s and especially in Indonesia is t ruly deficient of minerals, especially Zn.
Vit am in-m ineral supplem ent at ion significantly affect the result s of ferment at ion and microbial prot ein synt hesis in cat t le fed basic Balinese king grass (Table 4). Values of pH decreased w it h increasing levels of vit am in-m ineral supplem ent at ion in concent rat e, but rum en fluid pH values st ill within the norm al range is 6.0 to 6.8. This condition support s t he normal ferm ent at ion process t ook place in t he rumen. This can be proved by N-NH3 concent rat ions sufficient for microbial prot ein synthesis. Rum en N-NH3 concent rat ion in t his st udy ranged from 11.92 t o 11.50 m M . The result s of t his st udy is higher t han report ed by Sat t er and Slyt er (1974) cit ed Sut ardi (1997) that the m inimum concent rat ion of N-NH3 is 4 mM and t he highest concent ration report ed by Prest on and Leng (1987) cit ed Sut ardi (1997), nam ely 14 m M . This can be underst ood t hat t his st udy used t he Bali cat t le, w hile anot her st udy did not use Bali cat tle, how ever, N-NH3 concent rat ion range w as st ill wit hin normal range. This can be proved by t he result of ferm ent at ion of volatile fat t y acids (VFA), w hich is quit e high.
N-NH3 concent rat ion sufficient t o offset t he relat ively high concent ration of VFA (from 166.33 to 198.06 mM ) would st rongly support the efficiency of rum en microbial prot ein synt hesis. N-NH3 is t he result of prot ein degradat ion, while t he VFA degradat ion product s from carbohydrat es in the rumen. The balance bet w een t hese t w o component s is an ideal prerequisit e for the optim ization of microbial prot ein synthesis. St ern et al. (2006) st at ed t hat the rum en bact eria can use prot ein and carbohydrat es as energy sources. Carbohydrate is t he m ain energy source for bact eria, and can also be used as a carbon skelet on that combines wit h am monia (NH3) to rum en m icrobial prot ein synthesis. Vit am in-m ineral supplement at ion of 0.1% in concent rat e t o give t he best effect in t he process of ferm ent at ion and microbial prot ein synthesis in cat tle fed basic rat ion of king grass (Table 4). The highest concentrat ion of N-NH3 followed by the highest propionat e acid and t he lowest concent rat ion of m et hane gas caused t he highest rumen microbial prot ein synt hesis com pared t o ot her t reat m ent s. This show s t hat supplement at ion at t he level of 0.1% produce enough rations balanced nut rient s and minerals, especially balance.
M ineral cont ent of Zn to 65.09 ppm (Table 3) in concent rat e, slight ly higher t han the recom m endat ion of Georgievskii (1982), i.e. 40-60 ppm is based on t he needs of t he cat t le out side Indonesia. This is t rue that m ineral nut rient requirement s especially of Zn in Bali cat t le are higher t han t he cat t le in foreign count ries. Zn m inerals needed by cat t le small amount s (micro minerals), but it has a very im port ant function in the various act ivit ies of enzymes in the body of cat tle.
There is a clear relationship bet w een levels of vit amin-mineral supplem ent at ion with rum en microbial prot ein synthesis follow ing regression equat ion: Y = 204.1 + 307.7 X - 855.4 X2, w it h a coefficient of det erm inat ion (R2) = 0.501* , wit h the underst anding of X = level of supplem ent at ion vit amin-m ineral in percent (%), and Y = microbial prot ein synt hesis in g/ day. (Figure 1). Regression equat ions indicat e t hat the levels of vit am in-mineral supplem ent ation at 0.18% couse m axim al microbial prot ein synt hesis am ount ed t o 231.77 g per day. This m eans t hat supplem ent at ion levels above 0.18% has revealed an im balance of nut rient s that can reduce rumen m icrobial prot ein synt hesis, rum en microbial prot ein which has a very high biological value for grow t h or product ion of beef cat t le.
Vit am in-m ineral supplement at ion from 0.1 to 0.2% in concent rat e t o give a posit ive influence on the deposit ion of nut rient s (prot ein and fat ), energy ut ilizat ion and product ivit y of Bali catt le fed King grass-based rat ion (Table 5). Increased nut rient deposition w as relat ed t o the out com e of ferm ent ation in the rum en (Table 4). The high concent rat ion of N-NH3 and propionat e acid and low m et hane product ion at the level of supplement at ion from 0.1 to 0.2% produce microbial prot ein which synt hesis high also. Rumen m icrobial prot ein as a major sources of am ino acids for t he host anim al, so the higher rum en microbial prot ein production of higher prot ein deposition in the body of cat t le. Sim ilarly, t he higher is t he acid product ion of t he propionat e, the higher t he nut rient deposit ion in the form of body fat . M eanw hile, the lower t he m et hane gas product ion m eans less energy is wast ed so t hat m ore energy is st ored in the form of anim al prot ein and fat body.
The high m et hane product ion in cat tle w it hout supplement at ion and cat tle w ith vit amin-mineral supplement at ion of 0.3% in line w it h crude fiber digest ibilit y coefficient s (Table 3 and Table 4). The higher is t he crude fiber digest ibilit y coefficient s are in line w ith t he higher production of m et hane gas. These dat a indicat e t hat t he patt ern of ferm ent at ion leads t o the port ion of acet ic acid of a larger line w ith the increased product ion of met hane gas because crude fiber is st ruct ural carbohydrat e which t he result of ferm ent at ion more acet ic acid (Arora, 1995). The product ions of m et hane in catt le w ith high levels of supplem ent at ion of 0.3% probably due t o t he exist ence of advanced ferm ent at ion process so many of liberat e H2 ut ilized by m et hane-forming microbes such as M et hanobact erium ruminant ium, and M et hanobact erium m obilis (Arora, 1995).
Deposit ion of nut rient s (prot ein and fat ) is associat ed with ret ent ion of energy for livest ock production. The result s of t his st udy show t hat increasing nut rient deposition higher energy ret ent ion t o live w eight gain of catt le t hat the higher also (Table 5). This is underst andable because t he fat and prot ein the body can be convert ed into energy w hich t he energy cont ent of one gram of fat and one gram of prot ein, respect ively 9.32 and 5.5 kcal/ g (Orskov and Ryle, 1990).
The high nutrient deposit ion, energy ret ent ion and live w eight gain in cat tle w ith vit amin-m ineral suppleamin-m ent at ion of 0.1% due t o the sufficient and balanced nut rient s in the ration. Concent rat e w it h a vit amin-mineral supplem ent at ion 0.1% cont aining rat io of N : S are balanced, and cont ains enough m inerals Zn and S (Table 3). Sulfur is an essent ial m ineral in amino acids synt hesis cont ains sulfur, and is needed in large numbers t o m icrobial prot ein synt hesis. M eanw hile, Zn m inerals involve in m et alo enzym e synt hesis such as DNA and RNA polym erase, alkaline phosphat ase, am ylase and neut ral prot ease (Jouany, 1991). Thus, this st rongly support s rumen m icrobial prot ein synt hesis and it s act ivit y so that t he feed m at erial ent ering t he rum en degraded t o produce energy efficient ly utilized wit h a low indicat or of wast ed energy in the form of met hane gas.
Figure 3. Relationships between rumen microbial protein synthesis with live weight gain of Bali cattle fed King grass-based rations.
The result s showed t hat t he apparent link bet w een rumen m icrobial prot ein synt hesis w ith live weight gain of Bali cat t le fed King grass-based rat ions w ith vit amin-m ineral supplement at ion. Relationship following t he regression equation: Y = 0.002X – 0.002, w it h coefficient s of det erm inat ion (R2) = 0.73* , with the underst anding of X = m icrobial prot ein synt hesis (g/ day) and Y = live w eight gain of cat t le (kg/ day) (Figure 3). This regression equat ion means that any increase in rumen microbial prot ein synt hesis for 1 g w ill be follow ed by a live w eight gain of cat tle of 2 g per day. The result s of t his st udy support previous research t hat report ed result s Part am a et al. (2007) that t here is a real relat ionship bet w een microbial prot ein synthesis w ith live w eight gain of Bali cat tle fed rice st raw urea am moniat ed-based complet e rat ions with supplement at ion of vit amin-m ineral coamin-mplex.
CONCLUSIONS
The result s of this st udy can be summ arized as follow s:
Vitam in-mineral supplem ent at ion by 0.1-0.3% in concent rat e may increase t he efficiency of ut ilizat ion of feed, rum en microbial prot ein synt hesis, deposit ion of prot ein and fat , the ret ent ion energy, reduce em issions of m et hane up to 18% at the level of supplement at ion of 0.1% and can increase live w eight gain in Bali cat t le fed King grass-based rat ions.
J. Biol. Chem. Research 838 Vol. 31, 2: 822-840 (2014) 0.40
0.45 0.50 0.55 0.60 0.65 0.70 0.75
190 200 210 220 230 240 250 260
L
iv
e
w
ei
g
h
t
g
ai
n
o
f
B
al
i
ca
tt
le
(
k
g
/d
)
Ret rieved opt im um levels of vit am in-m ineral supplement at ion in concent rat e is 0.16% w hich can produce m axim um of m icrobial prot ein synthesis and live w eight gain of Bali cat t le.
There is a real relat ionship bet w een rum en m icrobial prot ein synthesis (X) and live w eight gain of Bali cat tle (Y) fed King grass-based rat ions w it h vit amin-m ineral supplement at ion according t o the regression equation: Y = 0.002X – 0.002, R2 = 0.73* which means t hat any increase in rum en microbial prot ein synthesis for 1 g w ill be followed by a live w eight gain of Bali cat tle of 2 g per day.
ACKNOW LEDGM ENTS
I w ish t o thank t o the Rect or of Udayana Universit y, Head of Research and Public Service, and Dean of Facult y of Animal Husbandry, Udayana Universit y for giving perm it t o this research. Secondly, m y grat it ude t o all research t eam for t heir support as of: Anak Agung Ayu Sri Trisnadew i, St efanus, I Gst Lanang Oka Cakra, I Wayan Wiraw an, Puspit asari, Cornelis Alexander Wiggers, I M ade Rian Pradipta Ut am a and Ida Bagus Dharm a Diput ra. Finally, I w ould like t o thank Depart m ent of Education and Culture of Republic of Indonesia for providing financial support .
REFERENCES
Arora, S.P. 1995. Pencernaan M ikroba pada Ruminansia. Gadjah M ada Universit y Press., Yogyakart a.
Ast aw a, I-P. A. 2007. Kecernaan Nut rien dan Produk Ferm ent asi Rum en pada Sapi Bali Penggem ukan yang Diberi Ransum Berbasis Jeram i Padi dengan Suplement asi Vitam in-M ineral M ix. Tesis PS. M agist er Ilm u Pet ernakan, PPs. Univ. Udayana, Denpasar-Bali.
Bart le, S.J., J.R. M ales and R.L. Prest on. 1983. Evaluat ion of urea dilut ion as an est im at or of body composition in m ature cat t le. J. Anim. Sci., 56:410-417.
Direkt orat Perbibit an, Dir.Jen Pet ernakan, Dept an dan PSP3-IPB. 2005. St udi Kelayakan Unit Pelaksana Tyeknis (UPT) Nasional Sapi Bali. Laporan Akhir. Kerjasama Direkt orat Perbibit an Di.Jen Pet ernakan, Dept an dengan PSP3-IPB. Bogor.
Int ernational Atom ic Energy Agency. 1999. Nuclear based t echnology for est im at ing m icrobial prot ein supply in ruminant livest ock. Proceeding of t he second Research Co-ordination M eet ing of a Co-ordinat ed Research Project (Phase 1) organized by t he Joint FAO/ IAEA Division of Nuclear Techniques in Food and Agricult ure and held in Vienna, 24-28 August 1998. IAEA-TECDOC-1093, IAEA, Vienna.
Jouany, J.P. 1991. Rum en M icrobial M et abolism and Ruminant Digest ion. Inst itut National De La Recherche Agronom ique (INRA), Paris.
Kaunang, C.L. 2004. Respon Ruminan t erhadap Pem berian Hijauan Pakan yang Dipupuk Air Belerang. Disert asi, PPs. IPB, Bogor.
M udit a, I-M . 2008. Sint esis Prot ein M ikroba Rumen Sapi Bali yang Diberi Ransum Komplit Berbasis Jerami Padi Am oniasi Urea dengan Suplement asi M ultivit amin-M ineral. Tesis PS. M agist er Ilm u Pet ernakan, PPs. Univ. Udayana, Denpasar-Bali.
M ullik, M .L. 2007. Efficiency of M icrobial Prot ein Synthesis In St eers Fed Freshly Harvest ed Tropical Grass. Conferen on Int ernat ional Agricult ure Research For Development . Universit y of Kassel-Wit zenhausen and Universit y of Got tingen, Oct ober 9-11, 2007. Tropent ag. [cit ed 2008 Februari 15]. Available from : URL:htt p:/ / w w w.bdpunib.org/ jipi/ art iclejipi/ 2006/ 132.pdf.
rskov, E.R. and M . Ryle. 1990. Energy Nut rit ion in Ruminant s. Elsevier Applied Science. London.Part am a, IBG. 2006. Diversifikasi Pakan Sapi Bali. Sem inar Sehari: Prospek Pengem bangan Agrbisnis Sapi Bali di Bali. Prgogram Pascasarjana Ilmu Ternak, Universit as Udayana, Denpasar. Denpasar-Bali, 15 Agustus 2006.
Part am a, IBG., TGO. Susila, I-W. Suarna, dan I-M . Suast a. 2003. Peningkat an produkt ivit as sapi Bali kerem an melalui suplem ent asi m ineral dalam ransum berbent uk w afer
yang berbasis jeram i padi am oniasi urea. Prosiding Sem inar Nasional Revit alisasi Teknologi Kreat if dalam M endukung Agribisnis dan Otonomi Daerah. Puslitbang Sosek Pert anian. Badan Lit bang Pert anian. Depart emen Pert anian. Denpasar-Bali, Oct ober 7, 2003.
Part am a, IBG, I-G. M ahardika, I-W. Suarna, D. N. Suprapt a. 2007a. Penelit ian Peningkat an Produkt ivit as Sapi Bali m elalui Peningkat an Kualitas Ransum Berbasis Bahan Pakan Lokal. Laporan Hasil Penelitian Kerjasam a BAPPEDA Prov. Bali dengan UNUD, Denpasar-Bali.
Part am a, IBG, I-G.L. Oka Cakra, I-W. M athius dan I-K. Sut am a. 2007b. Peningkat an Produkt ivit as Sapi Bali Penggem ukan m elalui Suplement asi M ult i Vit amin dan M ineral dalam Ransum Berbasis Jerami Padi Amoniasi dan Hasil Ikut an Agroindust ri. Laporan Hasil Penelitian Kerjasam a UNUD dengan Sekret ariat Balit bang Pert anian, Dept an.
St eel, R.G.D. and J.H. Torrie. 1986. Principles and Procedures of St at istic. M cGaw -Hill Book Co. Inc., New York.
St ern, M . D., A. Bach and S. Calsamiglia. 2006. New Concept s in Prot ein Nut rition of Ruminant s. 21st Annual Southwest Nutrit ion & M anagement Conference. February 23-24, 2006. Tem pe.
Corresponding author: Dr. Ida Bagus Gaga Partama, Facult y of Animal Husbandry, Udayana Universit y, Denpasar-Bali, Indonesia