An iterative switching heuristic to locate hospitals
and helicopters
Charles C. Branas
a,*, Charles S. Revelle
ba
Department of Biostatistics and Epidemiology, University of Pennsylvania and Philadelphia Veterans Affairs Medical
Center, Philadelphia, PA 19104-6021, USA b
Department of Geography and Environmental Engineering, Johns Hopkins University, Baltimore, MD, USA
Abstract
The Trauma Resource Allocation Model for Ambulances and Hospitals (TRAMAH) was created to guide health planners in locating important and expensive resources. The model’s solution algorithm combines a mixed-integer linear program and a new ‘‘iterative switching’’ heuristic. The TRAMAH has the computational flexibility to optimally locate various numbers of aeromedical depots and trauma centers as separate resources or in tandem. It can be engineered to build a regional trauma system from ‘‘clean slate’’ or to accommodate well-developed trauma systems that are only seeking incremental changes. In this first application of TRAMAH using the Maryland Trauma System, the ‘‘iterative switching’’ heuristic allowed us to obtain solutions within reasonable computer processing times. The TRAMAH can thus help trauma systems improve the survival rates of their most severely injured patients. # 2001 Published by Elsevier Science Ltd.
1. Introduction
Throughout the world, injuries are the leading cause of death during half the human lifespan. In the United States, injuries are the leading cause of death from the first year of life to age 44 [1]. The lifetime costs per injury death are almost four times those for cancer, and more than six times those for cardiovascular disease [2].
In the past decade, guidelines have been developed to contend with injury as a public health problem. One arm of this injury prevention movement has been the development of trauma care systems [3–5]. Although trauma systems have been built on the strategic placement of both hospitals and ambulances, historical precedence and political bias have often hampered their
*Corresponding author. Fax: +1-215-573-5315.
organizational precision [6,7]. The need for a quantitative model of trauma systems has become evident.
The Trauma Resource Allocation Model for Ambulances and Hospitals (TRAMAH) is the first operations research model of its kind for use with trauma care systems. Its solution algorithm uniquely combines mixed-integer programming and a new ‘‘iterative switching’’ heuristic. In this first application of TRAMAH, the Maryland Trauma System is used as a test site. Sufficiently ubiquitous model parameters were, however, selected to promote the use of TRAMAH in other regions. With TRAMAH, planners can be directed to the resource configurations that will best prepare for the needs of their most severely injured residents.
2. Trauma hospitals and helicopters
Before the concept of a trauma system, severely injured patients were transported to the nearest hospital regardless of that hospital’s ability to address their level of injury [8]. Today, trauma systems involve coordinated response plans to ensure appropriate and timely access to dedicated and expert personnel at specialized trauma center hospitals [4,5]. This has been an effective strategy for reducing preventable death and disability due to injury [3,9–15].
Trauma centers were originally inner-city hospitals that had assumed de facto trauma center status [16]. Their development as regional resources, dedicated to serving severely injured patients, was predicated on the adaptation of existing resources in order to provide specialized trauma care services [17–19]. The conversion of community hospitals remains a common and economical strategy to create trauma centers. In Maryland, for example, the estimated cost to convert the typical community hospital into a trauma center in 1994 was $2.3 million, substantially less money than outright construction [4,18,20–26].
Today, trauma centers function at the heart of the U.S. trauma system. They remain a ‘‘safety-net’’ for severely injured individuals despite inconsistent political and financial support [6,27]. Nevertheless, the question of exactly how many trauma centers are necessary to maintain an adequate safety-net remains largely unanswered. The American College of Surgeons estimates that one trauma center per million population is sufficient to address typical volumes of severely injured patients and maintain the expertise of medical providers [4]. This estimate is largely speculative, though, and only provides vague guidance in resolving where and how many trauma centers should be located for a particular region.
Urban areas are well-equipped with an abundance of hospital and ambulance resources while less populated regions continue to be plagued by sparse transportation resources and unusually long distances to trauma centers [28]. For the longest distances and the most severely injured patients, aeromedical services must be employed. The definition of ‘‘aeromedical’’ is the integration of medical treatment with the use of air ambulances. Although both ground and air ambulance services share common military origins, their evolution has been largely independent [29–32]. Single hospital aeromedical programs are most common followed by consortium/ multiple-hospital operated programs and public use programs under the direction of police and fire departments [33].
otherwise distant markets by literally flying patients past the competition. This market-based triage ran counter to traditional medical triage that had first justified the creation of many aeromedical services on the basis of the lives they saved [34–37].
With the advent of hospital reimbursement disincentives in the 1990s, single-hospital air medical programs were suddenly seen as financial burdens. Hospitals were discouraged from filling their beds thereby eliminating the reason to invest further in air ambulance programs [37,38]. Nevertheless, many hospitals still believed that their aeromedical programs had so successfully showcased their institutions that they were willing to continue operating at a loss. Other single hospital air ambulance programs, in order to remain solvent, merged to form free-standing aeromedical consortiums [39].
The costs of implementing a single helicopter program have been reported to be between $2.5 and $4.9 million per year [40,41]. The operating and implementation costs of air ambulance services have been shown to be as much as ten-fold those of ground ambulance services [42]. Collections from patients generally cover less than half of an aeromedical service’s annual operating costs and, as such, programs are often heavily subsidized by their sponsoring hospitals or health systems [42,43]. In Maryland, the estimated cost to create an aeromedical depot was $4.7 million in 1994 [20,26,40,41].
Helicopter response to an injury scene is limited by adverse weather conditions and the availability of a landing zone with adequate clearance for arrival and take-off. In about one-quarter of all flights, a landing zone cannot be established within a reasonable amount of time necessitating rendezvous with ground services at nearby clearings where safe transfer of injured patients can be made. In areas where hospital care is accessible by ground ambulance within 30 minutes, aeromedical transport is not suggested. The typical helicopter travel speed has been estimated to be 120 miles per hour when accounting for take-off time, landing zone appraisal, and on-scene time [43–45]. Except in cases of patient entrapment, it is unusual for time to be spent resuscitating patients on-scene since this can be successfully performed en route to the trauma center. Although helicopters can fly over 400 miles without refueling, most services limit their response distances to 120 miles. Fixed-wing aircraft are often used to transport patients more than 120 miles [34].
3. The trauma resource allocation model for ambulances and hospitals (TRAMAH)
Past emergency medical services analyses have addressed the location of ground ambulances and their destination hospitals [46–54]. Emergency medical services location analysis has, however, never been used to simultaneously locate ambulances and hospitals strictly for trauma. The incorporation of location techniques that have proven beneficial to the patient broadly in need of emergency care would also be of value in addressing the more specific needs of the trauma patient.
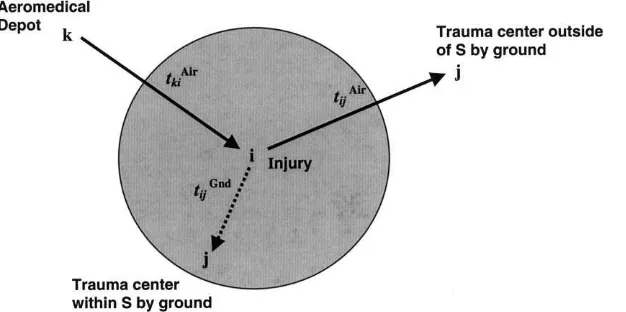
service (ground service and air service) within some time standard,S, must be counted as lacking
coverage in the statement of the objective function. That is, an injury,i, is considered covered if:
1. at least one TCis sited within a time standard, S, by ground, or
2. an (AD, TC) pair is sited in such a way that the sum of the flying time from the AD toiplus the
flying time from ito the TCis within the same time standard, S.
Using this definition for coverage, TRAMAH can be stated as the maximization of the sum of covered demands,
yi=1 if demand nodei is covered by air or ground, 0 otherwise;
ai=population demand at nodei;
vi=1 if demand node i is covered by ground, 0 otherwise;
ui=1 if demand nodei is covered by air, 0 otherwise;
I=the set of demand nodes,i;
xjTC=1 if a TCis sited at nodej, 0 otherwise;
J=the set of eligible TClocations;
xkAD=1 if an AD is sited at node k, 0 otherwise;
K=the set of eligible AD locations;
zkj=1 if an AD is sited at nodek and a TCis sited at nodej, 0 otherwise;
pTC=the number of TCs to be sited;
pAD=the number of ADs to be sited;
Ni={jjtijGS}=TCsites within the time standard, S, of node i by ground; and
Mi={ (j, k)j(tkiA+tijA)S}=TC/AD pairs within the time standard,S, of i by air.
The problem was assessed on a network of travel arcs and geographic nodes wheretijG is the
driving time from nodeito nodej,tijAis the flying time from nodeito nodej, andtkiAis the flying
time from node kto nodei. (See Fig. 1.) The previously mentioned (AD, TC) pairs are denoted
above aszkj. It is also important to note that only constraints (5) and (6) above were calculated
relative to the time standard,S; the remaining constraints were not influenced by the selection of
S. The time standard,S, could also be changed to reflect different levels of coverage urgency. Not
them, although all nodes in the network were considered as potential locations where an injury could occur and would thus require coverage by the trauma system.
4. Testing the solution algorithm
The TRAMAH was solved using the revised simplex algorithm, a variant of the original simplex procedure [60]. For purposes of this study, CPLEX Version 1.2 (1990 CPLEX Optimization Incorporated, Houston, Texas) with a branch-and-bound add-on was used to solve TRAMAH. In most cases, the application of the revised simplex algorithm to solve TRAMAH ended in fractional, noninteger solutions. The CPLEX Mixed-Integer Optimizer recognizes mixed-integer submissions and automatically resorts to a branch-and-bound algorithm to resolve fractional solutions although special steps need to be taken in most cases to insure solutions within reasonable processing times [61].
Submissions to CPLEX were written using Fortran 77. Each submission was formulated for two different time standards, 15 and 30 min, and 100 different combinations of numerical resources up to ten TCs and ten ADs. Using Maryland ZIP codes, 32 eligible TC sites (because of either existing TCs or adaptable community hospitals) and 385 eligible AD sites were considered in testing TRAMAH. Hospital discharge data were obtained from the Maryland Health Services Cost Review Commission and vital statistics data were obtained from the Maryland Department of Health and Mental Hygiene for the years 1992, 1993, and 1994 [20]. Injury Severity Scores were calculated using a computerized conversion table that translates ICD-9-CM discharge diagnoses into Abbreviated Injury Scale Scores [62]. Severely injured patients were defined as those having an Injury Severity Score of greater than 15 or as having died due to trauma [63].
Rand-McNally TripMaker Version 1.0 (1994 Rand-McNally and Company, Skokie, Illinois) was used to calculate optimized shortest driving times. This was done by setting the interstate road travel speed to 60 miles per hour, the US highway travel speed to 50 miles per hour, and the
state road travel speed to 40 miles per hour. These speeds were set lower than usual in an attempt to account for ground ambulance scene times and delays enroute. Town names and landmarks
(for larger cities and towns) were used to calculate the inter-ZIP code driving times of a (32385)
ground travel matrix.
Using TRAMAH, trauma centers were placed with respect to severely injured patients and the explicit location of aeromedical depots. The locations of ground ambulance depots were implicitly considered. This is a consideration that is both realistic and advantageous in analyzing state trauma systems because the number of ground ambulance depots at the state level is prohibitively large and only a relatively small percentage of ground ambulance transports are devoted to severe trauma. The explicit placement of ground ambulances is, thus, a mathematically impractical endeavor at the present time.
In subregions with trauma centers, the accompanying proliferation of ground ambulances allows for depot-to-scene response times that average approximately 5 minutes [64,65]. Because ground ambulance depot-to-scene information was excluded in the first half of the TRAMAH algorithm, it was assumed that in subregions where trauma centers were sited, ground ambulance depots would be a few minutes away from the scene of injury. These few minutes were considered negligible lengths of time compared to the overall standard for both ground and air and were rationalized by setting ground ambulance travel speeds lower than usual. In this way, TRAMAH
indirectly accounted for an otherwise impractical task}the location of an unwieldy hierarchy of
ground ambulances for the entire State of Maryland.
Longitude and latitude coordinates were used to calculate Euclidean distances between ZIP
code centroids. Inter-ZIP code flying times were then calculated in a (385385) air travel matrix
assuming an air-speed of 120 miles per hour [43]. All computations were done using a Silicon Graphics MIPS R4400 mini-computer (1987–1994 Silicon Graphics Inc., Mountain View, California) with a 200 MHz processor and 64 megabytes of RAM.
CPLEX permits the assignment of branching priorities to some or all of the integer variables in a problem. Priority ordering of several different integer variable groupings was attempted in more efficiently solving TRAMAH. In a few of the problems that sited small numbers of TCs and ADs, priority ordering of the branch-and-bound method resulted in reduced solution times. However, the remaining majority of problems did not have their solution times reduced by priority ordering. Rather, no solutions were attainable within a reasonable amount of time for these problems. Therefore, most problem solutions were unattainable within a reasonable amount of computer processing time using the CPLEX variant of the simplex algorithm and branch-and-bound.
To remedy this, a heuristic incorporating vertex substitution (one-opt interchange) with an iterative switching mechanism was developed for two purposes [66]. The first was as a stand-alone methodology for very large problems. The second purpose was to obtain a reduced set of eligible AD and TCsites for resubmission to CPLEX as condensed integer programming formulations. This ‘‘heuristic concentration’’ approach produced all nonfractional solutions within acceptable computer processing times [67,68].
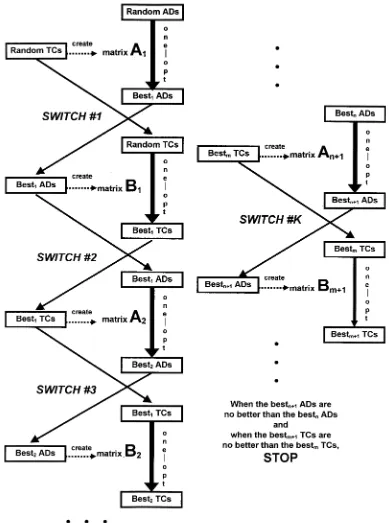
The basic mechanism of the iterative switching heuristic was a series of one-opt substitutions. In the first of these, the best AD sites were identified, holding the TCsites fixed. The best TCsites were then identified, holding the AD sites fixed. These two steps were then repeated until no one-opt substitutions yielded further improvement. The sites were locally one-optimal in the sense that further repetition of the exchange procedure in the heuristic produced no improvement of the objective value. (See Fig. 2.) The specific steps of the iterative switching heuristic proceeded as follows:
4.1. Create the first matrix (A1)ki
Formulation of the first matrix (A1)kiwas begun by randomly selectingmTCsites. ThesemTC
sites remained fixed throughout the manipulation performed on (A1)ki. The (A1)ki matrix
contained the minimum values between gi and (tkiA+hi) in each cell. It appeared as follows:
ðA1Þki ¼
wheregiis the driving time from demand nodeito the closest eligible TC, andhiis the flying time
from demand nodeito the closest eligible TC. To eachhiwas added the flying time from the ZIP
code it represented to each of the other 385 ZIP codes, tkiA. Thus, (A1)ki contained the fastest
travel times, by either ground or air, given the fixed positions of a random set of mTCsites.
4.2. Perform a one-opt substitution using the first matrix (A1)ki
A one-opt substitution algorithm was then performed using the (A1)ki matrix. The procedure
began by randomly selecting an initial set ofnout of the 385 columns in (A1)kito represent eligible
AD sites. Correspondingly, ZIP codes were represented as rows in (A1)ki. For each row, if any of
its elements intersecting the selectedncolumns was less than the time standard, then the ZIP code
that this row represented was considered covered. The populations of severely injured patients within all covered ZIP codes were then summed to obtain a current objective value as achieved by
the current collection of ncolumns.
Following this, the first of the n selected columns was successively replaced with each of the
remaining nonselected columns, and the objective value recalculated each time until the nonselected column replacement that most improved the objective was obtained. This substitution
procedure was then repeated column by column for all n columns. The final best objective that
resulted from the substitution procedure was recorded alongside the final set of n columns,
representing thenlocally best eligible AD sites that produced it given the initial placement of TCs.
4.3. Execute switch ]1 and create the second matrix (B1)ij
Then best AD sites found using the previous one-opt substitution were then used to create a
second matrix, (B1)ij. ThesenAD sites remained fixed throughout the manipulation of (B1)ij. The
(B1)ij matrix contained the minimum values betweenqi and (riþtAij) in each cell. It appeared as
where qi is the driving time from demand node i to the closest eligible TCand ri is the flying
time from the closest eligible AD site to demand node i. To each ri was added the flying time
from the ZIP code it represented to each of the other 385 ZIP codes, tA
ij. Thus, (B1)ij contained
the fastest travel times, by either ground or air, given the fixed positions of a best set of n
AD sites.
4.4. Perform a one-opt substitution using the second matrix (B1)ij
A second one-opt substitution algorithm was then performed using the (B1)ij matrix. This
began by randomly selecting an initial set of m out of the 385 columns in (B1)ij to represent
eligible TCsites. Correspondingly, ZIP codes were represented as rows in (B1)ij. For each
row, if any of its elements intersecting the selected m columns was less than the time standard,
then the ZIP code that this row represented was considered covered. The populations of severely injured patients within all covered ZIP codes were then summed to obtain an objective value.
Following this, the first of them selected columns was successively replaced with each of the
remaining nonselected columns, and the objective value recalculated each time until the nonselected column replacement that most improved the objective was obtained. This substitution
procedure was then repeated column by column for all mcolumns. The final best objective that
resulted from the substitution procedure was recorded alongside the final set of m columns,
representing the mbest eligible TCsites that produced it given the initial set of ADs.
4.5. Execute switch ]2 and repeat steps (1) to (2)
A second ‘‘switch’’ was then performed to recreate the first matrix (A2)kias before using them
best TCsites (as opposed to mrandom TCsites) obtained previously. The one-opt substitution
algorithm was then performed on the (A2)kimatrix using thenbest AD sites obtained previously
4.6. Execute switch ]3 and repeat steps (3) to (4)
A third ‘‘switch’’ was then performed to recreate the second matrix (B2)ij as before using this
new set of then best AD sites. After another one-opt substitution algorithm on the (B2)ijmatrix
using the mbest TCsites obtained previously, a new set of thembest TCsites was produced.
4.7. Continue repeating until the objectivevalues do not improve
When the best set ofm+1 TCsites was no better than the previous best set ofmTCsites, and
the best set ofn+1 AD sites was no better than the previous best set ofnAD sites (as determined
by their accompanying objective values), the iterative switching procedure was viewed as
stabilized and thus stopped. The best m TCand n AD sites were then recorded alongside the
accompanying best objective value.
4.8. Repeat steps (1) to (7) 100 times and union the top ten results
The entire process was repeated 100 times. The union of the sets ofmTCand nAD sites was
formed for the top ten out of the 100 best objective values that resulted. These unioned sets were the final concentration sets of eligible AD and TCsites, these were then used for resubmission to CPLEX.
In the event that the concentration set obtained for use with one of the time standards was too large, a new run of the heuristic was performed using a smaller number of initial TCs and ADs, such as seven and seven as opposed to 10 and 10. A new run of the heuristic was also used when maximally covered objective values repeated themselves, making the union of the top ten objective values of little consequence in obtaining sufficiently reduced concentration sets of AD and TC sites.
5. Results from Maryland
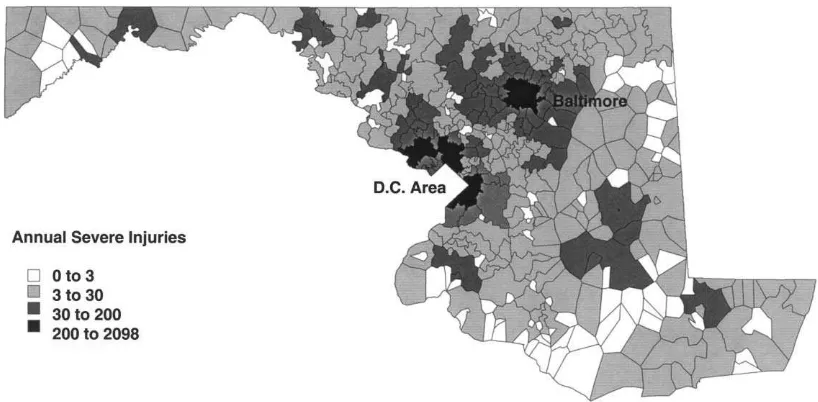
A total of 26,774 severe injuries were considered for coverage. Two high-volume clusters, in the Baltimore and metropolitan Washington, DCareas, formed a bicentric distribution of serious injuries in Maryland (see Fig. 3). The TRAMAH always sited a TCnear Baltimore because of the high number of serious injuries that had occurred there over the three-year study period. Because service capacity considerations were outside the scope of TRAMAH, we made the assumption that the four TCs currently in Baltimore were necessary due to the potential for congestion at any single facility. The TCsite that covered Baltimore was therefore constrained to represent four TCs.
Applying TRAMAH to the Maryland Trauma System produced two types of results. The first type assumed that no existing trauma care resources were present: TCs and ADs were thus located as if the state were a ‘‘clean slate’’. The second type began with the existing configuration of TCs and ADs and utilized TRAMAH to make incremental changes.
iterative switching heuristic successfully reduced the numbers of eligible sites. Beginning with five TCsites and five AD sites, the union of the top 10 out of 100 objective values produced a TC concentration set of 15 sites and an AD concentration set of 37 sites. These two concentration sets produced solutions in all of the 100 problems for the 30-min response time standard. The problem utilizing the concentration sets of 15 eligible TCand 37 eligible AD sites contained 2266 constraints and 1764 variables.
The number of branch-and-bound nodes among all 100 problems for the 30-min response time standard ranged from 22 to 20,497 nodes. Solution times ranged from 3 min for the 22-node problem to over 2 h for the 20,497-node problem. The number of nodes increased and then decreased as more TCs and ADs were sited. The highest numbers of nodes were among problems from six to seven TCsites and from three to five AD sites.
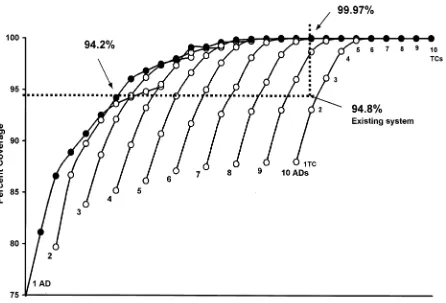
The percentage of serious injuries covered within 30 min ranged from a low of 74.7% to a maximum of 100% for ten TCand ten AD sites (see Table 1). The citing of seven TCand seven AD sites using TRAMAH achieved complete coverage of all ZIP codes. Resource configurations for greater than seven TCand seven AD sites also achieved 100% coverage, although sometimes with completely different resource configurations. This same information is displayed as an investment-versus-coverage graph assuming that the cost of a typical AD site is approximately twice the cost of converting the typical Maryland community hospital into a TC(see Fig. 4).
As a stand-alone analysis, the heuristic procedure sampled a relatively small number of the potential solutions in each clean slate problem. A comparison between the heuristic in a stand-alone capacity and the previous percent coverage figures for the 30-min response time standard was performed for ten select, noninferior solutions. As more facilities were sited, the disparity between the heuristic alone and the integer program plus the heuristic increased (see Table 2).
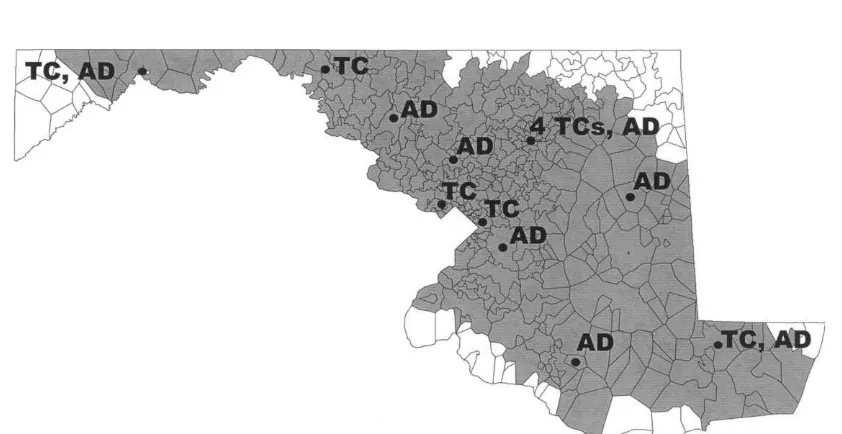
The existing Maryland Trauma System, consisting of six TCsites (nine TCs) and eight AD sites, covers 94.8% of severe injuries within 30 min (see Fig. 5). For the same number of resources, nine
Table 1
Percent coverage within 30 min for different combinations of trauma centers and aeromedical depots (bold cells represent noninferior solutions). Note that the first trauma center site represents four trauma centers
TCsites (#) AD sites
1 2 3 4 5 6 7 8 9 10
1(4) 74.74% 79.66% 83.81% 85.16% 86.12% 87.09% 87.50% 87.77% 87.94% 88.007% 2(5) 81.10 86.67 88.64 89.62 90.70 91.70 92.62 92.90 93.03 93.079 3(6) 86.58 89.73 92.11 93.22 94.35 94.98 95.26 95.74 96.01 96.146 4(7) 88.87 92.02 94.40 95.51 96.63 97.59 98.10 98.41 98.68 98.738 5(8) 90.69 94.19 96.16 97.33 98.29 99.13 99.59 99.69 99.75 99.79 6(9) 92.50 96.01 97.35 99.07 99.27 99.87 99.93 99.97 100.0 100.0 7(10) 93.61 96.81 97.99 99.14 99.83 99.94 100.0 100.0 100.0 100.0 8(11) 94.24 97.46 98.58 99.59 99.91 100.0 100.0 100.0 100.0 100.0 9(12) 94.80 97.87 98.99 99.65 99.97 100.0 100.0 100.0 100.0 100.0 10(13) 95.27 98.11 99.10 99.70 99.97 100.0 100.0 100.0 100.0 100.0
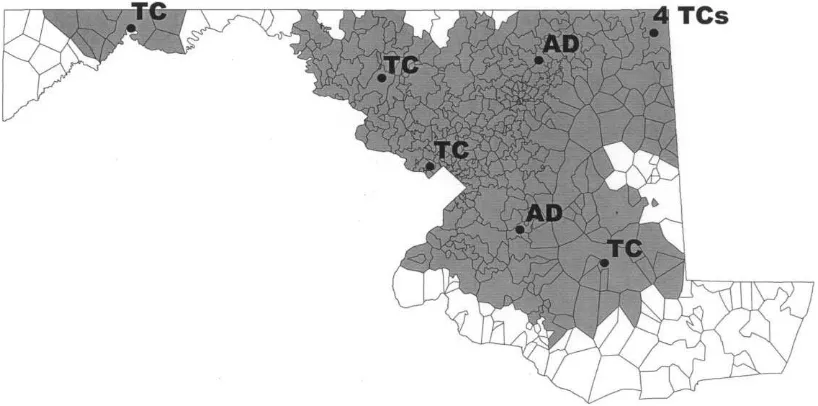
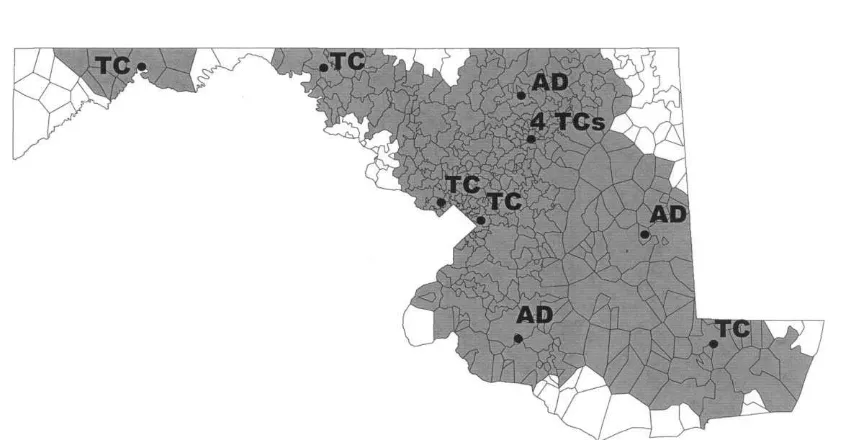
TCs and eight ADs, the clean slate approach achieved a coverage objective of 99.97% within 30 min. Only one small, north-central ZIP code with about three severe injuries per year was left uncovered (see Fig. 6). The existing system had 56 uncovered ZIP codes. For one less TCand six fewer ADs, TRAMAH achieved a coverage objective of 94.2% within 30 min, roughly the same as the existing system (see Fig. 7).
Using TRAMAH, incremental changes to the Maryland Trauma System were assessed with the nine TCs in the system stationary and then with the eight ADs stationary. In both cases, reduced
Table 2
Comparison of solutions between heuristic-assisted integer programming and the heuristic procedure as a stand-alone analysis
Number of TCsites
Number of AD sites
Percent coverage with heuristic-assisted IP
Percent coverage with heuristic alone
1 1 74.74% 74.61%
2 1 81.10 81.10
3 1 86.58 84.46
4 1 88.87 86.12
5 1 90.69 87.39
5 2 94.19 91.17
6 2 96.01 91.51
7 2 96.81 94.76
8 2 97.46 95.49
7 3 97.99 96.06
problem sizes made fully optimal solutions possible, obviating the assistance of the iterative switching heuristic.
Holding in place the nine TCs of the existing system, approximately the same percent coverage as the existing system was achieved within 30-min by optimally locating two to three ADs, as opposed to retaining the eight of the existing system (see Table 3 and Fig. 8).
Fig. 6. For the same number of resources as the existing system, the clean slate approach achieved a coverage objective of 99.97% within 30 min.
Optimally locating the eight ADs used in the existing system would provide coverage to 99.7% of the serious injuries in Maryland within 30-min. This is an improvement of 4.9%, or 438 serious injuries additionally covered per year, over the existing system.
Holding in place the eight ADs of the existing system, TCsites were eliminated one and two at a time and then optimally replaced using TRAMAH. On average, the optimal replacement of a single TCsite increased coverage by 1.68% for the 30-min response time standard. Similarly, the optimal replacement of two TCsites increased coverage by an average of 2.85%. The most effective TCreplacement was shown to cover an additional 415 severely injured persons per year.
Table 3
Percentage coverage achieved for the optimal location of up to eight aeromedical depots assuming that the nine trauma centers of the existing Maryland Trauma System have not been moved
Optimally located aeromedical depots Percent coverage within 30-min
0 80.52%
1 88.37
2 93.53
3 96.02
4 97.59
5 98.42
6 99.13
7 99.51
8 99.71
6. Conclusions
The ‘‘medical arms race’’ among trauma systems has produced organizational hypertrophy yet offered little marginal benefit to the public health [69–73]. Failure to limit the number of trauma centers based on demonstrated geographic need remains the most common trauma system deficiency [6,7,74]. Hospitals that satisfy clinical intra-facility requirements continue to be granted trauma center status with little systematic assessment of their relationship to ambulance facilities or their likely impact on regional demands.
Attempts in the early 1980s to recognize and close surplus trauma facilities did little to restrain the growth of trauma systems. As of 1993, 21 states were served by legally authorized statewide or regionally-based trauma systems. The short-lived funding provided by the 1990 Trauma Systems Development Act (PL-101-590) encouraged an additional 19 states to initiate publicly administered trauma systems of their own [5,6,75]. Geographic standards and reduction of duplicative resources are vital to the continued existence of solvent trauma systems.
The technical tools used to geo-spatially assess trauma system resources are often crude. Even a moderately sized region with the intent of citing a small number of resources can generate many more configuration choices than can effectively, much less optimally, be evaluated by the current technology. Quantitative location techniques, such as TRAMAH, produce optimal or near-optimal solutions faster and more efficiently compared with human judgment alone. In the case of Maryland, the full TRAMAH assessed over 50,000 possible location combinations for the citing of five aeromedical depot/trauma center pairs. Systems of linear equations this large are beyond the scope of human judgment alone.
The TRAMAH has the computational flexibility to optimally locate various numbers of aeromedical depots and trauma centers as separate resources, or in tandem. It can thus be engineered to build a regional or state trauma system from a ‘‘clean slate’’ as well as to accommodate partially-developed or well-developed systems that are only seeking incremental changes to their system.
From ‘‘clean slate’’, TRAMAH produced near-optimal results using an iterative switching heuristic and integer programming. The use of TRAMAH to relocate the existing nine TCs and eight ADs from clean slate covered nearly all the state’s severely injured residents. Conversely, Maryland could have retained its current level of coverage with eight optimally located TCs and two optimally located ADs.
specifically tailored for use with a maximum covering problem that sought to locate two types of facilities making a single-facility heuristic inapplicable.
A well-developed trauma system like Maryland’s could also use TRAMAH to guide incremental decisions. However, this would not require the iterative switching heuristic because only one facility type is incrementally sited while the locations of the other facility type are held in place. In this regard, optimally relocating all eight existing ADs with TRAMAH could offer access to hundreds of severely injured residents each year for the relatively small price of moving resources that pose relatively few obstacles to relocation. At the very least, Maryland could reap the financial benefits of eliminating five of its existing eight ADs, optimally relocate the remaining three, and still maintain approximately the same level of access within 30 min. Although the relocation of TCs is more difficult than that of ADs, TRAMAH could also guide health planners to the best candidate sites should the decision be made to de-designate existing trauma centers and/or newly designate existing community hospitals as trauma centers.
Trauma systems must be balanced by trauma resource investments that efficiently protect the health of the community. The TRAMAH, which incorporates integer programming and a new iterative switching heuristic, is a powerful tool that can help trauma systems achieve this balance and improve the survival of their most grievously injured patients.
References
[1] Baker SP, O’Neill B, Ginsburg MJ, Li G. In: The injury fact book. 2nd ed. New York: Oxford University Press, 1992, p. 9–11.
[2] Rice DP, MacKenzie EJ, and Associates.Cost of Injury in the United States: A Report to Congress. Institute for
Health & Aging, University of California and Injury Prevention Center, The Johns Hopkins University, San Francisco, 1989, p. xxiv.
[3] Kaufmann CR. How DTEMs (Division of Trauma and Emergency Medical Systems) is working toward optimal trauma care [interview by Cynthia A. Brown]. Bulletin of the American College of Surgeons 1995;80(6):19–23. [4] Committee on Trauma American College of Surgeons. In: Resources for optimal care of the injured patient: 1993,
p. 133
[5] US Public Health Service, Health Resources Services Administration, Division of Trauma Emergency Medical Systems. Model Trauma Care System Plan. September 1992. pp. 74.
[6] Bazzoli GJ, Madura KJ, Cooper GF, MacKenzie EJ, Maier RV. Progress in the development of trauma systems in the United States. Results of a National Survey. Journal of the American Medical Association 1995;273(5): 395–401.
[7] Trunkey DD, The Coalition for American Trauma Care. Testimony before the Subcommittee on Health and the Environment, US House of Representatives, Jan 1994, 11 pp.
[8] Gibson G. Categorization of hospital emergency capabilities, some empirical methods to evaluate appropriateness of emergency department utilization. Journal of Trauma 1978;18(2):94–102.
[9] West JG, Cales RH, Gazzaniga AB. Impact of regionalization, The Orange County experience. Archives of Surgery 1983;118(6):740–744.
[10] Cales RH. Trauma mortality in Orange County, the effect of implementation of a regional trauma system. Annals of Emergency Medicine 1984;13(1):1–10.
[11] Shackford SR, Hollingworth-Fridlund P, Cooper GF, Eastman AB. The effect of regionalization upon the quality of trauma care as assessed by concurrent audit before and after institution of a trauma system, a preliminary report. Journal of Trauma 1986;26(9):812–820.
[13] Guss DA, Meyer FT, Neuman TS, Baxt WG, Dunford Jr JV, Griffith LD, Guber SL. The impact of a regionalized trauma system on trauma care in San Diego County. Annals of Emergency Medicine 1989;18(11):1141–1145. [14] Kane G, Wheeler NC, Cook S, Englehardt R, Pavey B, Green K, Clark ON, Cassou J. Impact of the Los Angeles
County Trauma System on the survival of seriously injured patients. Journal of Trauma 1992;32(5):576–583. [15] Mullins RJ, Veum-Stone J, Helfand M, Zimmer-Gembeck M, Hedges JR, Southard PA, Trunkey DD. Outcome
of hospitalized injured patients after institution of a trauma system in an urban area. Journal of the American Medical Association 1994;271(24):1919–1924.
[16] Champion HR, Mabee MS. In: An American crisis in trauma care reimbursement, 1990. p. 59. [17] Anonymous. Burn Care Facilities in Southern New Jersey, 1975, [NTIS HRP-0004532], 24. pp.
[18] Williams MJ. Finance. In: Cales RH, Heilig RW, editors. Trauma Care Systems, A guide to planning, implementation, operation, and evaluation. Rockville, MD: Aspen, 1986. p. 293–309.
[19] McClure W. Reducing excess hospital capacity, Bureau of Health Planning and Resources Development, US Public Health Service, National Technical Report, October 15, 1976.
[20] Branas CC. In: A Trauma Resource Allocation Model for Ambulances and Hospitals. Ann Abor: UMI Dissertation Services, 1997. p. 225.
[21] American Hospital Association. In: Guide to the Health Care Field, 1995–96. p. A184–A189.
[22] Anderson GF. What does not explain the variation in the direct costs of graduate medical education. Academic Medicine 1996;71(2):164–169.
[23] Roye WP, Dunn EL, Watermeyer DS, Gossard WH. Postgraduate trauma education, the surgeon, the cost. Journal of Trauma 1989;29(11):1471–1475.
[24] Anderson GF, Lave JR, Russe CM, Neuman P. In: Providing hospital services, the changing financial environment. Baltimore, MD: The Johns Hopkins University Press, 1989. p. 101–110.
[25] Godfrey RS. Building Construction Costs Data. Kingston, MA: Means, 1987.
[26] Rowland HS, Rowland BL. In: Hospital administration handbook. Rockville, MD: Aspen, 1984. p. 334. [27] Frumkin K. ‘‘What’s in a name?’’, ‘‘Moonlighting for fun and profit’’, reflections on the state of emergency
medicine}a goal for 2000 and beyond,Annals of Emergency Medicine, 1992, 21(7), 862–4, 118–21.
[28] Spaite DW, Valenzuela TD, Meislin HW, Criss EA, Hinsberg P. Prospective validation of a new model for evaluating emergency medical services systems by in-field observation of specific time intervals in prehospital care. Annals of Emergency Medicine 1993;22(4):638–645.
[29] Lacey SW. The arts of war and medicine, a study in symbiosis. American Journal of Medical Science 1993;305(6):407–420.
[30] Gabriel RA, Metz KS, A history of military medicine from the renaissance through modern times. Vol. 2. New York: Greenwood Press, 1992. p. 215–68.
[31] Barkley KT. In: The story of emergency transportation of sick and wounded through the centuries. Hicksville, New York: Exposition Press, 1978. p. 25–30.
[32] Neel S. In: Medical support of the US Army in Vietnam, 1965–1970. Washington, DC: US Government Printing Office, 1973. p. 49–79.
[33] Gabram SGA, Jacobs LM, Garramone RR. Ground and air emergency transport. In: Cayten CG, editor. Emergency Medicine, 1989. p. 3157–3169.
[34] Urdaneta LF, Miller BK, Ringenberg BJ, Cram AE, Scott DH. Role of an emergency helicopter transport service in rural trauma. Archives of Surgery 1987;122(9):992–996.
[35] Baxt WG, Moody P. The impact of a rotorcraft aeromedical emergency care service on trauma mortality. Journal of the American Medical Association 1983;249(22):3047–3051.
[36] Boyd CR, Corse KM, Campbell RC. Emergency interhospital transport of the major trauma patient, air versus ground. Journal of Trauma 1989;29(6):789–794.
[37] Fallon MJ, Copass M. Southeast Alaska to Seattle emergency medical air transports, demographics, stabilization, and outcomes. Annals of Emergency Medicine 1990;19(8):914–921.
[38] Yale CM. Financial planning, an essential strategy for air medical survival. Topics in Emergency Medicine 1994;16(4):38–44.
[39] Long D. Air medical consortiums, where to begin. Topics in Emergency Medicine 1994;16(4):60–65.
[41] Long D. Air medical consortiums, where to begin. Topics in Emergency Medicine 1994;16(4):60–65.
[42] Office of Technology Assessment. In: Report on Emergency Medical Services in the United States, 1989. p. 102.
[43] Burney RE, Fischer RP. Ground versus air transport of trauma victims, medical and logistical considerations. Annals of Emergency Medicine 1986;15(12):1491–1495.
[44] Johnson R, Falcone RE, Janczak R, Air transport for illness, is it appropriate? Journal of Emergency Medical Services 1993;53–6.
[45] Gervin AS, Fischer RP. Importance of prompt transport of salvage of patients with penetrating heart wounds. Journal of Trauma 1982;22(6):443–448.
[46] Lazarus SS. Using systems performance data for ambulance management. Medical Research Engineering 1972;12(4):8–11.
[47] Aly AA, White JA. Probabilistic formulation of the emergency service location problem. Journal of the Operational Research Society 1978;29(12):1167–1179.
[48] Neebe AW. A procedure for locating emergency-service facilities for all possible response distances. Journal of the Operational Research Society 1988;39(8):743–748.
[49] Cook WD. A model for the evacuation of casualties from a field hospital during a crisis. Operational Research Quarterly 1977;28(4ii):963–974.
[50] Singh VK, Chandran AJ, Dey BR. Operation research for the estimation of ambulance requirement in a hospital. Computer Methods and Programs in Biomedicine 1990;33:59–63.
[51] ReVelle C, Bigman D, Schilling D, Cohon J, Church R. Facility location, a review of context-free and EMS models. Health Services Research 1977;Summer:129–146.
[52] Berlin GN, ReVelle CS, Elzinga DJ. Determining ambulance-hospital locations for on-scene and hospital services. Environmental and Planning A 1976;8:553–561.
[53] Aubin J. Scheduling ambulances. Interfaces 1992;22(2):1–10.
[54] ReVelle C. Citing ambulances and fire companies, new tools for planners. Journal of the American Planning Association 1991;Fall(574):471–484.
[55] Marianov V, ReVelle C. Citing emergency services. In: Drezner Z, editor. Facility location: a survey of applications and models. [New York: Springer-Verlag, 1995. p. 199–223.
[56] Moore GC, ReVelle C. The hierarchical service location problem. Management Science 1982;28(7):775–780. [57] ReVelle C, Toregas C, Falkson L. Applications of the location set-covering problem. Geographical Analysis
1976;8:65–76.
[58] Church RL, ReVelle CS. The maximal covering location problem. Papers of the Regional Science Association 1974;32:101–118.
[59] Schilling D, Elzinga DJ, Cohon J, Church R, ReVelle C. The Team/Fleet models for simultaneous facility and equipment citing. Transportation Science 1979;13(2):163–175.
[60] Nering ED. Linear programs and related problems. Boston: Academic Press, 1993.
[61] Efroymson M, Ray T. A branch-bound algorithm for plant location. Operations Research 1966;14:361–366. [62] MacKenzie EJ, Steinwachs DM, Shankar B. Classifying trauma severity based on hospital discharge diagnoses,
Validation of an ICD-9CM to AIS-85 conversion table. Medical Care 1989;27(4):412–422.
[63] Pollock DA, McClain PW. Report from the 1988 Trauma Registry Workshop, including recomendations for hospital-based trauma registries. Journal of Trauma 1989;29:827–834.
[64] Pepe PE, Wyatt CH, Bickell WH, Bailey ML, Mattox KL. The relationship between total prehospital time and outcome in hypotensive victims of penetrating injuries. Annals of Emergency Medicine 1987;16(3):293–297. [65] Feero S, Hedges JR, Simmons E, Irwin L. Does out-of-hospital EMS time affect trauma survival? American
Journal of Emergency Medicine 1995;13(2):133–135.
[66] Teitz MB, Bart P. Heuristic methods for estimating the generalized vertex median of a weighted graph. Operations Research 1968;16:955–961.
[67] ReVelle CS, Whitlatch EE, Wright JR. Integer programming and network problems } Part II. In: Civil and Environmental Systems Engineering. Englewood CVliffs, NJ: Prentice-Hall, 1997. p. 152–159.
[69] McClure W. Reducing excess hospital capacity, Bureau of Health Planning and Resources Development, US Public Health Service, National Technical Report, October 15, 1976.
[70] Auster RD, Leveson I, Sarachek D. The production of health, an exploratory study. Journal of Human Resources 1969;4:411–436.
[71] Folland S, Goodman AC, Stano M. In: The economics of health and health care. 2nd ed. Upper Saddle River, NJ: Prentice Hall, 1997. p. 101–148.
[72] Fuchs V, Some economic aspects of mortality in developed countries, The Health Economy 1986;181–99. [73] Luft HS, Robinson JC, Garnick DW, Maerki SC, McPhee SJ. The role of specialized clinical services in
competition among hospitals. Inquiry 1986;23:83–94.
[74] Aprahamian C, Wolferth Jr CC, Darin JC, McMahon J, Weitzel-DeVeas C. Status of trauma center designation. Journal of Trauma 1989;29(5):566–570.
[75] Wolfberg DM, McMenamin D, Beadle MR, Kaufmann CR, Braslow JB. Granting better care, a federal renaissance in trauma care systems. Emergency 1993;May:27–31.