Global Employment Trends 2012
Preventing a deeper jobs crisis
Copyright © International Labour Organization 2012 First published 2012
Publications of the International Labour Oice enjoy copyright under Protocol 2 of the Universal Copyright Conven-tion. Nevertheless, short excerpts from them may be reproduced without authorization, on condition that the source is indicated. For rights of reproduction or translation, application should be made to ILO Publications (Rights and Permis-sions), International Labour Oice, CH-1211 Geneva 22, Switzerland, or by email: [email protected]. he International Labour Oice welcomes such applications.
Libraries, institutions and other users registered with reproduction rights organizations may make copies in accordance with the licences issued to them for this purpose. Visit www.ifrro.org to ind the reproduction rights organization in your country.
he designations employed in ILO publications, which are in conformity with United Nations practice, and the presen-tation of material therein do not imply the expression of any opinion whatsoever on the part of the International Labour Oice concerning the legal status of any country, area or territory or of its authorities, or concerning the delimitation of its frontiers.
he responsibility for opinions expressed in signed articles, studies and other contributions rests solely with their authors, and publication does not constitute an endorsement by the International Labour Oice of the opinions expressed in them.
Reference to names of irms and commercial products and processes does not imply their endorsement by the International Labour Oice, and any failure to mention a particular irm, commercial product or process is not a sign of disapproval. ILO publications and electronic products can be obtained through major booksellers or ILO local oices in many coun-tries, or direct from ILO Publications, International Labour Oice, CH-1211 Geneva 22, Switzerland. Catalogues or lists of new publications are available free of charge from the above address, or by email: [email protected]
Visit our website: www.ilo.org/publns
Photocomposed in Switzerland WEI
Printed in Switzerland SRO
Global Employment Trends 2012 / International Labour Oice – Geneva: ILO, 2012 1 v.
ISBN 978-92-2-124924-5 (print) ISBN 978-92-2-124925-2 (web pdf)
International Labour Oice
employment / unemployment / labour force participation / economic recession / developed countries / developing countries
13.01.3
Also available in French, Tendances mondiales de l’emploi 2012 (978-92-2-224924-4), Geneva, 2012, and Spanish, Tendencias Mundiales del Empleo 2012 (978-92-2-324924-3), Geneva, 2012.
Contents 3
Acknowledgements . . . 7
Executive summary . . . 9
1. he macroeconomic outlook is deteriorating . . . 15
he global economy has been weakening rapidly . . . 15
Short-term outlook . . . 15
Forces acting over the medium term . . . 23
Scenarios and policy responses . . . 27
2. Global labour market situation . . . 31
Unemployment and labour force participation . . . 31
Employment and labour productivity . . . 35
Working poverty and vulnerable employment . . . 41
A grim outlook for global labour markets . . . 44
3. Regional economic and labour market developments . . . 45
Developed Economies and European Union . . . 45
Central and South-Eastern Europe (non-EU) and CIS . . . 52
Latin America and the Caribbean . . . 56
East Asia . . . 59
South-East Asia and the Paciic . . . 64
South Asia . . . 67
Middle East . . . 71
North Africa . . . 73
Sub-Saharan Africa . . . 77
4. Policy options for growth with jobs . . . 83
A recap of jobs lost to the crisis . . . 83
A worsening youth employment crisis . . . 84
he global prospects for jobs . . . 84
Macro policy options to promote growth with jobs . . . 84
Bibliography . . . 89
Annexes 1. Global and regional tables . . . 91
2. Projections . . . 103
3. Regional igures . . . 105
4. Note on global and regional estimates . . . 115
4 Global Employment Trends 2012 | Preventing a deeper jobs crisis
Tables
1. Overview of iscal austerity measures . . . 17
2. Patterns of global growth . . . 27
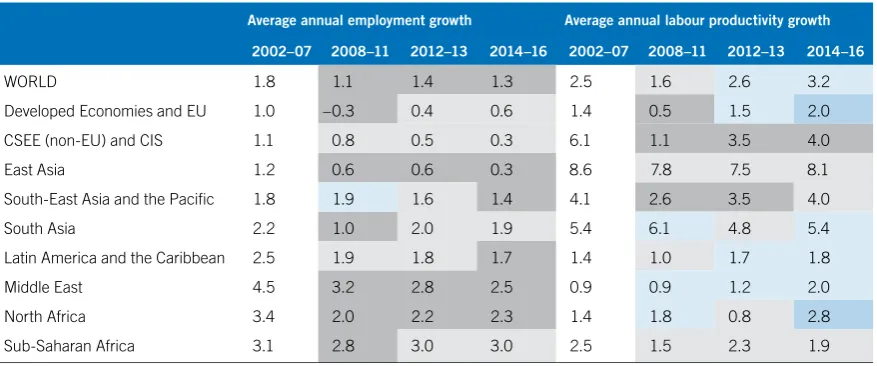
3. Employment and labour productivity growth, world and regions (% p.a., selected periods) . . . 38
4. Labour market situation and outlook and GDP growth in the Developed Economies and European Union region (%) . . . 47
Boxes 1. Sovereign debt problems in the euro zone . . . 20
2. Could inancial market reforms increase employment growth? . . . 22
3. New ILO estimates of the world’s working poor . . . 43
4. German wage developments and euro area troubles . . . 46
5. he importance of unemployment beneits for an employment recovery . . . . 49
6. Creating 2.4 million jobs and 7 million job-years in the United States through private investment . . . 50
7. Informal employment in Kazakhstan . . . 56
8. Policy options for East Asia to prepare for a greying population . . . 62
9. Youth unemployment in Indonesia . . . 65
10. Tackling high and pervasive unemployment in Jordan . . . 72
11. he impact of the revolutions and political change . . . 76
12. LMIA systems and the use of DySAMs to assess employment creation in Mozambique . . . 80
Country spotlights 1. Growth and employment in Australia, Germany, Japan, Latvia, Spain and the United States . . . 48
2. Growth and employment in the Republic of Moldova, the Russian Federation and Turkey . . . 53
3. Growth and employment in Brazil, Colombia and Mexico . . . 57
4. Growth and employment in China, Hong Kong (China), Republic of Korea and Taiwan (China) . . . 60
5. Growth and employment in Indonesia, Malaysia, the Philippines and hailand 64
6. Growth and employment in Egypt and Morocco . . . 74
7. Growth and employment in South Africa . . . 78
Figures 1. Decomposition of demand conditions: Pre-crisis vs. crisis period . . . 16
2. Financing conditions (USA, euro area and Japan) . . . 21
3. Sectoral employment change and housing price conditions . . . 24
4. Long-term trends in productivity growth . . . 24
5. Changes in investment shares and global productivity growth (2000–10) . . . 25
6. Investment and global unemployment . . . 26
7. World trade growth: Baseline and downward scenario projections . . . 27
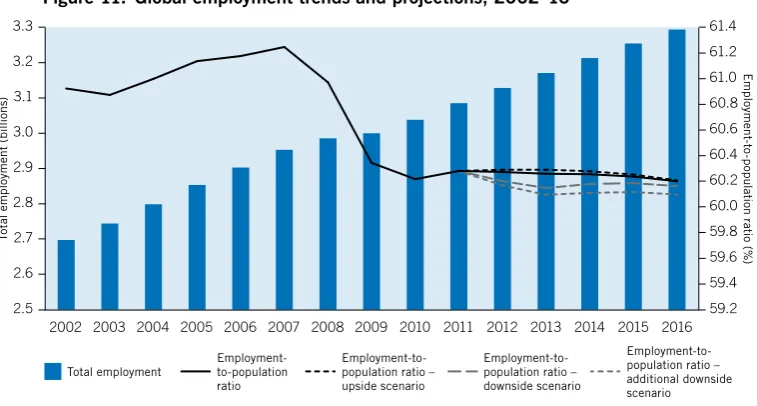
8. Global employment trends: Diferent scenarios . . . 28
9. Global unemployment trends and projections, 2002–16 . . . 32
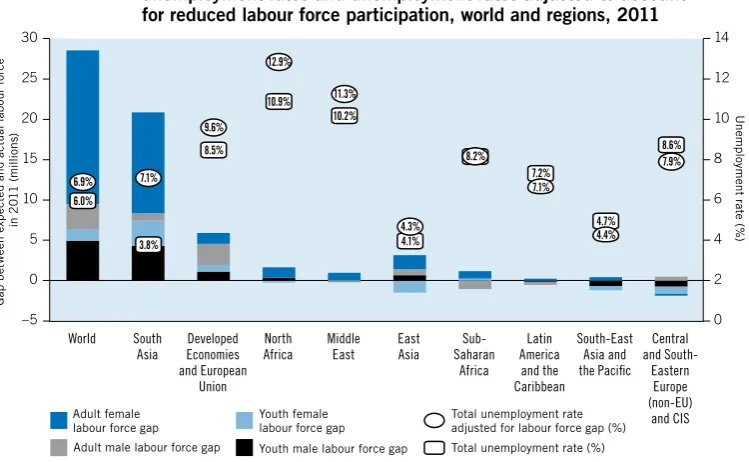
10. Gap between actual and expected labour force in 2011, total unemployment rates and unemployment rates adjusted to account for reduced labour force participation, world and regions, 2011 . . . 35
Contents 5
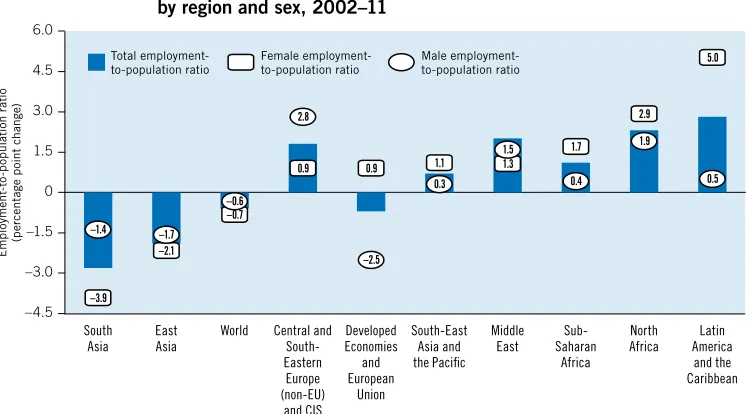
12. Changes in employment-to-population ratios by region and sex, 2002–11 . . . 37
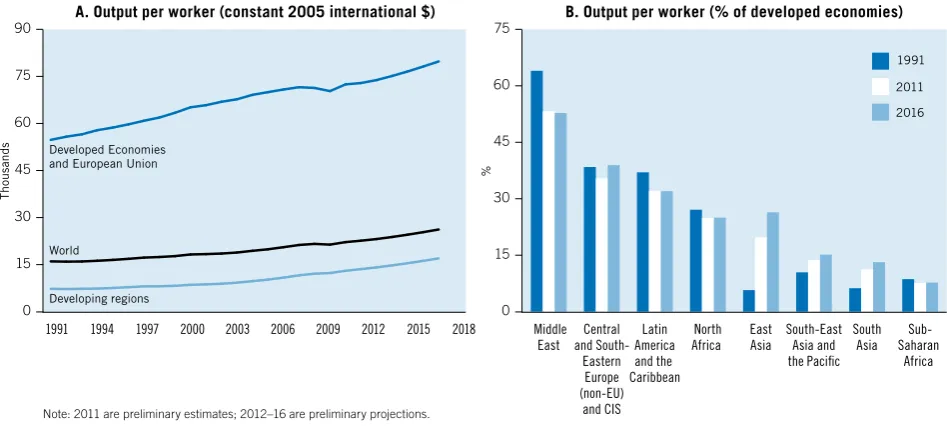
13. Labour productivity (output per worker), constant 2005 international $, 1991–2016 and % of productivity level in developed economies, 1991, 2011 and 2016 . . . 40
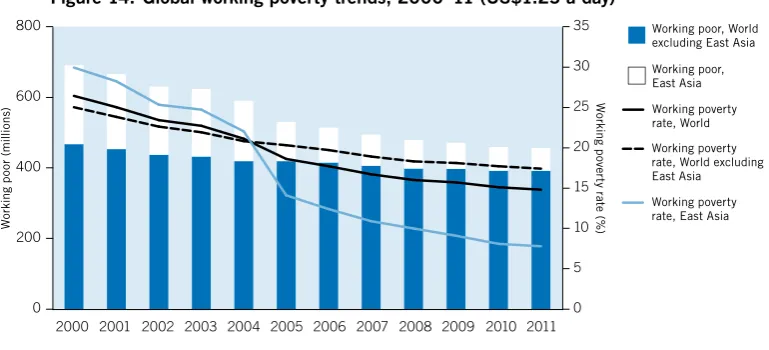
14. Global working poverty trends, 2000–11 (US$1.25 a day) . . . 41
15. Global working poverty trends, 2000–11 (US$2 a day) . . . 41
16. Global vulnerable employment trends, 2000–11 . . . 42
17. Labour productivity and selected labour market indicators in Non-EU Europe and the CIS economies . . . 54
18. Migration lows from CIS into the Russian Federation . . . 55
19. Origins of labour migrants residing in the Russian Federation in 2010 . . . 55
20. National employment-to-population ratios by sex, 2000–10 . . . 58
21. Female employment-to-population ratio by region and age group, 2000–10 . . 58
22. Labour force growth, ages 15+ (annual average, %) . . . 61
23. Employment in manufacturing (% change, year-on-year) . . . 63
24. Real GDP (% change, year-on-year) . . . 64
25. Output per worker by sector . . . 67
26. Divergence in labour productivity and employment growth in South Asia, ive-year averages (1992–2011) . . . 68
27. Persistence of vulnerable employment in South Asia, 1991, 2000 and 2011 . . 69
28. Distribution of employment status in South Asian countries, latest year . . . . 70
29. Unemployment rate (%), selected countries, latest year . . . 71
Acknowledgements 7
Acknowledgements
he Global Employment Trends 2012 report was prepared by the ILO’s Employment Trends Team, headed by Ekkehard Ernst. Steven Kapsos coordinated the production of the report in collaboration with heo Sparreboom and colleagues from ILO ield oices.
he following authors contributed to the report:
Executive summary: Ekkehard Ernst and Steven Kapsos
Chapter 1: Ekkehard Ernst and Moazam Mahmood
Chapter 2: Steven Kapsos
Chapter 3: Developed Economies and European Union: Ekkehard Ernst
Central and South-Eastern Europe (non-EU) and CIS: Olga Koulaeva and Ina Pietschmann
Latin America and the Caribbean: heo Sparreboom East Asia: Sukti Dasgupta and Phu Huynh
South-East Asia and the Paciic: Kee Beom Kim South Asia: Sher Verik
Middle East: Tariq Haq and heo Sparreboom North Africa: Dorothea Schmidt
Sub-Saharan Africa: heo Sparreboom and Christoph Ernst
Chapter 4: Moazam Mahmood and Ekkehard Ernst
Country Spotlights were prepared by Francisco Guerreiro, who also provided helpful research assistance for the report. Speciic mention should be given to Valia Bourmpoula for preparing the global and regional estimates on the basis of the Global Employment Trends (GET) econometric models and for helpful research assistance. Paola Ballon contributed to the analysis in Chapter 1. he publication would not have been possible without the contri-butions of other members of the ILO’s Employment Trends Team – Philippe Blet, Christian Viegelahn and Alan Wittrup.
he manuscript beneited from the suggestions of Moazam Mahmood, Director of the Economic and Labour Market Analysis Department, Sandrine Cazes, Chief of the Employ-ment Analysis Unit, and Catherine Saget, Senior Economist, as well as comEmploy-ments from José Manuel Salazar-Xirinachs, Executive Director, Duncan Campbell, Director for Policy Plan-ning in Employment, Michael Henriquez from the Director-General’s Oice, Philippe Egger, Director, Bureau of Programming and Management, Stephen Pursey from the Policy Inte-gration Department, Raymond Torres and Steven Tobin from the International Institute for Labour Studies, Rafael Diez de Medina, Director, and Jean-Michel Pasteels from the Depart-ment of Statistics. We thank Rob Vos, Director, DevelopDepart-ment Policy and Analysis Division, United Nations secretariat, New York, and his colleagues for their review of the drat report.
he analysis provided in the Global Employment Trends series is only as good as the
8 Global Employment Trends 2012 | Preventing a deeper jobs crisis
dissemination of country-level data in order to improve the analysis of employment trends provided in future updates of this report.
Executive summary 9
Executive summary
The world faces a challenge of creating 600 million jobs over the next decade
he world enters the year 2012 facing a serious jobs challenge and widespread decent work deicits. Ater three years of continuous crisis conditions in global labour markets and against the prospect of a further deterioration of economic activity, there is a backlog of global un-employment of 200 million – an increase of 27 million since the start of the crisis. In add-ition, more than 400 million new jobs will be needed over the next decade to avoid a further increase in unemployment. Hence, to generate sustainable growth while maintaining social cohesion, the world must rise to the urgent challenge of creating 600 million productive jobs over the next decade, which would still leave 900 million workers living with their families below the US$2 a day poverty line, largely in developing countries.
Global labour markets show little improvement
Against these labour market challenges, the outlook for global job creation has been wors-ening. he baseline projection shows no change in the global unemployment rate between now and 2016, remaining at 6 per cent of the global labour force. his would lead to an addi-tional 3 million unemployed around the world in 2012, or a total of 200 million, rising to 206 million by 2016. If downside risks materialize and global growth falls to below 2 per cent in 2012, global unemployment would rise more rapidly to more than 204 million in 2012, at least 4 million more than under the baseline scenario, with a further increase to 209 million in 2013, 6 million more than under the baseline scenario. Alternatively, under a more benign scenario – which assumes a quick resolution of the euro debt crisis – global unemployment would be around 1 million lower than under the baseline scenario in 2012, and 1.7 million lower in 2013. his would still not be suicient to signiicantly alter the trajectory of the global unemployment rate, which is projected to remain stuck at around 6 per cent.
Youth are particularly hard hit by the crisis
10 Global Employment Trends 2012 | Preventing a deeper jobs crisis
Falling labour force participation masks an even worse global unemployment situation
In the world as a whole, there were nearly 29 million fewer people in the labour force in 2011 than expected based on pre-crisis trends, with 6.4 million fewer youth and 22.3 million fewer adults. his is equal to nearly 1 per cent of the actual global labour force in 2011, and nearly 15 per cent of the total number of unemployed in the world. If all of these potential workers were available to work and sought work, the number of unemployed would swell to over 225 million, or to a rate of 6.9 per cent, versus the actual rate of 6 per cent. Participation rates have plunged in many countries in the Developed Economies and European Union region, resulting in there being 6 million fewer people in the workforce than expected based on pre-crisis trends. Adding this cohort to the unemployed would raise the region’s unemployment rate from 8.5 per cent to 9.6 per cent.
The global economy has substantially reduced its capacity to add new jobs
Globally, the employment-to-population ratio declined sharply during the crisis, from 61.2 per cent in 2007 to 60.2 per cent in 2010. his represents the largest such decline on record (since 1991). Based on current macroeconomic forecasts, the ILO’s baseline projection for the employment-to-population ratio is not encouraging, with a lat to slightly declining trend projected to 2016. he ILO’s downside scenario would result in a double dip in the global employment-to-population ratio, with the ratio likely to fall to the lowest rate on record around 2013. he upside scenario also would not result in growth rates suicient to bring about a substantial rise in the global employment-to-population ratio, which would remain well below pre-crisis levels for the next several years.
Outside of Asia, developing regions have lagged behind developed economies in labour productivity growth, raising the risk of a further divergence in living standards and limiting prospects for poverty reduction
As the global economy is slowing down again, the convergence of living standards across countries has also been slowing. he labour productivity gap between the developed and the developing world – an important indicator for the convergence of income levels across coun-tries – has narrowed over the past two decades, but remains substantial: output per worker in the Developed Economies and European Union region was US$72,900 in 2011 versus an average of US$13,600 in developing regions. his means that, adjusted for diferences in prices across countries, the average worker in a developing country produces less than one-ith of the output of the average worker in a developed country. he three Asian regions have accounted for all of the catch-up in levels of labour productivity between the developing and developed world between 1991 and 2011, with other developing regions lagging behind.
Progress has been made in reducing extreme poverty among workers at the global level, but working poverty remains widespread
Executive summary 11 Vulnerable employment has increased by 23 million since 2009
he number of workers in vulnerable employment globally in 2011 is estimated at 1.52 bil-lion, an increase of 136 million since 2000 and of nearly 23 million since 2009. he East Asia region has seen a reduction in vulnerable employment of 40 million since 2007, versus increases of 22 million in Sub-Saharan Africa, 12 million in South Asia, nearly 6 million in South-East Asia and the Paciic, 5 million in Latin America and the Caribbean and more than 1 million in the Middle East. he share of women in vulnerable employment (50.5 per cent) exceeds the corresponding share for men (48.2 per cent). Women are far more likely than men to be in vulnerable employment in North Africa (55 per cent versus 32 per cent), the Middle East (42 per cent versus 27 per cent) and Sub-Saharan Africa (nearly 85 per cent versus 70 per cent).
Job-poor growth in the developed world and weak productivity in developing regions threaten a broader recovery and limit economic development prospects
here is growing evidence of a negative feedback loop between the labour market and the macro-economy, particularly in developed economies: high unemployment and low wage growth are reducing demand for goods and services, which further damages business coni-dence and leaves irms hesitant to invest and hire. Breaking this negative loop will be essen-tial if a sustainable recovery is to take root. In much of the developing world, such sustainable increases in productivity will require accelerated structural transformation – shiting to higher value added activities while moving away from subsistence agriculture as a main source of employment and reducing reliance on volatile commodity markets for export earnings. Further gains in education and skills development, adequate social protection schemes that ensure a basic standard of living for the most vulnerable, and strengthened dialogue between workers, employers and governments are needed to ensure broad-based development built on a fair and just distribution of economic gains.
Global growth is set to weaken in 2012
he recovery that started in 2009 has been short-lived and shallow and a large employment gap remains. Since summer 2011, macroeconomic woes in some advanced economies have worsened as investment and global job creation have remained weak. Financial sector insta-bility and rising risk premiums on the back of an uncertain outlook on sovereign debt have limited private sector access to credit and have cast shadows over business and consumer senti-ment. Even though only a few countries are facing serious and long-term economic and iscal challenges, the global economy has weakened rapidly as uncertainty spread beyond advanced economies. As a result, the world economy has moved even further away from the pre-crisis trend path and, at the current juncture, even a double dip remains a distinct possibility.
A three-stage crisis
Entering the fourth year of global economic turmoil, there is now evidence of a three-stage crisis. he initial shock of the crisis was met by coordinated iscal and monetary stimulus, which led to recovery in growth and avoided further contraction and higher unemployment, but proved insuicient to bring about a sustainable jobs recovery, most notably in advanced economies.
12 Global Employment Trends 2012 | Preventing a deeper jobs crisis
been a weakening of both GDP growth and employment. GDP growth dropped globally, from 5 per cent in 2010 to 4 per cent over 2011, led by advanced economies, whose forecast for 2011 was revised downwards by the IMF in September 2011 to 1.4 per cent. In the mean-time, this also afected emerging economies, where growth remained strong throughout 2011, although the irst signs of weakness were seen in the last quarter of 2011 with lower indus-trial orders.
he tightening of policies and the persistently high levels of unemployment have increased the potential for a dangerous third stage, characterized by increased risk of a second dip in growth and employment in some of the advanced economies, exacerbating the severe labour market distress that has emerged since the onset of the crisis.
Policy space has been diminished
In this third stage of the crisis, policy space has been seriously limited, making it diicult to stop, or even to slow down, the further weakening of economic conditions. At the initial stage of the global crisis, countries had been quick to set up inancial sector support measures, as well as stimulus packages. Despite much efort – in some cases up to 90 per cent of addi-tional public spending went into bailing out banks – the inancial industry remains highly vulnerable, weakening its capacity to lend to the real economy. Credit conditions have become tighter again in recent months, partly related to the high level of uncertainty about the global economic outlook. At the same time, high levels of sovereign debt in advanced economies have limited the capacity of governments in these countries to implement a further round of stimulus programmes.
Economic conditions have proved to be more resilient in emerging economies in East Asia and Latin America, leaving more policy space there. Nevertheless, some spillover efects resulting from the diiculties in advanced economies are already visible there as well. Sources of global growth have been shiting substantially since the beginning of the crisis, with emerging economies increasingly contributing to world demand. Growing trade between emerging economies has contributed to this gradual decoupling and to the emergence of new centres of growth, which have the potential to stabilize global growth and prevent a double-dip recession. In these countries, favourable economic conditions pushed job creation rates above labour force growth, thereby supporting domestic demand, particularly in larger emerging economies in Latin America and East Asia. However, as emerging economies con-tinue to rely on exports to advanced economies, they too saw their growth rates decelerate in the last quarter of 2011. In this regard, a coordinated efort by policy-makers in both advanced and emerging economies could help beneit the global economy from these new centres of growth and prevent a further global economic slowdown.
Investment remains depressed, weighing on job creation
Executive summary 13
for falling unemployment rates. In this regard, the ILO estimates that strengthening incen-tives for a faster recovery in investment – increasing it by an additional 2 percentage points of global GDP, or US$1,200 billion worldwide – is necessary to fully absorb the employment gap that has been opened by the crisis.
Structural imbalances are dragging down medium-term trends in employment growth
Structural imbalances that have built up over the past decade are further worsening the employ-ment outlook. Housing and other asset price bubbles prior to the crisis created substantial sec-toral misalignments that need to be ixed and which will require lengthy and costly job shits, both across the economy and across countries. Strong liquidity growth created housing and inancial sector booms, which are still ongoing in some economies, leading to misallocation of resources and creating structural problems in the labour market that are likely to take time to be fully absorbed. hese structural frictions are also responsible for the low employment response to growth, particularly in those economies where the boom has already been followed by a bust, such as the United States, Spain and Ireland. Going forward, the re-adjustment of these imbalances is likely to limit the efectiveness of policy interventions as traditional macro-economic policies may be less efective when it comes to rebalancing sectoral growth patterns. To address these obstacles, additional policy levers are needed in order to allow a more rapid reallocation of jobs and workers across the economy to allow for faster job growth.
To address these issues, policies need to coordinate globally, …
To address the protracted labour market recession and put the world economy on a more sus-tainable recovery path, several policy changes are necessary. First, global policies need to be co-ordinated more irmly. Deicit-inanced public spending and monetary easing simultaneously implemented by many advanced and emerging economies at the beginning of the crisis is no longer a feasible option for all of them. Indeed, the large increase in public debt and ensuing concerns about the sustainability of public inances in some countries have forced those most exposed to rising sovereign debt risk premiums to implement strict belt-tightening. However, cross-country spillover efects from iscal spending and liquidity creation can be substantial and – if used in a coordinated way – could allow countries that still have room for manoeuvre to support both their own economies as well as the global economy. It is such coordinated public inance measures that are now necessary to support global aggregate demand and stim-ulate job creation going forward.
… repair and regulate the financial system, …
Second, more substantial repair and regulation of the inancial system would restore cred-ibility and conidence, allowing banks to overcome the credit risk that has dogged this crisis. All irms would gain from this, but especially SMEs, which not only need the credit more, but also end up creating more than 70 per cent of jobs. An encompassing reform of inancial markets, including larger safety margins in the domestic banking sector, would substantially help the labour market and could add up to half a percentage point in employment growth, depending on country circumstances.
… target stimulus measures to employment …
14 Global Employment Trends 2012 | Preventing a deeper jobs crisis
managed to roll back the 27 million increase in unemployed since the initial impact of the crisis. Clearly, the policy measures have not been well targeted and need reassessment in terms of their efectiveness. Indeed, estimates for advanced economies regarding diferent labour market instruments show that both active and passive labour market policies have proven very efective in stimulating job creation and supporting incomes. Country evidence across a range of labour market policies – including the extension of unemployment beneits and work sharing programmes, the re-evaluation of minimum wages and wage subsidies as well as enhancing public employment services, public works programmes and entrepreneurship incentives – show impacts on employment and incomes.
… and encourage the private sector to invest…
Fourth, additional public support measures alone will not be suicient to foster a sustain-able jobs recovery. Policy-makers must act decisively and in a coordinated fashion to reduce the fear and uncertainty that is hindering private investment so that the private sector can restart the main engine of global job creation. Incentives to businesses to invest in plant and equipment and to expand their payrolls will be essential to stimulate a strong and sustainable recovery in employment.
… without putting fiscal stability at risk
1. The macroeconomic outlook is deteriorating 15
1. The macroeconomic outlook
is deteriorating
The global economy has been weakening rapidly
Global growth has decelerated rapidly, increasing the threat of a prolonged jobs recession. Following the deepest global recession since the end of the Second World War, the recovery has been short lived and shallow, barely recovering to rates prior to the crisis and unable to close the gap that has opened up. In the meantime, the macroeconomic woes in some advanced economies have worsened, increasing global uncertainty. While only a few countries have been facing serious and long-term economic and iscal challenges, the global economy has cooled down fast as uncertainty has spread beyond the advanced economies, moving the world economy even further away from the pre-crisis trend path. At the current juncture, even a double dip remains a distinct possibility.1
Partly, the protracted nature of the recovery is due to the nature and depth of the crisis as well as its synchronized impact, which required policy action and economic adjustments on several fronts. A combination of unresolved inancial market problems and inancial reforms that have not yet been fully operationalized, a shit of private debt into public debt and sub-sequent sovereign debt sustainability issues, an ongoing process of private sector deleveraging and a global and sectoral restructuring of activities triggered by the crisis has put the brakes on global growth.
As a result of the weaker than expected recovery, labour markets are unlikely to recover from the strain they have sufered since the beginning of the crisis. Globally, nearly 27 million new jobseekers have been added to the already high global unemployment igure of almost 171 million prior to the crisis, and this gap is expected to open gradually further as new entrants into the labour market struggle to ind gainful employment. Under current trends, unemployment will be a reality for more than 200 million people in 2012; and if the situation aggravates further, more than 209 million workers may be afected by 2013. he return of new uncertainty, in particular the risk of another recession in advanced economies during the irst half of 2012, pushes further back any strong uptick in employment creation.
Short-term outlook
he outlook for a self-sustained global recovery worsened considerably during the summer months of 2011. Ater a V-shaped recovery in output, the mounting sovereign debt problems in some advanced economies have raised worries about a double dip in economic activity throughout the world. High levels of volatility have returned to inancial markets which, combined with the continuing deleveraging in the private sector in advanced economies and the efects of iscal austerity measures on global demand, have lowered expectations of a quick return to pre-crisis trends.
16 Global Employment Trends 2012 | Preventing a deeper jobs crisis
Crisis conditions are spreading out again from advanced economies
Global economic growth has decelerated sharply, falling to 4 per cent in 2011 from 5.1 per cent in the previous year, and is projected to decelerate further over the medium term (IMF, 2011a). In part this is related to the still lacklustre growth in advanced economies. As a conse-quence, job creation in this region has been slow, limiting disposable income growth, putting substantial strain on public inances and depressing private consumption, business invest-ment and trade in these countries. At the same time, emerging economies that managed to return to pre-crisis trend growth rates continue to rely heavily on demand conditions in more advanced economies, which has let them exposed to deterioration in economic conditions in this region. his vulnerability stems partly from the continued reliance of these economies on export-oriented growth. However, their recoveries also seem to have been driven by addi-tional liquidity from central bank interventions around the globe which have led to asset price booms, although these are likely to be unsustainable over the medium term.
Demand conditions have worsened on a broad front as private households and irms have continued to choose to save rather than consume (see i gure 1). Since 2010, public spending
Note: The charts show average public, private and external balances over the pre-crisis (2004-2007) and the crisis (2008-2010) periods. Source: ILO calculations based on IMF World Economic Outlook database, September 2011.
in % o
f G
D
P
Figure 1. Decomposition of demand conditions: Pre-crisis vs. crisis period
–10 –5 0 10 5 15 20 2004–07
in % o
1. The macroeconomic outlook is deteriorating 17
has lost substantial momentum. Ater having prevented a worse decline in output and employ-ment through a decisive, albeit short-lived, iscal stimulus, governemploy-ments around the globe have felt the need to enact austerity measures that further depress GDP growth and job creation. At the same time, private sector demand has not reached a sustainable trajectory that would help pick up the slack caused by reduced public sector stimulus. Private spending has taken a hit from eforts to deleverage and is unlikely to return to pre-crisis levels (which were in any case unsustainable, at least in those countries where it had been supported by strong credit expansion). In this environment of heightened insecurity and depressed consumer conidence, business investment has also not recovered to pre-crisis levels, further dragging down aggre-gate demand. In particular, non-inancial sector irms have accumulated substantial amounts of cash without injecting new funds into the economy.
Against this gloomy outlook, the risk now is that growth will remain below the job cre-ation threshold necessary for continuous and self-sustained employment genercre-ation, locking countries into an adverse equilibrium in which low output growth and subdued job creation reinforce each other. Given the need for the world economy to absorb an average of 40 million new labour market entrants each year, even a modest weakening in global economic activity of 0.2 percentage points would lead to an increase in the number of unemployed of 1.7 mil-lion by 2013.
Overly tight fiscal policies weigh on aggregate demand
Before the recent return of crisis conditions, most governments around the world turned towards a less accommodative policy stance, under the rationale of bringing public debt devel-opments under control. However, the uncoordinated manner in which iscal tightening has been carried out has led to an overly tight stance on budgetary positions, at least from a global standpoint. Indeed, even though budget deicits are still large, particularly in advanced economies, most of the budget shortfalls have been predominantly driven by reduced tax rev-enues rather than by additional expenditures from iscal stimulus packages (IMF, 2010a). Pro-vided that activity resumes suiciently, some of these large deicits can be expected to shrink automatically. In addition, sovereign debt positions have worsened substantially following a transfer of private debt (banking sector) to public debt, as governments tried to prevent large-scale banking failures at the beginning of the crisis. In order to address mounting concerns about the sustainability of government budget positions and rising sovereign debt risk pre-miums, many countries have started implementing substantial spending cuts which are likely to depress activity further, leading to a downward spiral of worsening growth and deterio-rating public balances (see table 1 for an overview of recent austerity measures).
Table 1. Overview of fiscal austerity measures
Details of consolidation measures Projected
consolidation period
Australia Increase in tax on tobacco products and federal resource tax; planned introduction of
30 per cent Resource Super Profits Tax in mining business (July 2012)
2012
Brazil Spending cuts helped achieve a primary fiscal surplus of 3.1 per cent of GDP in 2011,
but further austerity measures have been delayed
2011–14
Canada Planned cuts in federal spending programme (with the exemption of pensions, education
and health), especially targeting public sector wages; cuts in operating costs of federal
departments
2010–15
Denmark Nominal freeze of several social benefits (unemployment, student financial aid, welfare)
and foreign aid; reduction in duration of unemployment benefits; cuts in salaries of
min-isters by 5 per cent (around 2 billion Kroner); introduction of ceiling on family benefits;
higher excise duties on unhealthy foods and tobacco
18 Global Employment Trends 2012 | Preventing a deeper jobs crisis
Details of consolidation measures Projected
consolidation period
Estonia Increase of VAT (2 percentage points) and excise taxes; reduction in social benefits (health, pensions); operating spending cuts; (temporary) increase in second pillar pen -sion contributions; land sales; discretionary spending cuts
2011–14
France Cuts in public pensions, healthcare and public administration; raising of retirement age (from 60 years to 62 years by 2017); increase in taxes on capital; increase in top income tax rate by 1 percentage point
2010–13
Germany Yearly consolidation of €25 billion from additional taxes (banks, air traffic, nuclear power; total around €8 billion); cuts in spending on social security and labour market policies (around €8 billion); cuts in military and administrative expenses (around €5 billion)
2010–14
Greece Elimination of tax exemptions; increase in property taxes; higher excise tax on cigarettes and alcohol; higher tax on mobile telephones and petrol; special levy on profitable firms
and on high-value real estate; 10 per cent reduction in general government expenditure
on salary allowances; public sector recruitment freeze in 2010 and partial replacement of retiring civil servants; reduction in operating costs and subsidies for pension funds; sig-nificant reduction in the number of public sector special committees; amalgamation and drastic reduction in the number of the public bodies/entities linked to local authorities
2010–14
Hungary Introduction of 16 per cent flat rate of income tax over two years; cuts to the public sector (reduction of wages, elimination of certain benefits); six-year tax for financial insti -tutions; reduction of bureaucracy for investors; ban on foreign exchange mortgages
2011–13
India Reduction in social sector spending 2010–11
Indonesia Efforts to reduce corruption and improve government efficiency and tax enforcement
Ireland Tax increases and spending cuts (public sector wages, social welfare benefits) 2009–10
Italy Public sector hiring freeze and public sector wage cuts (for civil servants with gross
salary above €75,000); cuts in healthcare spending; strengthening of efforts against tax
evasion; reduction in transfers from central to regional and local governments
2010–12
Japan Revision of spending plans to freeze deterioration of primary balance; limitation of sover -eign debt issuance in 2012 to 2011 levels
2012 onwards
Latvia Increase of VAT (3 percentage points); introduction of capital income tax; increase of personal income flat tax rate (3 percentage points); broadened base for property tax;
public sector wage cuts; pensions cuts; structural reforms in public administration;
edu-cation and healthcare (revenue vs. spending consolidation in the ratio 20:80)
2009–10
Lithuania Cuts in salaries of politicians; reduction in military appropriations; scrap indexation of minimum wages; revision of maternity leave allowances; rationalization of public
expenses; increase of personal income tax flat rate to 20 per cent; increase of excise taxes (fuel, tobacco, gambling); introduction of a corporate tax on agricultural entities
2009
onwards
Nether-lands
Consolidation effort of €18 billion until 2015 (around 3 per cent of GDP), with cuts con
-centrated in social security reforms (tighter eligibility criteria for childcare allowance, dis
-ability and unemployment benefits), development cooperation and military spending
2011–15
Portugal Reduction in public sector pay and hiring (15 per cent reduction of central government
services and managerial positions compared with 2010); increase of VAT and taxes on high-income earners; freezing of pensions, except for the lowest pensions; special contri
-bution on pensions above €1,500; reform of the unemployment benefit system.
2010–13
Romania 25 per cent reduction in public sector wages; 15 per cent reduction in pensions and
unemployment benefits
Russia Increase in non-energy tax revenues to lower deficit up to 2014 2010–14
Slovenia Announcement to reduce budget deficit by investment cuts (rather than public sector cuts) Spain Cut in public sector jobs (13,000 jobs) and pay (salary cuts of 5 per cent for civil serv
-ants and of up to 15 per cent for ministers and mayors); introduction of new income tax; scrapping of newborn benefits; reduction in public investments by €6 billion; cuts in public pensions; sale of public sector assets: one-third of public enterprises shall be
closed or sold off
2010–13
Turkey Introduction of the “fiscal rule bill”, including cuts in social security, local and provincial administration and unemployment benefits and levies for firms with floating capital
2010
onwards
United
Kingdom Emergency measures: abolition of the Child Trust Fund and cutting of employment programmes (Young Person’s Guarantee fund), civil service recruitment freeze. One-quarter of -higher revenues shall be achieved by tax increases: increase in VAT (2.5 percentage points)
2010
United
States
The Budget Control Act, signed into law in August 2011, is expected to result in an aggregate reduction in government spending of US$1.88 trillion over the period 2012 to 2021, with cuts to defence, education, national parks, low-income housing assistance and medical research, among others
2012–21
1. The macroeconomic outlook is deteriorating 19
Fiscal positions have been weakened by financial sector support
Fiscal deicits can largely be explained by the fall in tax revenue associated with the eco-nomic contraction or slower growth. In addition, an important contribution to the increased expenditures is related to the substantial inancial sector support measures implemented at the beginning of the crisis, in particular in some European countries. Due to the inan-cial sector origins of the crisis, these support programmes have targeted the banking sector in advanced economies, in some cases channelling up to 90 per cent of additional public spending into bailing out banks and buying up distressed inancial assets (IILS, 2009). In a survey of 77 countries (ILO and World Bank, forthcoming), the total budget for additional iscal spending of US$2.4 trillion during the crisis years was accounted for largely by the high-income countries, whose share came to US$1.9 trillion, while the share of middle- and low-income countries came to US$520 billion. Of the US$1.9 trillion sectoral budget for high-income countries, US$1.2 trillion (almost two-thirds) went to the inancial sector. his inancial bailout dwarfed all other sectoral support in high-income countries, far greater than spending on healthcare (8 per cent), education and infrastructure (5 per cent each).
he oten unconditional bailouts of the inancial sector in advanced economies has com-pounded sovereign debt problems, in particular in the euro zone (see box 1) with sizeable spillovers to the global economy. Indeed, by buying up distressed assets and allowing banks to beneit on a broad scale from direct access to central bank credit for their inancing activities, policy-makers have relieved banks from liquidity constraints, fearing that this would result in massive bank failures. At the same time, incentives for private banks to buy up large amounts of sovereign debt were strengthened as public guarantees relieved capital requirements for such assets and returns on sovereign bonds skyrocketed. As a consequence, banks – relying on such guarantees – started to buy sovereign debt from euro area countries at the height of the inancial crisis in the expectation of using these assets to access central bank liquidity fa-cilities. he ensuing change in banks’ asset compositions has not only further weakened the banking sector in certain advanced economies, it has also transferred disproportionate risk onto sovereigns, which has led to the current re-emergence of crisis conditions.
In contrast, most emerging economies beneited from initially much better iscal pos-itions and lower inancial sector stress, which allowed them to prioritize support for exports and the real economy. his, in turn, led to much stronger recovery in these countries, thereby helping to limit the impact of these measures on public debt and long-term sustainability.2 Of a total budget of US$520 billion, the largest allocation for support was to manufacturing, with a 22 per cent share, followed by agriculture with a 9 per cent share, inance and construc-tion, each with a 5 per cent share, and a 4 per cent share for infrastructure.
Even though the inancial sector origins of the crisis explain the bias of advanced econ-omies towards inancial sector support, the choice of bailing out banks without any compen-satory requirements remains a matter of much public debate. Now facing the risk of another recession, many governments in advanced economies are let with little ammunition to sup-port the real economy. At the same time, putting further stress on the banking sector at the current juncture by having the sector pay for part of the clean-up costs, for instance via a inancial transaction tax, risks further derailing the economy. Clearly, this dilemma cannot be solved at the level of any individual country but requires the coordinated intervention across a larger group of countries, to mutualize at least part of the recession risk, and stronger support for the global economy by more solvent countries.
20 Global Employment Trends 2012 | Preventing a deeper jobs crisis
Unresolved financial sector problems limit investment dynamics
Despite this strong support for inancial sector bailouts, more than three years ater the height of the inancial crisis many reforms to strengthen the stability of the inancial system are only gradually being introduced. Countries had initially been quick to bail out failing banks and restrict certain types of inancial transactions deemed to be particularly critical for the stability of the inancial sector, and later more structural measures were announced or – in certain cases – legislated, such as the separation of commercial from investment banking ac-tivities and the strengthening of banks’ equity bases. Most of these measures, however, are
Box 1. Sovereign debt problems in the euro zone
Financial crises often lead to sovereign debt
crises, threatening the chances for a sustainable recovery (Reinhart and Rogoff, 2009). This time is no exception. In particular, public finances in
advanced European Union countries have been affected by large bailout programmes of their banking system as well as rapidly declining tax
revenues. Already prior to the crisis many EU-27
countries had accumulated substantial amounts of public debt that rapidly increased further with
the onset of the crisis, far beyond the thresholds that had been fixed by the Stability and Growth Pact. With the economic outlook deteriorating,
unemployment rates increasing and public
finances suffering, sovereign debt ratings plum
-meted, causing bond interest rates to sky-rocket
in some member countries and bond markets to
dry up. By summer 2011, these sovereign debt
problems reached a stage where even a
break-up of the euro area became conceivable, with unknown adverse consequences for member
countries and the global economy alike. In order to prevent a sovereign default of one
of their member countries, EcoFin – the Council
of European Economics and Finance
Minis-ters – together with the International Monetary
Fund undertook some short-term support meas-ures to maintain sovereign solvency of some of their member countries and to prevent high long-term interest rates choking off the recovery
underway in the euro area. To this avail, the European Financial Stability Facility (EFSF)
was set up alongside the European Financial
Stabilisation Mechanism (EFSM), two temp -orary funding facilities from which distressed
countries are allowed to draw. Together EFSF and EFSM provide a financial safety net for EU countries’ sovereign debt of more than €1,000 billion. It is planned that, by mid-2013, these
temporary facilities be replaced by the
Euro-pean Stability Mechanism (ESM), or supplement it, the contours of which, however, still need to
be approved in a treaty adopted by EU member countries.
In addition to these fiscal safeguard
meas-ures, EU member countries also adopted a Competitiveness Pact (the “Euro-Plus Pact”).
This pact intends to accelerate convergence among member countries in order to avoid a further divergence of economic fundamentals that have already affected the cohesion of the
currency area. In particular, unit labour costs
were thought to be at the heart of the difficul-ties that some of the member countries faced in responding to the crisis and the ensuing wors-ening of public finances. The pact suggests measures to strengthen public finances through
tax policy coordination, especially regarding cor
-porate taxation. In addition, deflationary labour
market and social policy measures were being
emphasized on wage indexation, retirement
ages and labour taxation.
So far, the extent to which both the financial
safety facilities and the competitiveness pact can address the fundamental weaknesses of the economic governance in the euro area remains
to be seen. Recent conclusions adopted at an
EU summit in Brussels suggest that national fiscal policies will come under greater scrutiny by supranational institutions such as the
Euro-pean Court of Justice to ensure that deficit ceil -ings and a debt brake are properly adhered to.
On the other hand, neither euro-wide sovereign debt instruments (“euro bonds”) nor a larger
role of the European Central Bank as a lender of last resort to governments have been adopted
during the summit, significantly limiting the ef -fectiveness of the new EU fiscal framework.
In addition, supply-side measures such as
those focused on in the Euro-Plus Pact would deliver results only over the medium term through internal devaluation and at the cost of prolonged periods of slow economic growth. These measures force adjustment through wage
deflation, causing substantial social harm and
threatening a sustainable recovery. At the same
time, when carried out in isolation, they increase
capital costs relative to other member countries
for the entire adjustment period, depressing investment and job creation. Worse, if such
measures are introduced in an uncoordinated
way, other euro area member countries are
likely to introduce similar measures to avoid
deterioration of their competitive situation, fur -ther depressing the outlook for the entire cur-rency union without solving the sovereign debt
problems at the origin of the crisis. Instead,
policy-makers should have taken advantage of the relative closedness of the euro area to co-ordinate their wage and fiscal policies such as to allow distressed member countries to benefit from demand spillover effects from countries
more advanced in their recovery process (Stock
1. The macroeconomic outlook is deteriorating 21
still awaiting full implementation or are only gradually being phased in, such as the Basel III accords on banking supervision.
Indeed, lending to small and medium-sized enterprises (SMEs) in particular has not taken of in advanced economies. In the euro area in particular, lending conditions have remained tighter than before the crisis despite a return towards more normal conditions in most economies following the immediate atermath of the crisis. In addition, lending con-ditions have started to tighten again in recent months among advanced economies against the backdrop of heightened market uncertainty (see i gure 2). Given the importance of SMEs in generating investment and employment, going forward it will be crucial to relieve their inancing conditions and allow them more broad-based access to banking and market-based credit. In part, such an improvement in inancing conditions can be achieved by speeding up the implementation of the announced and agreed banking sector reforms to help to transform the current banking sector model and make it more amenable for real economy inancing.
In this regard, it should be stressed that proper and comprehensive inancial sector regu-lation can actually contribute to faster employment growth (see box 2). It will relieve enter-prises and banks from economic and regulatory uncertainty and put the business model of the banking sector on a more stable footing. he reduced volatility in domestic and international markets that such tighter regulation might induce is a prime requisite factor for stimulating both investment and employment growth and might help to reduce precautionary saving. In addition, stricter prudential regulation and the limitation of implicit public guarantees against bank failures will help phase out current exceptional monetary measures, restoring market forces in the banking sector. his will improve inancial conditions in the real economy, as banks will have greater incentives to channel their funds toward productive ends rather than volatile inancial products. Adding up these efects, estimates by the ILO show that broad-based inancial sector regulation could add more than half a percentage point to job creation rates (ILO, 2011a).
Policy space to boost the recovery remains limited
Policy space has been further restricted by recent turbulence in sovereign debt markets. Given the lack of adequate international coordination, and the mood of policy-makers around the globe, returns to a more expansionary stance of iscal policy are unlikely – despite the adverse
Note: The chart shows financial conditions for private sector firms based on the tightness of credit standards, the liquidity of commercial bond markets and borrowing interest rates. Positive values imply loose financial conditions, negative values tight conditions. Source: OECD Economic Outlook 90.
F
in
a
n
cial c
o
n
d
it
io
n
s (
in
d
e
x; n
e
u
tr
al = 0
)
Figure 2. Financing conditions (USA, euro area and Japan)
–6 –2
–4 0 2 4 6
United States Japan
Euro area
1995
Q1…Q4
1996
Q1…Q4
1997
Q1…Q4
1998
Q1…Q4
1999
Q1…Q4
2000
Q1…Q4
2001
Q1…Q4
2002
Q1…Q4
2003
Q1…Q4
2004
Q1…Q4
2005
Q1…Q4
2006
Q1…Q4
2007
Q1…Q4
2008
Q1…Q4
2009
Q1…Q4
2010
Q1…Q4
2011
Q1…Q4
Loose conditions
22 Global Employment Trends 2012 | Preventing a deeper jobs crisis
Box 2. Could financial market reforms increase employment growth?
Few existing studies have tried to identify the impact of financial market regulation on the real economy. Efforts have mostly concentrated on the effects of higher capital costs and the availability of credit due to stricter rules on
GDP growth, and on regulation of international financial flows, such as international transaction taxes and capital controls, which are also expected to reduce financial
depth and credit market activity. The extent to which such reduction in financial activity will lead to a slowdown of
the real economy is still hotly debated, as are the actual effects of tighter regulation on the banks’ dominant busi
-ness model and its consequences for financing costs (see IIF, 2010; Kashyap et al., 2010; Admati et al., 2011). Disregarding methodological and conceptual differences across these studies, however, most agree that some – at least temporary – shortfall of GDP might be expected, if
at least to account for the fact that the banking sector will
have to reorient its activities to other, potentially less prof -itable domains.
None of the discussions presented in recent years, how
-ever, has looked into effects of financial market regula -tion on employment crea-tion. They assume a stable and
constant link between GDP and employment that is suf -ficient to derive relevant estimates for the number of jobs being affected. This is misleading for at least two reasons.
First, a reduction in financial market stress may have an additional stimulus effect on employment creation, over and above positive effects for GDP, as uncertainty directly affects hiring incentives of firms. Second, financial reforms might also lead to changes in corporate governance, to the
extent that credit or bond financing will be less available
and might be replaced by increased fundraising on equity markets (for example, via private equity investment). Both
effects constitute additional forces for job creation.
Recent estimates that take these transmission mech -anisms into account present a more balanced picture regarding the extent to which labour markets will be affected
by financial reforms (Ernst, 2011a). In particular, it can be
shown that the labour market effects of financial regula-tion will depend on the extent to which financial reforms in the domestic sector are being coordinated with changes
in the international financial architecture. Chiefly, this can
be related to the fact that increased regulation in both areas would yield a double dividend in the form of more
stable financing conditions and a more equitable income distribution, which helps strengthen domestic demand. In
the absence of changes in either domestic or international
financial regulation, reform measures would not have suf -ficient positive effects to outweigh some of the costs they
bring about, at least in the short run (see figure below).
Note: The chart shows average annual employment growth rates for advanced G20 countries under
different reform scenarios after 1, 3 and 5 years. The baseline scenario of no financial reforms
is compared with scenarios where reforms are only implemented at the international level
(e.g. financial transaction tax), the domestic level (e.g. stricter bank capital requirements) or both.
Source: Ernst, 2011a.
A
n
n
u
al e
m
p
lo
ym
e
n
t g
ro
w
th (
%
)
Employment growth under different financial reform scenarios
0 1.0
0.5 1.5 2.0 2.5
After 1 year After 3 years After 5 years
Baseline scenario
International reforms only
Domestic reforms only
Fully coordinated reforms
consequences for global growth. Partly, this is related to the fact that regardless of the way in which current iscal austerity measures are being implemented, the crisis has revealed the fragile state of public inances in many advanced economies:
y Automatic stabilizers have helped much more during the crisis than discretionary
meas-ures. he swit increase in public spending and automatic reductions in tax pressure have contributed to a large extent to stabilizing demand conditions. It is estimated that overall, automatic stabilizers contributed up to 80 per cent to the overall stimulus that governments provided to their economies (OECD, 2009).
y Passive labour market policies and income-support measures have contributed strongly
1. The macroeconomic outlook is deteriorating 23
policies have acted as important lanking policies on the labour market, supporting job-seekers in inding new opportunities in alternative sectors or irms.
y Tax breaks on hiring for private businesses to create employment do seem to provide some
relief despite the severe macroeconomic adversity. However, the deadweight costs of these tax breaks have proven to limit their potential beneits. In a weak macroeconomic envir-onment, many businesses simply will not hire. Earlier experiences already demonstrated that these measures have been found to be very costly with only little additional efect on employment creation (Hungerford and Gravelle, 2010).
Implementing these insights more broadly would substantially enhance the balanced-budget multiplier, i.e. the capacity of governments to expand private demand even in the absence of deicit spending. It is estimated that under the current conditions of inefective monetary policy, such reorientation of iscal objectives (“smart spending”) could yield multiplier efects of over 2, i.e. private demand would expand by more than two dollars for each dollar on the public balance sheet (e.g. Woodford, 2010).
Monetary policy also will need to be adjusted soon. Central banks have little ammuni-tion let for guaranteeing liquidity provision to the real economy, despite the tightening inan-cial conditions observed in many advanced economies. Quantitative easing and the attempts by both the Federal Reserve and the European Central Bank to lower long-term interest rates by buying up sovereign debt has so far not satisied expectations by policy-makers and market participants. Risk premia, in particular on sovereign bonds of some countries, continue to be unsustainably high and show no signs of receding without major policy actions – such as a partial default by some sovereigns within the euro area.
Forces acting over the medium term
Underlying the weaker than expected recovery of global activity and the short-run downside risks are structural changes that have been fuelling the crisis. In particular, the slowdown of productivity growth in advanced economies and the concomitant shit of global activity to the emerging world have opened up imbalances that have not yet been taken up in a satisfactory manner. his has resulted in a gradual and – due to the crisis – permanent decline in poten-tial output growth, which will further weigh on policy-makers’ options.
Structural imbalances have weighed upon the recovery
24 Global Employment Trends 2012 | Preventing a deeper jobs crisis
Note: The chart shows the intensity of sectoral change during the crisis period depending on whether countries
experienced low, intermediate or high housing price inflation
during the pre-crisis years 2002 to 2007. Sectoral change is measured using the Lilien indicator, which varies between 0 (no sectoral change) and 1 (complete reallocation of jobs across sectors).
Source: ILO calculations based on OECD labour force surveys.
In te n si ty o f s tr u c tu ral c h a n g e d u ri n g t h e c ri si s (2 0 0 8 –1 0 )
House price inflation (2002–07)
Figure 3. Sectoral employment change and housing price conditions
0 0.4
0.2 0.6 0.8
Low Intermediate High
Note: The charts show labour productivity growth trend rates for nine world regions and the global aggregate.
Series have been filtered using a Hodrick-Prescott filter with λ = 6.25. Source: ILO, Trends econometric models, October 2011;
World Bank, World Development Indicators, 2011.
A n n u al p ro d u c ti vi ty g ro w th ( % )
Figure 4. Long-term trends in productivity growth
–1.0 1.0 2.0 3.0 4.0 5.0 6.0 0 7.0
1999 2000 2001 2002 2003 2004 2005 2006 2007 2008 2009 2010
A n n u al p ro d u c ti vi ty g ro w th ( % ) –1.0 0.5 –0.5 1.0 1.5 2.0 2.5 3.0 0 3.5
1999 2000 2001 2002 2003 2004 2005 2006 2007 2008 2009 2010
A n n u al p ro d u c ti vi ty g ro w th ( % ) 0 4 6 8 2 10
1999 2000 2001 2002 2003 2004 2005 2006 2007 2008 2009 2010
World
World Developed Economies and European Union
Central and South-Eastern Europe (non-EU) and CIS
Latin America and the Caribbean
South Asia East Asia
South-East Asia
and the Pacific
World North Africa Middle East Sub-Saharan Africa
Some parts of the world have seen a slowdown in productivity growth
1. The macroeconomic outlook is deteriorating 25
have been maturing (Eichengreen et al., 2011) and services-sector dominated advanced econ-omies have faced diiculties in keeping technological progress at a constant high speed.
he slowdown in productivity trends and the expectation of lower rates of capital returns will weigh on capital outlays and is likely to delay any return to the investment growth seen prior to the crisis. On the one hand, lower productivity growth rates decrease expected rates of return, thereby weighing on asset prices and hence investment (see Cochrane, 1991, 2008). On the other hand, lower productivity growth might also limit the available cash low to enterprises, thereby reducing the capacity of irms to invest. Together, these trends will reduce the economy’s potential to increase its capital stock and to recover from the loss in wealth incurred during the crisis. his in turn will further weigh on future expected productivity increases, running the risk of creating a downward spiral towards permanently lower rates of trend growth (see the tight link between productivity growth and investment in i gure 5).
Recovery in investment has been sluggish,
especially in advanced economies
Indeed, investment has already taken a large hit, both from the crisis and from unfavour-able structural developments. Even though, investment managed to recover somewhat, but unequally across the globe. In advanced economies as well as eastern Europe, the unresolved inancial sector problems, high levels of uncertainty regarding global prospects and the lower propensity of households to consume have slowed the recovery in corporate investment. With the onset of the crisis, business investment declined to historically low levels, oten leading to net destruction of the capital stock, with particularly adverse efects on job creation. Given the slow recovery in investment, job creation has not resumed in these economies. Conversely, emerging economies, on the back of their strong overall performance, have already returned to pre-crisis investment rates and are expected to exceed them over the medium term.
his slowdown in investment bodes ill for stronger job creation in advanced economies, given the strong links between the two in the past. Indeed, in the past only strong invest-ment growth – more than the expansion of production – was a precondition for reduced un-employment rates (see i gure 6).3 In addition, the un-employment intensity of investment has been depressed in the current macroeconomic environment, indicating that even faster investment
3 For a detailed analysis of the impact of the observed slowdown in investment on employment dynamics, see IILS (2011), Chapter 2.
Note: Values for 2011 are forecasts.
Source: ILO Trends econometric models, October 2011; World Bank, World Development Indicators, 2011.
A
n
n
u
al a
ve
ra
g
e p
ro
d
u
c
ti
vi
ty g
ro
w
th (
%
)
Change in investment share (percentage points)
Figure 5. Changes in investment shares and global productivity growth (2000–10)
–2.5 –2.0 –1.5 –1.0 –0.5 0 0.5 1.0 1.5
–2.0 –1.0 1.0
0 2.0 3.0 4.0 5.0
2000
2001 2002
2003
2004 2005
2006 2007
2008
2009
2010
26 Global Employment Trends 2012 | Preventing a deeper jobs crisis
growth than in the past is required to bring unemployment down. Indeed, as the crisis has led to substantial capital scrapping and re-evaluation of existing capital stocks, the threshold for investment growth necessary for job creation is likely to be higher than before the crisis, and investment rates need to surpass pre-crisis levels to absorb unemployment (Zoega, 2010). Moreover, investment in some emerging economies has not been as job-rich as in the past, so the current acceleration is not expected to add many new jobs and so will not bring down global unemployment.
World trade slowed, but has shown some recovery
World trade is central for a continuous, broad-based recovery in employment. At the height of the crisis in 2009, faltering international trade caused substantial adverse spillover efects, spreading crisis conditions to countries across the globe irrespective of their inancial sector situation. At the same time, once uncertainty dissipated, the strong recovery of trade also sup-ported the global revival of economic activity and employment growth experienced between the second half of 2009 and the beginning of 2011. Going forward, open world markets, and especially the capacity for emerging economies to market their products in more advanced economies, remain essential for preventing a more substantial deterioration of what is already a bleak situation. In addition, growing trade among emerging countries has contributed to a gradual decoupling of economies and the emergence of new centres of growth, which have the potential to stabilize global growth and prevent a more severe double-dip recession.
Indeed, world trade has helped to allow new growth drivers to enter the recovery process. Prior to the crisis, global growth had chiely been driven by advanced economies (see table 2), as strong private consumption in major developed countries, such as the United States, France and Japan, had helped to absorb commodities and goods produced in the emerging world. With the onset of the crisis and in the following recovery, the sources of global growth have changed and partly moved to the emerging world. his indicates a major shit, not only regarding the sources of global growth, but also in the direction of world trade, and is likely to have long-term efects on the economic structure, in particular of advanced economies. As a matter of fact, countries that were running large current account deicits prior to the crisis – such as the United States and Spain – managed to regain some competitiveness and allow a stronger role for manufacturing trade in their recovery. Overall, this shit of growth and trade allowed at least a temporary reduction in the global imbalances that were at the origin of the global crisis. World trade has already started to slow ater the quick and strong recovery in 2010. On the back of lower consumption growth, in particular in advanced economies, world trade growth almost halved. However, the emergence of new centres of global growth among
Note: The chart shows the average unemployment rate at different levels of investment shares between 1971 and 2010 for a sample of 178 countries. Investment shares
are classified as low, intermediate or high with respect to
historical averages on a country-by-country basis. Source: ILO Trends econometric models, October 2011; IMF, World Economic Outlook database, September 2011.
U
n
e
m
p
lo
ym
e
n
t r
a
te (
%
)
Investment share (% of GDP)
Figure 6. Investment and global unemployment
0 2
1 3 4 5 6 7
1. The macroeconomic outlook is deteriorating 27
developing economies managed to keep world trade growing close to its historical average. Given the recurrent problems in advanced economies, a further slowdown is to be expected followed by a moderate rebound in 2013 (see i gure 7).
Scenarios and policy responses
The ILO’s central projection foresees gradual slowdown
in activity and flat unemployment
In our baseline scenario, employment growth rates are expected to remain subdued for several years. Against the background of high uncertainty and adverse long-term trends, investment is likely to remain subdued for a prolonged period, preventing a fast recovery in employment Rather, the slowdown in growth and the structural diiculties will lead to a further opening of the jobs gap, although without necessarily increasing the global unemployment rate. Part of the additional potential workforce will stay outside the labour market, thereby increasing the pool of discouraged workers. In countries without well-developed social security systems, people will increasingly be forced into low-quality, informal sector jobs to earn a living.
Going forward, this scenario implies a substantial drag not only on employment but also on income and, particularly, on wages. Disposable income will be under pressure both from higher
Table 2. Patterns of global growth
Growth in
Brazil China France Japan USA Brazil China France Japan USA
Prior to t