GLOBAL EMPLOYMENT
TRENDS 2013
-006.65 0.887987 .887 +1.984523 220 -0.807987 48 +1.987523 +1. 9 -006.65 0.887990
+0.1 +2.03 +0.04 -25.301 023 -00.22
006.65 0.887983 +1.922523006.62 -0.657987 +1.987523006.82 -006.65 0.887987 +1.987523006.60 0.887987
+1.0075230.887984 +1.987523006.64 0.887985 +1.997523006.65 0.887986 +1.984523006.66 0.327987 +1.987523006.59 -0.807987 +1.987521006.65 0.-887987 +1.987523006.65 0.807987 +1.987523 0.887983 +1.987523006.62 -0.883988 +1.987523006.63 -006.65 0.894989 +1.987523006.65 0.887990
+0.1
+2.03 +0.04 -25.301 023 -00.22
006.65 0.887983 +1.922523006.62 -0.657987 +1.987523006.82 -006.65 0.887987 +1.987523006.60 0.887987
+1.0075230.887984 +1.987523006.64 0.887985 +1.997523006.65 0.887986 +1.984523006.66 0.327987 +1.987523006.59 -0.807987 +1.987521006.65 0.-887987 +1.987523006.65 0.807987 +1.987523 0.887983 +1.987523006.62 -0.883988 +1.987523006.63 -006.65 0.894989 +1.987523006.65 0.887990
+0.1 +2.03 +0.04 -25.301 023 -00.22
006.65 0.887983 +1.922523006.62 -0.657987 +1.987523006.82 -006.65 +0.887987 +1.987523006.60 0.887987 +1.0075230.887984 +1.987523006.64 0.887985 +1.997523006.65 0.887986 +1.984523006.66 -0.327987 +1.987523006.59 -0.807987 +1.987521006.65 0.-887987 +1.987523006.65 0.807987 +1.987523 0.887983 +1.987523006.62 -0.883988 +1.987523006.63 -006.65 -0.894989 +1.987523006.65 0.887990
+0.1 +2.03 +0.04 -25.301 023 -00.22
006.65 0.887983 +1.922523006.62 -0.657987 +1.987523006.82 -006.65 0.887987 +1.987523006.60 0.887987
Global Employment Trends 2013
Recovering from a second jobs dip
Copyright © International Labour Organization 2013 First published 2013
Publications of the International Labour Oice enjoy copyright under Protocol 2 of the Universal Copyright Conven-tion. Nevertheless, short excerpts from them may be reproduced without authorization, on condition that the source is indicated. For rights of reproduction or translation, application should be made to ILO Publications (Rights and Permis-sions), International Labour Oice, CH-1211 Geneva 22, Switzerland, or by email: [email protected]. he International Labour Oice welcomes such applications.
Libraries, institutions and other users registered with reproduction rights organizations may make copies in accordance with the licences issued to them for this purpose. Visit www.ifrro.org to ind the reproduction rights organization in your country.
he designations employed in ILO publications, which are in conformity with United Nations practice, and the presen-tation of material therein do not imply the expression of any opinion whatsoever on the part of the International Labour Oice concerning the legal status of any country, area or territory or of its authorities, or concerning the delimitation of its frontiers.
he responsibility for opinions expressed in signed articles, studies and other contributions rests solely with their authors, and publication does not constitute an endorsement by the International Labour Oice of the opinions expressed in them. Reference to names of irms and commercial products and processes does not imply their endorsement by the International Labour Oice, and any failure to mention a particular irm, commercial product or process is not a sign of disapproval. ILO publications and electronic products can be obtained through major booksellers or ILO local oices in many coun-ISBN 978-92-2-126655-6 (print)
ISBN 978-92-2-126656-3 (pdf)
ISSN 2304-4365 (print) ISSN 2304-2893 (pdf)
ILO Cataloguing in Publication Data
Global employment trends 2013: Recovering from a second jobs dip / International Labour Oice. Geneva: ILO, 2013
International Labour Oice
employment / unemployment / labour market / economic recession / economic development / regional development / trend / Africa / Asia / CIS countries / developed countries / developing countries / EU countries / Latin America
13.01.3
3
Acknowledgements . . . 7
Executive summary . . . 9
1. Macroeconomic challenges have worsened . . . 15
he global economic slowdown intensiies in 2012 . . . 15
Protectionism and policy incoherence could create further risks for the global economy . . . 22
he economic outlook remains cloudy . . . 25
Appendix 1. he ILO hiring uncertainty index . . . . 27
Appendix 2. Public sector, social security and labour market measures in selected countries . . . 28
2. Global labour market trends and prospects . . . 31
Unemployment is on the rise again, as job creation slows across most regions . . . . 31
Understanding the scope and nature of the global jobs gap . . . 36
Trends in employment quality . . . . 38
Global outlook for labour markets . . . 42
Appendix 1. Measuring skills mismatches . . . 43
Appendix 2. Decomposing changes in employment-to-population ratios . . . 43
3. Regional economic and labour market developments . . . 45
Developed Economies and European Union . . . 45
Central and South-Eastern Europe (non-EU) and CIS . . . . 56
Latin America and the Caribbean . . . 63
East Asia . . . 69
South-East Asia and the Paciic . . . 73
South Asia . . . 77
Middle East . . . 80
North Africa . . . . 85
Sub-Saharan Africa . . . . 90
Appendix 1. Trend unemployment during the crisis . . . . 96
Appendix 2. Okun’s coeicients and banking crises . . . 96
Appendix 3. ILO Short-term forecasting models . . . 97
4. Structural change for decent work . . . 99
Introduction . . . 99
Decomposing value added per capita growth . . . . 99
Labour markets beneit from structural change . . . 103
Appendix 1. he decomposition of value added per capita growth . . . 109
Appendix 2. Forecasts and imputations of value added . . . 113
Appendix 3. Patterns of growth and labour market outcomes . . . . 116
5. Recovering from the second jobs dip: Challenges and policies . . . 119
Tackle uncertainty to increase investment and job creation . . . . 119
Coordinate stimulus for global demand and employment creation . . . 120
Address labour market mismatch and promote structural change . . . 121
Increase eforts to promote youth employment – with a special focus on long-term unemployment for youth . . . . 122
Bibliography . . . . 125
Annexes Annex 1. Global and regional tables . . . . 133
Annex 2. Unemployment projections . . . 147
Annex 3. Global and regional igures . . . 155
Annex 4. Note on global and regional estimates . . . 165
Annex 5. Note on global and regional projections . . . 167
Annex 6. Global employment trends – Regional groupings . . . 170
Tables 1. Labour market situation and outlook . . . 45
2. Labour market trends in CSEE and CIS countries . . . 57
3. Labour market trends and prospects in Latin America and the Caribbean . . . 64
4. Labour productivity gains from sectoral reallocation . . . 67
5. Exports from East Asia to the euro area, October 2011 – April 2012 (% change, year-on-year) . . . . 69
6. Contributions of changes in labour productivity to value added per capita growth . . . 102
7. Cross-validation results on the precision of sectoral value added share predictions . . . 115
Boxes 1. How can uncertainty lead to increased unemployment? . . . . 18
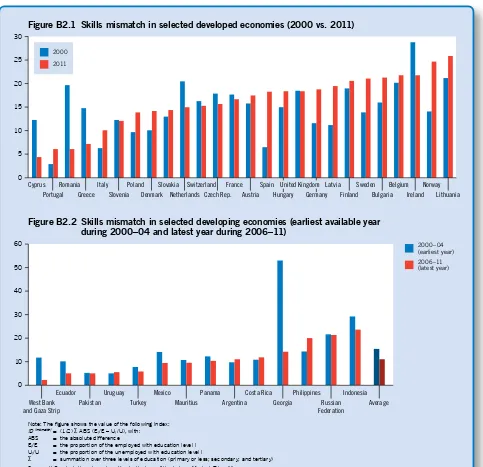
2. Concerns over growing skills mismatch . . . 34
3. New ILO estimates of employment across economic classes in the developing world . . . 40
4. What is measured by the Beveridge curve? . . . 49
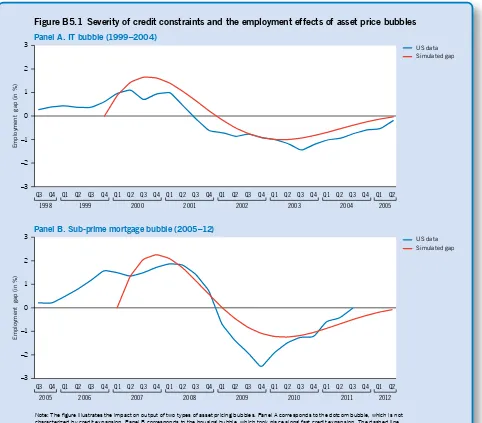
5. Why do some asset price bubbles have worse efects on output and employment than others? . . . 52
6. Short-term sectoral forecast for the United States . . . 55
7. Employment-to-population ratios in Samoa . . . . 73
Contents 5
Country spotlights
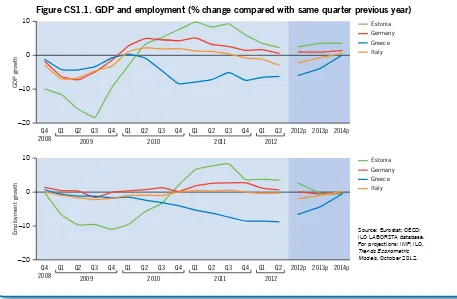
1. Growth and job creation in selected EU countries . . . 48
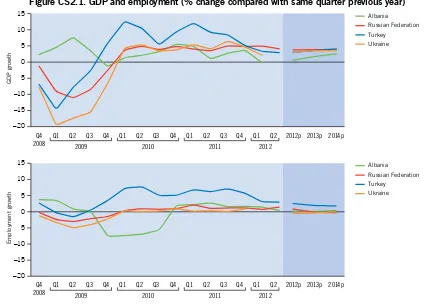
2. Growth and job creation in Albania, the Russian Federation, Turkey and Ukraine . . . 59
3. Growth and job creation in Argentina, Chile, Mexico and Peru . . . . 68
4. Growth and job creation in Hong Kong, China, the Republic of Korea and Taiwan, China . . . 72
5. Growth and job creation in Indonesia, Malaysia, Singapore and hailand . . . 76
6. Growth and job creation in Egypt and Morocco . . . . 89
7. Growth and job creation in Mauritius and South Africa . . . . 95
Figures 1. Global and regional GDP growth estimates and projections, 2010–14 (annual % change) . . . 15
2. Global unemployment trends and projections, 2002–17 . . . . 16
3. Aggregate demand contributions to real GDP growth . . . 19
4. Euro area European Central Bank loans (annualized growth rates) . . . 20
5. Quarterly world merchandise trade by region, year-on-year percentage change 21 6. Policy incoherence between iscal and monetary policy . . . 23
7. Annual change in global unemployment and GDP growth, 1999–2017 . . . . 31
8. Changes in GDP growth and unemployment rates, 2011–12, selected economies . . . 33
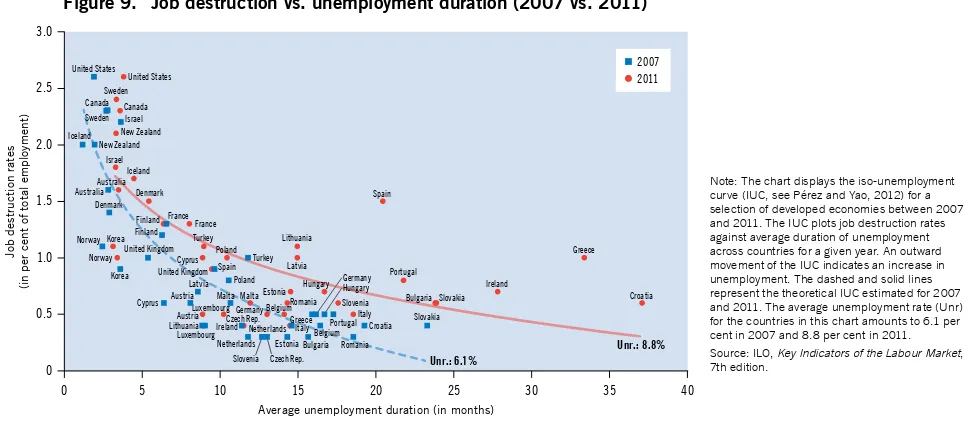
9. Job destruction vs. unemployment duration (2007 vs. 2011) . . . 34
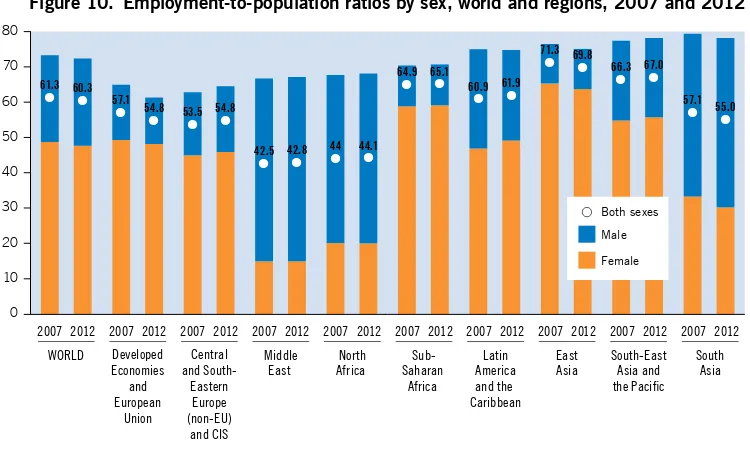
10. Employment-to-population ratios by sex, world and regions, 2007 and 2012 . 37
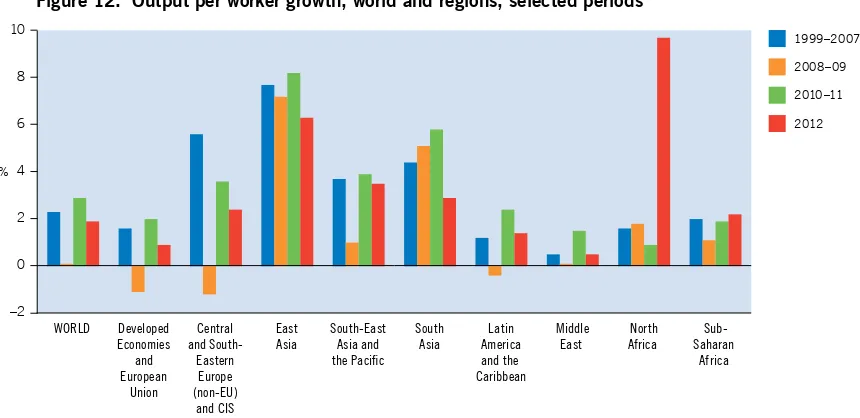
11. Decomposition of changes in the employment-to-population ratio, 2007–12 . . 37 12. Output per worker growth, world and regions, selected periods . . . 39
13. Employment by economic class, 1991–2011, developing world . . . 41
14. Investment is associated with a larger middle-class (2011) . . . 42
15. Unemployment lows: Developed Economies and European Union countries 46 16. he evolution of NEET rates in selected European countries and the Euro area 46 17. Labour market participation gap . . . 46
18. he Beveridge curve in Developed Economies . . . 50
19. he Beveridge curve has moved outward in some advanced economies . . . . . 50
20. Occupational shits . . . . 51
21. he responsiveness of job creation around banking crisis . . . 52
22. Trend unemployment has increased (2011 vs. pre-crisis) . . . 54
23. Unemployment lows: CSEE and CIS countries . . . . 57
24. Male and female labour force participation rate, CIS countries and Georgia, 2010 . . . 58
25. Male and female employment-to-population ratio, CIS countries and Georgia, 2010 . . . 58
26. Incidence of informal employment in Central and Eastern European Countries (2000 vs. 2010) . . . 60
27. Trends and projections for vulnerable employment and working poverty . . . . 60
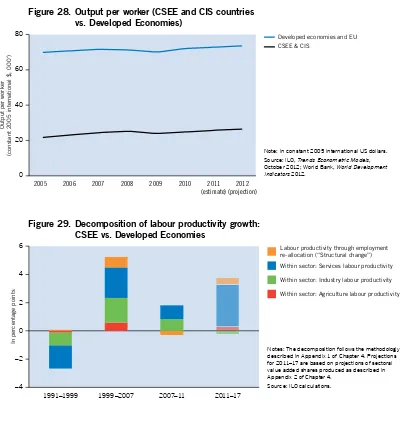
28. Output per worker (CSEE and CIS countries vs. Developed Economies) . . . . 62
29. Decomposition of labour productivity growth: CEES vs. Developed Economies 62 30. Annual growth in Latin America: 1980–2017 (% change) . . . 63
31. Unemployment lows: Latin America and the Caribbean . . . 65
33. Declining working poverty and the emergence of a consumer class
in Latin America and the Caribbean . . . . 65 34. Labour productivity in Latin America and the Caribbean
improves less than the world average . . . 66 35. Real gross domestic product, Q4 2011 – Q2 2012 (% change, year-on-year) . . 69 36. Trends in growth in output per worker, selected Asian countries, 2000–11 . . 75 37. Variation in structural transformation in South Asia . . . . 78 38. Disparities in labour force participation rates (2011) . . . 78 39. Youth unemployment rates in South Asia, latest available year . . . 79 40. Unemployment rates by level of education, Sri Lanka and India
(latest available period) . . . 79 41. Unemployment rate in Middle Eastern countries (in %, latest year) . . . . 81 42. Public sector employment (latest available year) . . . 84 43. Share of women and youth in total unemployment in North Africa,
1991–2012 (%) . . . . 86 44. Distribution of the working-age population in North Africa, 1991–2015 (%) . 86 45. Occupational distribution in Egypt by sex, 2007 (%) . . . . 87 46. Occupational distribution in Morocco by sex, 2008 (%) . . . . 87 47. Regional shares in the global working-age population, 1991,
2012 and 2017 (projection) . . . . 91 48. Regional shares of youth population (in %), 1991–2017p . . . 91 49. Labour productivity in Sub-Saharan Africa and East Asia, 1991–2012 (’000s) 92 50. Employment distribution by status in Sub-Saharan Africa, 1991,
2000 and 2012 . . . 94 51. Decomposition of value added per capita growth into its components,
by region and period . . . 101 52. he relation of investment and structural change, 1999–2011 . . . 103 53. Vulnerable employment dynamics and contributors to value added
per capita growth in developing economies . . . 104 54. Working poverty dynamics and contributors to value added
per capita growth in developing economies . . . 105 55. Middle-class employment dynamics and contributors
to value added per capita growth in developing economies . . . 106 56. Youth unemployment dynamics and contributors to value added
per capita growth in developing and developed economies . . . 107 57. Dynamics in the labour force participation gap and contributors to value
7
Acknowledgements
he Global Employment Trends 2013 report was prepared by the ILO’s Employment Trends
Team. he Team is headed by Ekkehard Ernst, who coordinated the production of the report together with Steven Kapsos. he report was supervised by Moazam Mahmood, Director of the Employment and Labour Market Analysis Department, and José Manuel Salazar- Xirinachs, Executive Director.
he following authors contributed to the report:
Executive summary: Ekkehard Ernst and Steven Kapsos
Chapter 1: Steven Kapsos, with inputs from Ekkehard Ernst, Moazam Mahmood and Woori Lee
Chapter 2: Steven Kapsos, with inputs from Ekkehard Ernst and heodoor Sparreboom
Chapter 3: Developed Economies and European Union: Ekkehard Ernst,
Matthieu Charpe, Christian Viegelahn
Central and South-Eastern Europe (non-EU) and CIS: Olga Koulaeva Latin America and the Caribbean: Juan Chacaltana
and Andrés Marinakis East Asia: Phu Huynh
South-East Asia and the Paciic: Kee Beom Kim South Asia: Sher Verick
Middle East: Ekkehard Ernst and Tariq Haq
North Africa: heodoor Sparreboom and Jean-Paul Barbier Sub-Saharan Africa: Michael Mwasikakata and heo Sparreboom
Chapter 4: Christian Viegelahn
Chapter 5: Ekkehard Ernst, Steven Kapsos, and Christian Viegelahn
Country spotlights were prepared by Christina Wieser, who also provided helpful research assistance for the report. Speciic mention should be given to Evangelia Bourmpoula for pre-paring the global and regional estimates on the basis of the Global Employment Trends (GET) econometric models and for helpful research assistance. Pinar Hosafci prepared the decompo-sition of employment-to-population rates by demographic group. he publication would not have been possible without the contributions of other members of the ILO’s Employment Trends Team – Philippe Blet, Anne Drougard and Alan Wittrup.
he analysis provided in the Global Employment Trends series is only as good as the avail-able input data. We take this opportunity to thank all institutions involved in the collection and dissemination of labour market information, including national statistical agencies and the ILO Department of Statistics, in particular Marie-Claire Sodergren. We encourage addi-tional collection and dissemination of country-level data in order to improve the analysis of employment trends provided in future updates of this report.
9
Executive summary
his Global Employment Trends report for 2013 is a special edition, warranted by the resur-gence of the crisis in 2012. he year 2011 saw a tapering of of the recovery, followed by a dip in both growth and employment in 2012. Unemployment increased by a further 4 million over the course of 2012.
he report examines the crisis in labour markets of both advanced economies and devel-oping economies. he epicentre of the crisis has been the advanced economies, accounting for half of the total increase in unemployment of 28 million since the onset of the crisis. But the pronounced double dip in the advanced economies has had signiicant spillovers into the labour markets of developing economies as well. A quarter of the increase of 4 million in global un-employment in 2012 has been in the advanced economies, while three quarters has been in other regions, with marked efects in East Asia, South Asia and Sub-Saharan Arica.
he report estimates the quantitative and qualitative indicators of global and regional labour markets and discusses the macroeconomic factors afecting the labour markets in order to explore possible policy responses. In estimating labour market indicators, the report uses four key analytical techniques: 1) an ILO hiring uncertainty index indicating persisting weak-nesses; 2) an extension of ILO estimates of the working poor to a full income decomposition of employment to give income classes and their correlation to investment, growth and generation of quality jobs; 3) a breakdown of growth factors which diferentiates between within-sector productivity growth, cross-sector productivity growth, and labour inputs, all of which have signiicant implications for growth patterns in advanced and developing economies; and 4) a Beveridge curve which allows some distinction between cyclical and structural factors afecting the labour market.
Global labour markets are worsening again
In the ith year ater the outbreak of the global inancial crisis, global growth has decelerated and unemployment has started to increase again, leaving an accumulated total of some 197 mil-lion people without a job in 2012. Moreover, some 39 mil197 mil-lion people have dropped out of the labour market as job prospects proved unattainable, opening a 67 million global jobs gap since 2007. Despite a moderate pick-up in output growth expected for 2013–14, the unemployment rate is set to increase again and the number of unemployed worldwide is projected to rise by 5.1 million in 2013, to more than 202 million in 2013 and by another 3 million in 2014. A quarter of the increase of 4 million in global unemployment in 2012 has been in the advanced economies, while three quarters has been in other regions, with marked efects in East Asia, South Asia and Sub-Saharan Africa. hose regions that have managed to prevent a further increase in unemployment oten have experienced a worsening in job quality, as vulnerable employment and the number of workers living below or very near the poverty line increased.
New recession conditions in Europe have been spilling over globally
Lower economic activity and job growth even in countries that had initially escaped the second wave of the crisis constitutes a spillover efect of the weak growth in advanced economies in 2012, in particular recession conditions in Europe. So far, the main transmission mechanism of global spillovers has been through international trade, but regions such as Latin America and the Caribbean have also sufered from increased volatility of international capital lows that have forced them to quickly adjust their macroeconomic policy in order to dampen the efects on exchange rates, thereby weakening their domestic economies.
Growth decelerated by 1.4 percentage points in East Asia, largely due to a notable slow-down in China, where growth slowed to 7.8 per cent – the slowest rate of growth since 1999. In South Asia, where growth in India slowed sharply to 4.9 per cent, the lowest rate of growth in the country in a decade, the regional GDP growth rate decelerated by 1.6 percentage points. he regions of Latin America and the Caribbean and the Middle East also saw a substantial deceleration.
Policy incoherence has led to heightened uncertainty, preventing stronger investment and faster job creation
Incoherence between monetary and iscal policies adopted in diferent countries and a piece-meal approach to inancial sector and sovereign debt problems, in particular in the euro area, have led to uncertainty weighing on the global outlook. Investment has not yet recovered to pre-crisis levels in many countries. he indecision of policy-makers in several countries has led to uncertainty about future conditions and reinforced corporate tendencies to increase cash holdings or pay dividends rather than expand capacity and hire new workers.
The continuing nature of the crisis has worsened labour market mismatches, intensifying downside labour market risks
pos-Executive summary 11
Job creation rates are particularly low, as typically happens after a financial crisis
he origins of the crisis in the inancial sector weigh on job creation. Following banking crises such as the current one, more jobs are destroyed and fewer jobs created as pre-crisis misallo-cation and over-investment require time to be corrected. In advanced economies job destruc-tion rates have increased again ater a short-lived respite in 2010, indicating that further job restructuring is likely before a stronger rebound can be expected in labour markets. Other regions are also still experiencing higher-than-average job destruction rates.
The jobs crisis pushes more and more women and men out of the labour market
Labour force participation has fallen dramatically, in particular in advanced economies, masking the true extent of the jobs crisis. he problem is particularly severe in the developed economies and the EU region where the labour force participation rate declined by close to one percentage point and is expected to recede further as long-term unemployment and a weak economic outlook discourages people from staying in the labour market. As a consequence, the employ-ment-to-population ratio has fallen sharply – in some cases 4 percentage points or more – and has not yet recovered even in cases where the unemployment rate has started to decline.
Youth remain particularly affected by the crisis
Young people remain particularly stricken by the crisis. Currently, some 73.8 million young people are unemployed globally and the slowdown in economic activity is likely to push another half million into unemployment by 2014. he youth unemployment rate – which had already increased to 12.6 per cent in 2012 – is expected to increase to 12.9 per cent by 2017. he crisis has dramatically diminished the labour market prospects for young people, as many experience long-term unemployment right from the start of their labour market entry, a situation that was never observed during earlier cyclical downturns.
Currently, some 35 per cent of all young unemployed have been out of a job for six months or longer in advanced economies, up from 28.5 per cent in 2007. As a consequence, an increasing number of young people have become discouraged and have let the labour market. Among European countries where this problem is particularly severe, some 12.7 per cent of all young people are currently neither employed nor in education or training, a rate that is almost two percentage points higher than prior to the crisis. Such long spells of unemployment and discouragement early on in a person’s career also damage long-term prospects, as professional and social skills erode and valuable on-the-job experience is not built up.
Weak labour markets hold back private consumption and economic growth
Income growth has come under pressure from rising unemployment, putting downward pres-sure on real wages in many advanced economies, thereby lowering the support that private consumption could give to economic activity. Sources of growth, therefore, need to be com-plemented from other areas, in particular stronger growth in private investment but also gov-ernment consumption, at least in countries where iscal space is available.
Despite a recovery over the medium run, unemployment remains elevated
Labour productivity growth has slowed sharply, preventing further gains in living standards
Another inding of this report is that labour productivity growth has slowed sharply in 2012. Ater an initial rebound following the 2009 recession, weak investment and a highly uncer-tain global outlook have put a brake on further increases in productivity. Particularly worrying in this respect is the trend of a slowdown in labour productivity growth observed in certain regions such as Latin America and the Caribbean, suggesting that the gains in the quality of employment observed in these regions over recent years might be diicult to sustain.
Structural change has slowed down in emerging and developing economies, damaging engines of growth
Structural change necessary for emerging and developing economies to improve their stand-ards of living has also slowed during the crisis. In particular the tepid recovery in global investment prevents faster reallocation of resources towards more productive uses in devel-oping economies. Prior to the crisis, many develdevel-oping countries experienced rapid realloca-tion of workers from low- to higher productivity activities across broad economic sectors. Such structural change is an important driver of labour market improvements. In the past, it has helped reduce vulnerable employment and working poverty. Compared to earlier years, however, structural change has lost momentum during the crisis, largely because jobs are no longer moving out of agriculture as fast as before and agricultural productivity growth remains low. Forecasts indicate that Asia and Sub-Saharan Africa are more likely to return to their pre-crisis path of structural change than are Latin America and the Caribbean and Central and South-Eastern Europe. he Middle East and North African economies are expected to remain among the least dynamic economies in terms of sectoral re-allocation of labour.
Further progress in reducing working poverty and vulnerable employment requires higher productivity growth and faster structural change
Despite the slowdown in structural change, the rate of working poverty has continued to decrease, but at a slower pace than before the crisis. Currently some 397 million workers are living in extreme poverty; an additional 472 million workers cannot address their basic needs on a regular basis. As those countries with particularly high rates of working poverty continue to experience faster growth than the world average, the rate of working poverty is expected to continue to decline. However, as they are also growing faster demographically, the abso-lute number of working poor is expected to increase in some regions unless faster economic growth returns.
Vulnerable employment – covering own-account and contributing family workers – is expected to decline but at a slower rate. Informal employment – one speciic form of vulner-able employment – has started to increase again, especially in certain transition economies in Eastern Europe and Central Asia.
A new consumer class is emerging, but is not yet large enough to constitute an independent engine of growth
Executive summary 13
workforce. With the crisis, however, progress in poverty reduction has slowed and could adversely afect growth of the emerging middle class. his will impact negatively on the cap-acity for developing economies to play a stronger role in supporting global economic activity and ofer alternative engines of growth.
Policy makers need to take additional steps to recover from the second jobs dip
he worsening of macroeconomic and labour market conditions in many countries and the risk of the jobs crisis becoming entrenched calls for additional policy action. Some promising areas for action include:
y Tackle uncertainty to increase investment and job creation. Particularly in developed
countries, policy-makers need to address policy uncertainty. his includes providing more coherent and predictable policy plans; measures to increase disposable incomes to foster stronger consumption; prompt implementation of inancial reforms to restore the banking sector to its proper function of supporting investment and providing credit, in particular to SMEs, the key engines of job creation. It also requires credible exit strategies for those countries particularly afected by the debt crisis, for instance by rescheduling sovereign debt and easing inancial burdens of private households.
y Coordinate stimulus for global demand and employment creation. Austerity
meas-ures and uncoordinated attempts to promote competitiveness in several European coun-tries have increased the risk of a delationary spiral of lower wages, weaker consumption and faltering global demand. In light of the global jobs and consumption deicit, coun-tries should adapt the pace of their iscal consolidation to the underlying strength of the economy and recognise that short-term stimulus may be needed to grow out of debt bur-dens. Global policy-makers and coordination bodies such as the G20 and EU should make stronger eforts to avoid beggar-thy-neighbour policies, which are occurring through wage and social protection reductions in Europe as well as through trade and monetary meas-ures in other countries. Policy actions need to be better coordinated globally in order to rebalance growth and foster multipolar growth engines. he growing purchasing power of the emerging middle class in many developing countries could help bring about such a development.
y Address labour market mismatch and promote structural change. he bulk of the
unempoyment crisis is cyclical. However, policy-makers also need to tackle structural problems that intensiied with the crisis, such as skill and occupational mismatches. Weak and unsteady recovery has worsened these problems in some countries and this is likely to put a brake on future recovery in the labour market. Governments should step up their eforts to support skill and retraining activities to address the gaps between demand and supply of work skills and qualiications and to address long-term unemployment. Re-acti-vation and job counselling measures should be enhanced. he global crisis has lowered the pace of structural change in many developing regions, calling for policies to improve productivity and facilitate workers’ mobility across sectors. Where employment in agri-culture is particularly signiicant, governments need to pursue measures to accelerate productivity growth in that sector and diversify the work and investment opportunities in rural areas.
y Increase eforts to promote youth employment – with a special focus on long-term
unemployment for youth. High and rising youth unemployment rates have spurred
15
1. Macroeconomic challenges
have worsened
The global economic slowdown intensifies in 2012
Heightened uncertainties contributed to a widespread slowdown in 2012
he global economic and jobs crisis has entered its ith year, following a year of economic adversity and disappointing labour market trends. Ater a relatively encouraging irst quarter, the crisis returned during the remainder of 2012, with weakening economic growth in nearly every region of the world (see Figure 1). On an annualized basis, global economic growth is estimated to have decelerated to 3.3 per cent in 2012, compared with 3.8 per cent in 2011 and 5.1 per cent in 2010. hese adverse macroeconomic trends occurred alongside rising uncer-tainties stemming from a number of factors, most importantly the prolonged and deepening crisis in the Euro area and policy ambiguity related to iscal tightening and the debt ceiling debate in the United States (see also box 1, p. 18).
he largest growth deceleration occurred in the Central and South-Eastern Europe (non-EU) and CIS region, with annual output growth falling to 3.5 per cent versus 5.5 per cent in each of the two previous years (see Figure 1). he Developed Economies and European Union region grew by only 1.2 per cent, versus 1.5 per cent in 2011 and 2.5 per cent in 2010. Growth decelerated by 1.4 percentage points in East Asia, largely due to a notable slowdown in China, where growth slowed to 7.8 per cent – the lowest rate of annual growth since 1999. In South Asia, where growth in India slowed sharply to 4.9 per cent, the lowest annual rate of growth in the country in a decade, the regional GDP growth rate decelerated by 1.6 per-centage points. he regions of Latin America and the Caribbean and the Middle East also saw a substantial deceleration.
Source: IMF, World Economic Outlook, October 2012.
A
n
n
u
al G
D
P g
ro
w
th (
in p
e
r c
e
n
t)
Figure 1. Global and regional GDP growth estimates and projections, 2010–14 (annual % change)
–2 4
2 6 8 10
Central and South-Eastern
Europe (non-EU)
and CIS Developed
Economies and European
Union
East Asia Latin America and the Caribbean
Middle East North Africa South-East
Asia and
the Pacific
South Asia Sub-Saharan Africa WORLD
2010 2011 2012p 2013p 2014p
However, in 2012 some regions resisted the slowdown in global growth. In the North Africa region, output growth surged by more than 10 percentage points year-over-year, but this was largely a rebound following wartime conditions in Libya during the previous year. In South-East Asia and the Paciic, which has demonstrated remarkable economic resilience throughout the past year, growth accelerated to 5.2 per cent, versus 4.6 per cent in 2011. Sub-Saharan Africa, which notably has shown solid and relatively high growth in the past decade, also performed well throughout 2012, with robust 5.3 per cent rate of growth, a slight uptick over 2011.
Global unemployment started to rise again while
other indicators also suggest rising distress in labour markets
he acceleration of global growth is likely to be insuicient to prevent a deterioration in un-employment, which has reacted with a lag to the sharp deceleration in growth over the pre-vious 2 years (see Figure 2). Global unemployment rose to 197.3 million in 2012, an increase of 4.2 million over the previous year and 28.4 million above the level in 2007, the year pre-ceding the crisis. Moreover, given the slowdown in activity, the ILO’s baseline projection is a further deterioration in 2013, with the global unemployment rate ticking up to 6 per cent and a further increase in the number of unemployed around the world of 5.1 million. On the basis of current macroeconomic forecasts, the global unemployment rate is projected to remain at around 6 per cent until at least 2017.
Other key labour market indicators provide further evidence of rising distress in labour markets around the world (see chapter 2). Labour force participation rates continued to decline in many countries and long-term unemployment rates remained high or kept rising in devel-oped economies, signalling widespread discouragement, growing labour market detachment and increasing structural unemployment problems. his can have adverse long-term conse-quences for workers in terms of diminished skills, growing skills mismatches, and reduced employability, weighing on economies’ trend rates of output growth.
In developing countries, there is evidence that productive structural change – the shit in employment out of lower productivity sectors into higher productivity ones – has slowed, weakening a key driver of job quality growth that has been associated with poverty reduc-tion, falling shares of vulnerable employment and growth in the developing world’s emerging middle class (see chapter 4 for a detailed analysis of these trends).
U
n
e
m
p
lo
ym
e
n
t r
a
te (
%
)
tal u
n
e
m
p
lo
ym
e
n
t (
in m
il
li
o
n
)
Figure 2. Global unemployment trends and projections, 2002–17
160 170 180 190 200 210 220
5.2 5.4 5.6 5.8 6.0 6.2
6.4 Total
unemployment Unemployment rate
1. Macroeconomic challenges have worsened 17
Rising uncertainty and depressed labour markets
feed on each other
Unresolved inancial sector issues and recession-induced public debt problems in developed economies continue to weigh on private consumption, investment and public expenditure, thereby raising uncertainty. Credit conditions remain tight in many countries despite record low central bank interest rates as banks continue to clean up their balance sheets and face chal-lenges to comply with new regulatory provisions. Households are not spending more as they continue to deleverage in order to recover from loss of asset and wage income. Firms, facing both less demand for their products and diiculties in access to inancing, are holding back new investment and prefer keeping liquid assets rather than committing to ixed capital out-lays. Finally, public support to the banking sector and recession-induced widening of public deicits have both led to a sudden acceleration in public debt, creating concerns about iscal sustainability and causing the costs of borrowing inluenced by treasury yields to skyrocket in certain countries, notably in Europe. Together, private sector deleveraging and public sector iscal woes have seriously deteriorated the outlook.1 A negative spiral is operating whereby the deterioration in the real economy, the labour market and inancial sector diiculties feed on each other through heightened uncertainty, preventing a sustainable recovery from taking hold (see Box 1).
he rise in uncertainty, originating mainly in developed countries, has weakened global growth by weighing on both consumption and investment in diferent countries and regions (see Figure 3). High and persistent unemployment has let wage earners with weak dispos-able incomes. At the same time, global investment slowed alongside deleveraging in advanced economies. As a consequence, in 2012 investment contributed only 0.7 percentage points whereas private consumption added only 1.3 percentage points to global output growth (at market prices), the lowest rates for both factors since the peak of the crisis in 2009. he slowdown in investment and consumption was most notable in the Euro area, contributing –1.0 and –0.6 percentage points respectively to economic growth, sending the region into recession.
In the United States, where GDP growth was little changed in 2012 versus 2011 and where productivity growth has held up relatively better in comparison with employment growth, the contribution of investment to GDP growth increased to 1.0 percentage point, compared with 0.8 percentage points in the previous year. In contrast, the contribution from private consumption growth declined to 1.3 percentage points in 2012 compared with 1.8 percentage points in 2011. Notably, in the United States, slower growth in government spending resulting from reduced iscal stimulus measures and reduced government employ-ment served as a drag on growth over the past 2 years. In China, where growth slowed sig-niicantly in 2012, growth in investment contributed only 3.2 percentage points to overall GDP growth over the past year versus 3.8 percentage points in the previous year, while the contribution from consumption also declined moderately.In India,growth in investment con-tributed 1.5 percentage points to overall GDP growth over the past year, down from 1.8 per-centage points in 2011, while the contribution from consumption declined to 2.8 per cent versus 3.2 per cent the previous year. In Brazil, the contribution of investment to overall GDP growth turned negative, to –0.8 percentage points, compared with 1 percentage point in 2011. he contribution from consumption slowed modestly.
Box 1. How can uncertainty lead to increased unemployment?
The theoretical relationship between uncertainty and macroeconomic performance is fairly well estab-lished – namely that heightened uncertainty leads to reduced investment and consumption, thereby reducing economic growth. At the same time, given the multitude of measures of uncertainty and a number of different analytical approaches utilized in the literature, the precise magnitude of the effects of uncertainty on growth and labour markets is less well understood.
To assess the impact of the recent increase in
uncertainty on global growth, the IMF’s World
Eco-nomic Outlook, October 2012 (IMF, 2012b) estimates the impacts of uncertainty during the global eco-nomic crisis by focusing on measures of uncertainty including volatility in stock returns, the degree of policy uncertainty (indicated by keywords in the press), and other indicators. The report finds that a one standard deviation increase in uncertainty is associated with a decline in output growth of between 0.4 and 1.25 per -centage points. The authors find that increased uncer-tainty has the biggest negative impact on investment growth, followed by output and consumption growth. The study finds a sharp increase in policy uncertainty between 2006 and 2011 of about five standard devia -tions, which may have reduced growth in advanced economies by 2.5 percentage points.
How does this heightened level of uncertainty affect labour markets? A recent study by researchers at the Federal Reserve Bank of San Francisco (Leduc and Liu, 2012) finds that increased uncertainty has a direct, positive relationship with unemployment. In addition to reduced private sector investment which lowers demand for new workers, the main mechanism through which uncertainty affects unemployment is through reduced vacancies and job matching. As the hiring of an employee represents a long-term commit-ment and entails a cost to the firm, heightened uncer-tainty reduces firms’ willingness to hire as it reduces visibility into future demand for their goods or services. As a result, firms post fewer vacancies, leading to a decline in the job finding rate and an increase in
unemployment. This, in turn, has a negative impact on household incomes, which reduces aggregate demand. Using data on consumer and employer perceptions regarding uncertainty, the authors find that height-ened uncertainty has lifted the unemployment rate in the United States by at least 1 percentage point since early 2008, while lowering the inflation rate. This rep-resents a disproportionately large shock in comparison with previous recessions, which they posit may be due to fewer monetary policy options in the current near-zero nominal interest rate environment to address the shortfall in aggregate demand due to uncertainty. Similar results are found for the United Kingdom.
Figure B1.1 shows two different measures of uncertainty and the unemployment rate of G7 coun-tries. The ILO hiring uncertainty index is based on estimates of implied volatility that result from survey results on hiring intentions in G7 countries. The index reflects changes in the assessment by employers regarding the economic outlook when taking hiring decisions (see Appendix 1, p. 27). The policy uncer -tainty index of Baker et al. (2012) reflects uncer-tainty about economic policies and includes information on news coverage of policy-related uncertainty and disagreement among forecasters. The two indices are highly correlated with each other as well as with the unemployment rate of G7 countries. Furthermore, trends in uncertainty seem to precede changes in the unemployment rate, at least at the onset of the cur-rent crisis, suggesting that an uncertain environment needs to prevail for a while before having a severe impact on unemployment.
The policy implications are significant: if increased uncertainty does indeed lead to a decline in aggre-gate demand and a rise in the unemployment rate, this would argue for easier fiscal and monetary policy in countries in which this is likelyto help offset the decline in output and employment. Better policy coordination at the international level could provide a further boost to growth and jobs, as this would help to restore confidence, promoting consumption, invest-ment and hiring.
0 20 40 60 100 4.5 5.5 6.5 7.5 8.5
Figure B1.1 Uncertainty and unemployment in the G7
2003 2004 2005 2006 2007 2008 2009 2010 2011
U n c e rt a in ty in d e x (0 : m in imu m , 1 0 0 : m a xi mu m ) U n e m p lo ym e n t r a te ( in % ) 2012
Policy uncertainty index ILO hiring uncertainty index Unemployment rate
1. Macroeconomic challenges have worsened 19
Global uncertainties rose alongside recession conditions in Europe
in 2012, but other sources of uncertainty set to diminish
Entering 2013, the crisis in the Euro area constitutes the single biggest risk to global employ-ment trends for the year ahead (IMF, 2012b; OECD, 2012; United Nations, 2012a). he inancial crisis in the Euro area, brought on by a combination of banking sector distress and protracted inancial and household deleveraging, coupled with high levels of sovereign debt and unsustainably high government bond yields in some countries, has emerged as a
World –4 –3 –2 –1 1 3 4 2 5 Euro area –6 -2 -4 2 4 Brazil –4 –2 6 4 2 8 10 United States –5 –4 –3 –2 –1 1 2 3 4 India –4 –2 4 8 10 6 2 12 14
Figure 3. Aggregate demand contributions to real GDP growth
2005 2006 2007 2008 2009 2010 2011 2012 2013p 2005 2006 2007 2008 2009 2010 2011 2012 2013p
2005 2006 2007 2008 2009 2010 2011 2012 2013p 2005 2006 2007 2008 2009 2010 2011 2012 2013p
External balance Government consumption Gross fixed investment Private consumption GDP (annual % change)
0 0 0 China –4 4 8 12 16
2005 2006 2007 2008 2009 2010 2011 2012 2013p
0
2005 2006 2007 2008 2009 2010 2011 2012 2013p
0
0
Note: The figure displays the contributions of private consumption, gross fixed investment, net exports and government consumption to GDP growth. Aggregate demand contributions are displayed in percentage point contribution to GDP growth; real GDP growth is given in per cent: p = projection. Source: EIU Country Data, Extracted 9 January 2013.
3.5 4.1 4.0 1.3 –2.2 4.0 2.7 2.2 2.4 1.8 3.4 3.0 0.3 –4.4 2.0 1.5 –0.5 –0.2 3.1 2.7 1.9 –0.3 –3.1 2.4 1.8 2.2 2.1 11.3 12.7 14.2 9.6 9.2 10.4 9.3 7.7 8.5 3.2 3.9 6.1 5.2 –0.3 7.6 2.7 1.0 3.5
9.3 9.3 9.8
3.9 8.2
9.6
6.9
disruptive and destabilizing force not only in the Euro area itself, but also for the global economy as a whole.
GDP growth rates declined in the Euro area in 2012, with a notable slowdown in the area’s largest economies, Germany and France, where growth rates fell to 0.9 per cent and 0.1 per cent, respectively, down sharply from 3.1 per cent in Germany and 1.7 per cent in France in 2011. Furthermore, seven out of the Euro area’s 17 economies contracted in 2012: Output in Greece plunged by 6 per cent, and declined by 3 per cent in Portugal, by 2.3 per cent in Cyprus and Italy, by 2.2 per cent in Slovenia, by 1.5 per cent in Spain and by 0.5 per cent in the Netherlands. Greece experienced the ith consecutive year of falling output since 2008 and has contracted by around 20 per cent since 2007.
Despite emergency measures such as the European Financial Stability Facility (EFSF), the European Stability Mechanism (ESM) as well as a number of extraordinary – implemented or announced – monetary interventions by the European Central Bank, growth throughout the Euro area has continued to deteriorate, with labour markets in several Euro area economies in deep distress. Credit remains tight, with near zero growth in credit to households and credit to the private sector contracting over much of 2012 (see Figure 4). his has adversely afected investment by the private sector and private consumption, which was already weak due to deleveraging. In addition, small and medium-sized enterprises (SMEs) account for a large share of private sector job creation in most countries and are typically highly reliant on bank credit to maintain and expand operations (ILO, 2012d). his is a direct and important channel through which tightening credit conditions can adversely afect job creation.
Given the lack of a iscal union in the Euro area or the possibility to (partially) mutualize public debt obligations,2 options for promoting growth in the hardest-hit countries have been limited. On the iscal side, the main mechanism for dealing with the sovereign debt crisis in these countries has thus far been austerity – deep cuts in public spending with the aim of sta-bilizing government inances and reassuring bond markets. he primary policy instruments have been public wage freezes and cuts in public employment and social security entitlements (Annex 2 provides key policy developments in selected countries). A negative side-efect of this course of action has been further deterioration in growth and labour market trends in countries facing the greatest constraints in credit markets. his, in turn, has led to negative spillover efects due to reduced business and consumer conidence in Euro area economies with otherwise healthy balance sheets, such as Germany.
As a consequence, uncertainty surrounding the macroeconomic outlook grew signii-cantly in Europe in 2012, though the most pressing worries surrounding a break-up of the
Source: European Central Bank Monetary Statistics, September 2012.
Figure 4. Euro area European Central Bank loans (annualized growth rates)
–15 –5
–10 5 10
2010 2011 2012 Q1
2012 Q2
2012 May
2012 June
2012 July
2012 August
Insurance corporations and pension funds
Other financial
intermediaries
Non-financial
corporations Households %
1. Macroeconomic challenges have worsened 21
some of the uncertainty overhang was removed with the recent legislation to avoid the “iscal clif”, and there have been notable improvements in previous sources of economic strain, such as the housing market. Growth in many Asian economies and in Sub-Saharan Africa, while slower than in the initial recovery period remains fairly robust and will provide some support to global growth.
To restore conidence, the pressing challenge in Europe and elsewhere is to efectively restart the engines of economic growth – most urgently in countries facing a prolonged con-traction in economic activities. Also needed will be continued action on the part of policy-makers to enact extraordinary iscal and monetary measures to support growth, along with strong international policy coordination.
Slowing trade and volatile investment flows spread
risks globally, in particular to developing regions
Rising global uncertainties, tight credit conditions for households and irms, public sector aus-terity measures and the resulting slowdown in aggregate demand are also having an adverse impact on trade and investment lows. his poses a growing challenge, particularly in those developing countries that strongly rely on external demand to pull their economic growth. As a consequence, ater robust growth in exports and imports during the irst three quarters of 2011, growth in global merchandise trade decelerated sharply beginning in Q4 2011, falling further in Q1 2012 and turning negative in the second quarter of the year (see Figure 5). he World Trade Organization forecasted in September that global merchandise trade would grow by 2.5 per cent in 2012, down from the previous forecast of 3.7 per cent made in April.3
While all regions have experienced a signiicant downturn in merchandise trade growth, Europe has seen the largest decline in both exports and imports, which contracted at an annual rate of 7.5 per cent and 10.2 per cent respectively in Q2 2012. Merchandise exports also began to contract in South and Central America, and growth in imports also slowed substantially. he United States was a relative bright spot, as export growth slowed, but remained above 5 per cent in the second quarter, while in Asia, merchandise export growth was slow in both Q1 and Q2 of 2012, at around 4 per cent, and import growth also slowed sharply. While these declines in trade have direct, adverse efects on workers in the import- and export-oriented
3 “Slow global growth to hit trade in 2012 and 2013, WTO says”. World Trade Organization Trade Statistics, 21 Sep-tember 2012 http://www.wto.org/english/news_e/pres12_e/pr676_e.pdf.
Exports
–15 –10 –5 5 10 20 25 35
15 30 40
Imports
Figure 5. Quarterly world merchandise trade by region, year-on-year percentage change
0
Q1 Q2 Q3 Q4 Q1 Q2
World North America
and Mexico South and Central America
Europe Asia
2011 2012
Q1 Q2 Q3 Q4 Q1 Q2
2011 2012
Source: World Trade Organization, Short-term merchandise trade statistics, extracted 3 October 2012. %
–15 –10 –5 5 10 20 25 35
15 30 40
0
industries themselves, spillover efects to other industries connected with export industries can also be substantial.
he overall slowdown in economic activity is an important contributing factor behind the slowdown in trade lows. he very large magnitude of the drop in trade points, however, to an additional, related factor: declining trade inancing. Short term trade inance loans play a key role in facilitating global trade operations, and thus tightening credit conditions, particu-larly in Europe, are creating a more diicult environment for businesses reliant on short term credit to fund trade and other business operations.4 Already towards the end of 2011, there was a sharp reduction in new trade inance lending by many European banks. As European banks account for more than a third of the overall global trade inancing market, worsening crisis conditions in Europe could have devastating consequences for trade, not only in Europe, but also in Asia, Latin America and West Africa, among other regions (Feyen et al., 2012).
he challenges posed by slowing global trade are compounded by increased volatility of international investment lows. Volatile capital lows amplify the risk of economic and inan-cial instability, particularly in developing economies, as heightened risk aversion can lead to a sudden withdrawal of international capital. At the same time, eforts to increase liquidity in inancial markets during periods of strain through exceptionally low interest rates and additional, unconventional monetary easing measures can lead to speculative capital lows to developing countries, potentially raising inlation and leading to asset price bubbles (Akyüz, 2011). his also raises the risk of a reacceleration in food price inlation, with devastating con-sequences for the poor (United Nations, 2012a). Developing economies reliant on assistance may also be harmed by reduced development inancing due to weaker economic conditions in developed economies.
Protectionism and policy incoherence could
create further risks for the global economy
The risk of self-defeating protectionism
Rising economic stress has led to calls for protectionist policies at the national level and increased use of trade barriers (WTO, 2012). Even though they might provide temporary relief for some industries in turmoil, such measures are likely to reduce the aggregate, longer term performance of the global economy, thereby harming the global labour market. While there has not been a marked rise in trade protectionism over the past year, rhetoric sur-rounding international trade policy relects growing pressure on policy-makers to enact pro-tectionist measures that could ultimately harm growth and prospects for recovery.
1. Macroeconomic challenges have worsened 23
Incoherent fiscal and monetary policy, and limited international
coordination contributed to heightened uncertainty
In comparison with the crisis years of 2008 and 2009, the stance of monetary and iscal pol-icies in G20 countries has lost coherence, thereby increasing uncertainty and limiting policy efectiveness to support the recovery (see Figure 6). Indeed, major central banks continue to support the real economy with an accommodative stance of monetary policy, having lowered interest rates to near their lower limit and expanding the monetary base through exceptional interventions. At the same time, however, the substantial increase in public debt, especially among advanced economies, has triggered un-coordinated policy action to restore iscal sus-tainability through austerity measures. Such policy incoherence prevents a stronger recovery from taking hold. Such an approach is unsustainable in the long-term as public debt levels continue to rise despite these austerity measures. Loose monetary policy in the absence of a stronger reaction of the real economy has created concerns with regard to inancial stability, in particular in emerging economies (see chapter 3), thereby further increasing uncertainty to the outlook.
One source of policy incoherence stems from the uncoordinated nature with which iscal austerity measures are currently being implemented. Since 2009, when at the height of the inancial crisis, governments opened their purses to support both the real economy and the inancial sector with additional funds, government spending as a share of GDP has lost around 2.5 percentage points in advanced G20 countries and half a percentage point in emerging G20 countries (see IMF, 2012a). he high and rising debt ratios resulting from the recession-induced lower tax revenues and additional expenditure in support measures have increased pressure on governments to return to more sustainable iscal positions, at least over the medium-run. Some countries that already had a weak iscal position prior to the crisis were forced to implement substantial austerity packages, cutting down spending and inding new ways to raise government revenues. However, by implementing such austerity measures without regard to the broader global economic outlook, the strategy proved self-defeating as several major economies embarked on similar delationary policies at the same time, thereby reducing aggregate demand both at home and abroad (see IMF, 2012b). he fact that monetary policy has already reached some limits in its capacity to support the economy (“zero lower bound”, see Woodford, 2012) has further worsened the impact of such uncoor-dinated iscal austerity measures on the real economy.
–12
–20 –10 0 10 20 30 40 50 60
–6 6
Figure 6. Policy incoherence between fiscal and monetary policy
0
Note: The chart displays the change in government spending between 2009 and 2012 (as a share of GDP in percentage points) versus a change in the money supply between 2007 and 2012 (measured as the monetary aggregate M2 as a share of GDP). Source: IMF, Fiscal Monitor, October 2012; Economist Intelligence Unit, November 2012; own calculations.
ARG
AUS BRA
CAN
CHE
DEU
FRA GBR
IDN
IND
ITA
JPN
KOR MEX
RUS
SAU TUR
USA ZAF
Monetary contraction
with fiscal stimulus
Monetary contraction
with fiscal contraction with fiscal contractionMonetary stimulus Monetary stimulus with fiscal stimulus
Change in money supply (2012 vs. 2007) (in percentage points)
C
ha
ng
e i
n g
ov
er
nm
en
t s
pe
nd
in
g (2
01
2 v
s. 2
0
0
9
)
(i
n p
er
ce
nt
ag
e p
oi
nt
Policy coherence cannot be restored by unilateral action on the iscal side. Major econ-omies and economic blocs need to provide further support to the real economy both on the monetary and the iscal side. On the monetary side, authorities have to make a credible com-mitment that their support measures will continue to operate as long as the economy and labour markets have not yet started to recover in a sustainable manner. his requires that funds provided through exceptional liquidity measures reach the real economy in the form of improved access to credit and a stabilized banking sector, a situation that still has not been achieved in some crisis countries. On the iscal side, policy coherence requires that countries that have the possibility to support the economy continue to do so. Not all countries are cur-rently in such a situation but those which have seen their public debt reach unsustainable levels will need to be able to rely on support from external demand and the global economy. More importantly, all countries need to strongly focus their iscal policies towards supporting job creation and employment growth, scrutinizing their adjustment measures against poten-tial negative efects for labour markets.
Inflationary pressures remain subdued in most countries,
leaving space for accommodative monetary policies
Globally, inlationary pressures have declined over the past year, with growth in consumer prices slowing to 1.9 per cent in 2012 in the advanced economies, versus 2.7 per cent in 2011 and from 7.2 to 6.1 per cent in emerging and developing economies over the same period. Oil prices, which rose sharply in 2011, have remained below their 2011 peak throughout 2012 and are projected to change little in 2013.5 Food prices accelerated broadly in 2012 without reaching similar peaks as in 2007. Nevertheless, both oil and broader commodity prices remain substantially higher than the trough that was reached during the global economic crisis. his has been a boon to commodity exporters during the economic recovery – particu-larly to the many countries in Sub-Saharan Africa and Latin America in which commodity exports constitute more than half of total exports – and their growth rates remain robust.6 Yet, commodity exporters are also at risk in the event of a decline in prices going forward. In addition to lower rates of economic growth, such a slowdown could adversely afect external and iscal balances in countries dependent upon commodities for export revenues.
1. Macroeconomic challenges have worsened 25
The economic outlook remains cloudy
The macroeconomic outlook for 2013 entails significant
downside risks even as some risks have improved
he global economy is projected to show a modest rebound beginning in 2013, with output growth edging up to 3.6 per cent versus 3.3 per cent in 2012 (IMF, 2012b). All regions are expected to see moderately increased growth, except North Africa, where growth of 4.4 per cent is projected, a reversion to a more typical rate following the post-conlict surge in 2012, and Sub-Saharan Africa, where output is projected to remain at a healthy rate of 5.3 per cent. Yet, whether or not the modest global recovery that is currently projected will emerge is highly dependent on the ability of governments to put in place the necessary policy mix in order to reverse negative trends that have become more entrenched over the past year. In particular, this requires ending the negative feedback loop between the macro economy and labour mar-kets, and restoring conidence by seriously tackling tail risks.
Even if the expected recovery is set to strengthen, global unemployment is likely to remain elevated and even increase further over the short term. Partly, this is related to the inherent lag with which labour market developments react to improvements in output growth. In add-ition, the crisis origins in the inancial sector have further weakened the efect of growth on job creation (see also chapter 3 for a discussion of this point). Finally, overall growth simply remains too weak for a stronger jobs recovery to take hold.
In this respect, key macroeconomic risks to the outlook for 2013 include a further dete-rioration in the Euro area, where the baseline scenario of modest recovery is dependent upon policy-makers to continue to establish credible policies to promote iscal integration of Euro area economies. he negotiations in the United States surrounding the country’s debt ceiling and the expenditure side of the “iscal clif” represents an additional risk, as the baseline assumes that policy-makers successfully reach agreement to avoid automatic reductions in government expenditure and tax increases, particularly on the middle-class.
As highlighted above, further deterioration in global trade represents another risk to the global economic recovery. Policy leadership and international coordination are needed to avoid protectionism and reaccelerate global trade growth. In particular, policies to pro-mote aggregate demand through the consumption and investment channels – by reducing the uncertainty overhang and supporting employment generation – could alleviate some of the main underlying forces hindering a more robust economic recovery, while also reducing the risks associated with rising social unrest.
Longer term prospects also at risk
he scars let by the crisis are threatening longer term growth and development prospects. Persistent weakness in the global economy, particularly in the advanced economies, is holding back private sector hiring, leading to increased unemployment and larger numbers of long-term unemployed. As related skills mismatches rise, potential growth rates are likely to fall going forward. In addition, recession conditions in many European countries are reducing government revenue, leading to larger budget deicits and growing debts, increasing the burden of future interest payments and limiting available spending for public investment, social programmes and automatic stabilizers.
Finally, a sustainable long-term recovery will require further and sustainable rebalancing of global demand. In advanced economies in particular, this will require increased invest-ment in productive capacity to reaccelerate productivity growth and employinvest-ment generation. Longer term growth prospects in developing economies will require continued productive structural change, which can facilitate further growth in the emerging middle-class, increased consumption, and a reduction in vulnerable employment and working poverty. As this report shows, however, on both accounts suicient improvement is not expected over the medium run, putting at risk a more sustainable recovery of the global economy and the world of work.
1. Macroeconomic challenges have worsened 27
Appendix 1. The ILO hiring uncertainty index
he ILO has developed a new indicator which captures the assessment by employers of the uncertainty of the labour market outlook when taking hiring decisions. he ILO hiring uncertainty index is based on work by Black and Scholes (1973) regarding the pricing of options and other inancial derivatives. It is calculated for all G7 countries and makes use of an economy-wide indicator of hiring intentions of the ManpowerGroup which is estimated from a survey of employers. he indicator measures hiring intentions and is calculated as the diference between the percentage of employers that expect an increase of employment in their establishment for the next quarter and the percentage of employers that expect a decrease.7
Indicators on hiring intentions such as the one published by the ManpowerGroup con-tain information on the expectations of both market trends and volatility. In order to extract the element related to the private sector’s assessment of uncertainty and to construct the ILO hiring uncertainty index, the hiring intentions are interpreted as an option price. In this inter-pretation, hiring intentions relect the value employers give to open a vacancy in order to hire new personnel with an expected productivity level in the next quarter, taking the short-term interest rate into account. In contrast to a inancial derivative, however, there is no market for vacancies (nor for the underlying hiring intentions). his requires some adjustment in inter-preting the irst-pass results from applying the Black–Scholes formula to the labour market.
he irst step in estimating the ILO hiring uncertainty index consists in estimating the implied volatility based on the formula provided by Black and Scholes (1973). For that, the current productivity level is interpreted as the “stock price” of the underlying asset and cor-responds to value added per worker. Expected productivity is the “strike price” at which the option is executed and is derived by applying growth rates of potential output over potential employment to productivity levels that are currently observed. In order to ensure consistency between the values for the hiring indicator as price of the option and the values for labour productivity as prices of the underlying asset, the hiring indicator irst is rescaled so that the minimum value in the time series becomes 0 and the maximum value 10,000.8 In order to exclude business-cycle related efects and to extract the part of the implied volatility series that uniquely relates to labour market uncertainty, in a second step the implied volatility is regressed on the hiring index. he residual from this regression is once more rescaled so that the minimum value of the time series becomes 0 and the maximum value is set to 100. he rescaled residual is the ILO hiring uncertainty index.
his ILO hiring uncertainty index relects the assessment of employers about the vola-tility of future labour market developments. If the market uncertainty perceived by employers is high, there is a signiicant probability for hired workers to be much less productive than expected. his is then indicated by a larger value for the hiring uncertainty index. If the eco-nomic outlook is less uncertain and workers’ productivity is likely to be close to the expecta-tion, the index will be lower.
7 See http://www.manpowergroup.com/press/meos_landing.cfm.
Appendix 2. Public sector, social security and labour market
measures in selected countries
Country Public Expenditure Measures Public Revenue Measures Labour Market
Measures
Public wages Public employment Pensions, subsidies Social security contributions
Income taxes Minimum wages
Austria Wage freeze for 2013
Hiring freeze until 2014
Stricter eligibility conditions on pen-sions and early retirement
Belgium Reduction by
5.5% between 2008 and 2012
Increase of early retirement age from 60 to 62 with a career of 40 years, with exceptions for some professions
Bulgaria Increase of
retire-ment age by 1 year
Raise from BGN 270 to BGN 290 (monthly minimum wage as % of average wage decline from 39.5% in 2008 to 33.7% in 2011)
Cyprus Wage cut of 10% for new entrants; wage freeze for
2 years
Reduction of 5,000 over the next 5 years
Increase of 3% on gross pensionable earnings; temp-orary contribution on gross earnings of public/ private sector employees for 2 years
Czech Republic
Wage cut of 10% (excluding teachers)
Increase for high income earners
Estonia Wage cut of 10% in public adminis-tration and 3% in education in 2009-2010; Wage freeze in 2011-2012
Increase in unemployment insurance tax up to
4.2 per cent
France Wage cut of 10% for starting wages in 2000-2010
Replacement freezing scheme affecting 30,400 civil servants
Increase of retire-ment age from 60 to 62 for selected groups
Increase of 0.2% of 2% social security contribution on capital income
Temporary increase of 3% on high-income households; Increase of 5% in corporate taxation
Greece Wage cut by 10% for local political staff; 15% in public sector salaries; abolition of 13th and 14th monthly salary
<

![Global Employment Trends 2013: Recovering from a second jobs dip [Summary] - 0.3 MB](data:image/gif;base64,R0lGODlhAQABAIAAAP///wAAACH5BAEAAAAALAAAAAABAAEAAAICRAEAOw==)