Chapter VII
Chapter VII
Causal Research Design:
Causal Research Design:
Experimentation
Chapter Outline
1) Overview
2) Concept of Causality
3) Conditions for Causality
4) Definition of Concepts
5) Definition of Symbols
6) Validity in Experimentation
7) Extraneous Variables
9) A Classification of Experimental Designs
9) A Classification of Experimental Designs
10) Pre-experimental Designs
10) Pre-experimental Designs
11) True Experimental Designs
11) True Experimental Designs
12) Quasi Experimental Designs
12) Quasi Experimental Designs
13) Statistical Designs
13) Statistical Designs
14) Laboratory vs. Field Experiments
14) Laboratory vs. Field Experiments
15) Experimental vs. Non-experimental Designs
15) Experimental vs. Non-experimental Designs
16) Limitations of Experimentation
16) Limitations of Experimentation
17) Application: Test Marketing
18) Determining a Test Marketing Strategy
18) Determining a Test Marketing Strategy
19) International Marketing Research
19) International Marketing Research
20) Ethics in Marketing Research
20) Ethics in Marketing Research
21) Internet and Computer Applications
21) Internet and Computer Applications
22) Focus on Burke
22) Focus on Burke
23) Summary
23) Summary
24) Key Terms and Concepts
24) Key Terms and Concepts
25) Acronyms
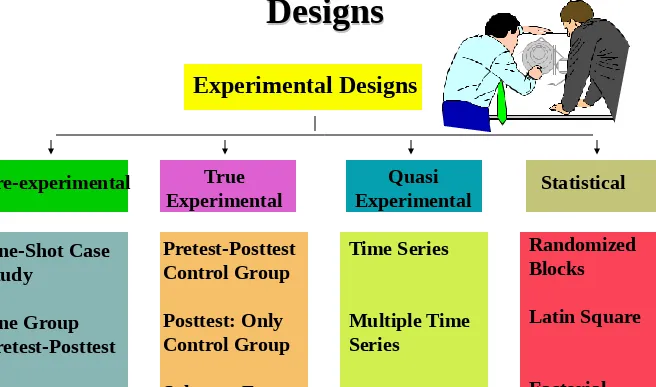
A Classification of Experimental
A Classification of Experimental
Designs
Designs
Experimental Designs
Pre-experimental True Experimental
Quasi
Experimental Statistical One-Shot Case
Study
One Group Pretest-Posttest Static Group
Pretest-Posttest Control Group Posttest: Only Control Group Solomon Four-Group
Time Series
Multiple Time Series
Randomized Blocks
Latin Square
[image:5.720.39.695.69.456.2]Factorial Design Figure 7.1
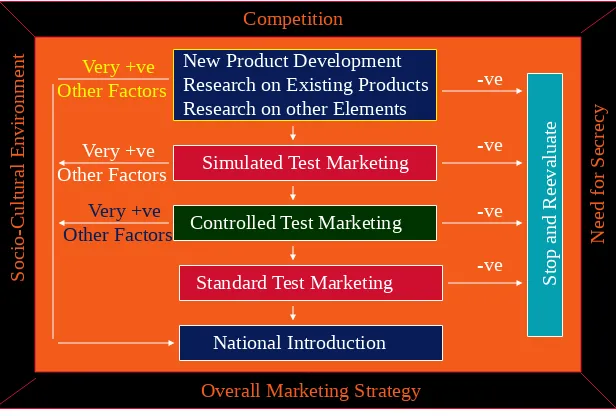
Selecting a Test-Marketing Strategy
Selecting a Test-Marketing Strategy
Competition
Overall Marketing Strategy
S oc io -C ul tu ra l E nv ir on m en t N ee d fo r S ec re cy
New Product Development Research on Existing Products Research on other Elements
Simulated Test Marketing
Controlled Test Marketing
Standard Test Marketing
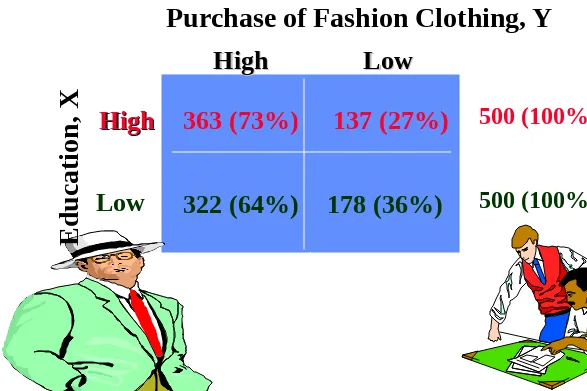
[image:6.720.61.677.77.493.2]Evidence of Concomitant Variation between
Evidence of Concomitant Variation between
Purchase of Fashion Clothing and Education
Purchase of Fashion Clothing and Education
High
High
High
High
Low
Low
363 (73%)
137 (27%)
322 (64%)
178 (36%)
[image:7.720.55.642.130.521.2]Purchase of Fashion Clothing, Y
Table 7.1 Table 7.1
500 (100%)
500 (100%)
Low
E
d
u
ca
ti
on
, X
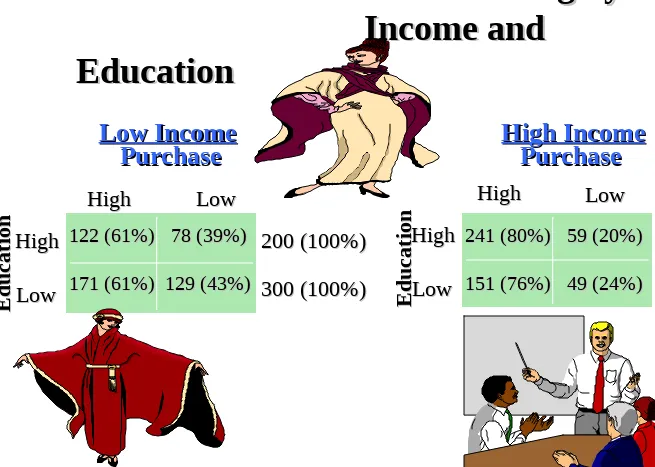
Purchase of Fashion Clothing by
Purchase of Fashion Clothing by
Income and
Income and
Education
Education
Low Income
Low Income
Purchase
Purchase
HighHigh LowLow
High High Low Low E d u ca ti on E d u ca ti
on 200 (100%)200 (100%)
[image:8.720.19.674.46.513.2]
Treatment Groups
Block Store Commercial
Commercial Commercial
Number Patronage A B C
1 Heavy
2 Medium
3 Low
4 None
[image:9.720.11.700.97.511.2]An Example of a Randomized
Block Design
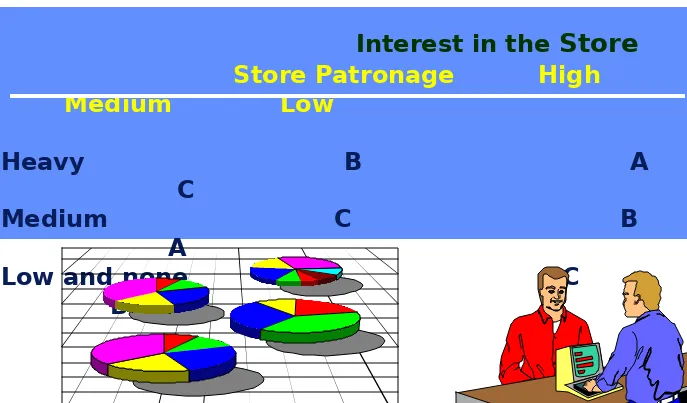
Interest in the
Store
Store Patronage High
Medium Low
Heavy B A C
Medium C B A
Low and none A C B
[image:10.720.13.700.108.511.2]An Example of Latin Square Design
An Example of Latin Square Design
Table 7.5
Amount of Humor
Amount of Store No Medium
High
Information Humor Humor
Humor
Low Medium
High
An Example of a Factorial Design
An Example of a Factorial Design
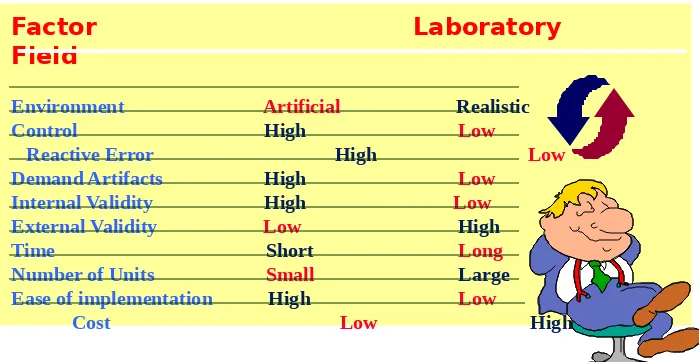
Table 7.6Factor Laboratory Field
Environment Artificial Realistic
Control High Low Reactive Error High Low
Demand Artifacts High Low
Internal Validity High Low
External Validity Low High Time Short Long
Number of Units Small Large
Ease of implementation High Low Cost Low High
[image:12.720.9.708.111.473.2]Laboratory versus Field Experiments
Laboratory versus Field Experiments
Table 7.7Criteria for the Selection of
Criteria for the Selection of
Test Markets
Test Markets
RIP 7.1RIP 7.1
Test Markets should have the following qualities:
1) Be large enough to produce meaningful projections. They should contain at least 2% of the potential actual
population. 2) Be representative demographically. 3) Be representative with respect to product
consumption behavior. 4) Be representative with respect to media usage. 5) Be representative with respect to competition. 6) Be relatively isolated in terms of media and physical distribution. 7) Have normal
historical development in the product class 8) Have
Dancer Fitzgerald’s Sample List of
Dancer Fitzgerald’s Sample List of
Recommended Test Markets
Recommended Test Markets
RIP 7.2
RIP 7.2
Albany-Schenectady-Troy, N Knoxville, TN
Boise, ID Lexington, KY
Buffalo, NY Little Rock, AR
Cedar Rapids-Waterloo, IA Louisville, KY
Charlotte, NC Minneapolis, MN
Cincinnati, Oh Nashville, TN
Cleveland, OH Oklahoma City, OK
Colorado Springs-Pueblo, CO Omaha, NE
Columbus, OH Orlando-Daytona Beach, FL
Des Moines, IA Phoenix, AZ
Dancer Fitzgerald’s Sample List of
Dancer Fitzgerald’s Sample List of
Recommended Test Markets
Recommended Test Markets
RIP 7.2
RIP 7.2
Evansville, IN Portland, OR
Fargo, ND Roanoke-Lynchburg, VA
Fort Wayne, IN Rochester, NY
Green Bay, WI Sacramento-Stockton, CA
Greensboro-High Point, NC St. Louis, MO
Greenville-Spartanburg, SC Salt Lake City, UT
Grand Rapids-Battle Creek, MI Seattle-Tacoma, WA