Proceeding of International Conference On Research, Implementation And Education Of Mathematics And Sciences 2015, Yogyakarta State University, 17-19 May 2015
M-97
M – 13
ASYMMETRIES MODEL OF VOLATILITY RETURN INDONESIAN SHARIA
STOCK INDEX WITH EXPONENTIAL GENERALIZED AUTOREGRESSIVE
CONDITIONAL HETEROSCEDASTICITY
Retno Tri Vulandari*, Endah Rokhmati
Sepuluh Nopember Institute of Technology, Indonesia
Abstract
Stocks are securities which a sign of ownership a person or entity to an enterprise. Since the establishment of IDX in 1977, stock traded based conventional, but in 2000 a new index based on sharia, Jakarta Islamic Index (JII) consists of 30 issuers listed on IDX. In 2011 launched another sharia index, namely the Indonesian Sharia Stock Index (ISSI), which consists of 322 of the 501 issuers listed on IDX. ISSI is a row of random variables in the form of time series data. Financial data such as ISSI have two important properties of time series data, namely heteroscedasticity and volatility. Heteroscedasticity is the error variance changes happen all the time. Volatility is a measure for variation of stock price over time. A good model for data with heteroscedasticity and volatility is GARCH (Bollerslev,1986). Volatility is influenced by many things, therefore stock is often called investment with leverage effect. This is the model that cause the stock price is not symmetrical. According to Chen (2005) and Berument (2001), a good model for the leverage effect is EGARCH model. In this study, the data will be used Indonesia Sharia Stock Index which have the nature of heteroscedasticity and asymmetric. Then the data model with asymmetric EGARCH models. Then predict the stock price in the next period. Furthermore perform simulations based on eviews and EGARCH function matlab toolbox.
Key words: EGARCH, Indonesian Sharia Stock Index
INTRODUCTION
Current economic conditions decline so that the community is expected to choose the investments that provide benefits and low risk. One way of investing is trading stocks. Stock return is the ratio that describes the stock price or a group of stocks relative to its price. Stock returns can be used to measure the performance of a company, Balvers (1990). Indicator of stock price movement seen through the entire stock indices. Besides as an indicator of stock price movements, stock index also gives an overview of the direction of the stock market. If the stock index moves up the majority of the shares in the index moves up too, or vice versa. While the return of stock index also reflects the average return obtained when investing in the stock market, Ismoyo (2011).
Retno Tri Vulandari*, Endah Rokhmati/ Asymmetries Model Of... ISBN. 978-979-96880-8-8
M-98
asymmetric volatility clustering. In Berument study (2001) on inflation in Turkey, introduced EGARCH.
ISSI is an indicator that describes the condition of the Islamic stock market in Indonesia, which consists of 322 stocks listed on the Stock Exchange of sharia. In this study, investigated whether ISSI has the asymmetrical nature of the returnnya. Asymmetric is a state where the bad condition and good condition has a different effect. Then the data model with asymmetric EGARCH models
RESEARCH METHOD
In this study, the method used is the study of literature that is applied to the data obtained from www.duniainvestasi.com Iyang in the period June 22, 2011 until August 15, 2014. Here are the operational measures to achieve the research objectives.
1. Create a data plot to determine the distribution pattern of the data and to test the stationarity using unit root test.
2. Transforming if the data is not stationary.
3. To identify stationary model using the ACF and PACF plots. 4. Make stationary models and diagnostic tests for both the data. 5. Test the asymmetric look and leverage cross correlogram plot. 6. EGARCH models.
7. The simulation stages by using e-views and matlab toolbox
RESULT AND DISCUSSION Plot Data and Testing Stationarity
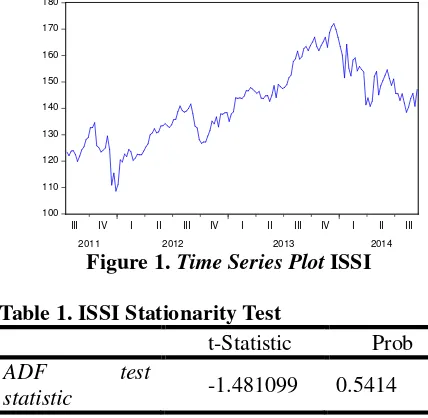
[image:2.595.192.406.433.642.2]Based on research methods that have been designed, then the first step is the description of the data. Figure 1 shows the data ISSI fluctuate from time to time, which indicates the data are not stationary either the average or variance. Indication that the data is not stationary can be amplified using a stationary unit root test. Value Augmented Dickey-Fuller probability (ADF) for the data ISSI is 0.5414. This value is greater than the significance level α = 0.05, indicating the data has a unit root, which means data is not stationary. These results can be seen in Table 1.
Figure 1. Time Series Plot ISSI
Table 1. ISSI Stationarity Test
t-Statistic Prob
ADF test
statistic -1.481099 0.5414
ISSI is not stationary but to return ISSI has been stationary as seen in Table 2 ADF probability value is zero
Table 2. Stationarity Test Return ISSI
t-Statistic Pro b ADF test statistic -16.65808 0.0000
100 110 120 130 140 150 160 170 180
III IV I II III IV I II III IV I II III
Proceeding of International Conference On Research, Implementation And Education Of Mathematics And Sciences 2015, Yogyakarta State University, 17-19 May 2015
[image:3.595.196.518.75.222.2]M-99
Figure 2. Time Series Plot Return ISSI
ISSI return results can be seen in Figure 2, the data is stationary in the mean but the variance is not constant. Therefore, before the model variance, is necessary to find the average conditional models first.
Stationary models
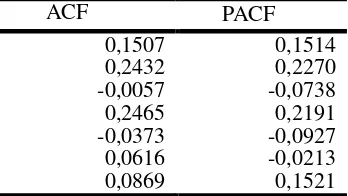
[image:3.595.234.389.306.421.2]Average model conditional on the data can be used stationary ARMA. To identify, ARMA model used ACF and PACF as shown in Figure 3
Figure 3. ACF and PACF ISSI
From Figure 3, ACF down exponentially and PACF interrupted after the first lag, then the average conditional models used are AR (1). Next we will estimate the parameters for the model AR (1) on both the data.
Tabel 3. Model AR ISSI
Variable Coefficient C
AR(1)
4.70088 0.96759
According to Table 3 for ISSI acquired AR model (1) the following = 0,96759 + 4,70088 +
Asymmetric test
Volatility can be defined as varsiansi of the data with respect to time. The error condition is smaller than zero which is often referred to as a bad condition and the condition of error greater than zero is called good condition. If the condition is bad and good condition is not the same effect on volatility, this state is known as the leverage effect (Chen, 2005).
Based on Figure 4, the plot looks different, which means poor condition and good condition give different effects. This indication can be strengthened by the value of the ACF and PACF of the residuals squared average conditional models. The results can be seen in Table 4.
Table 4. ACF and PACF Residual Square ISSI
ACF PACF
0,1507 0,2432 -0,0057 0,2465 -0,0373 0,0616 0,0869
0,1514 0,2270 -0,0738 0,2191 -0,0927 -0,0213 0,1521 -.12
-.08 -.04 .00 .04 .08 .12
III IV I II III IV I II III IV I II III
[image:3.595.211.385.658.756.2]Retno Tri Vulandari*, Endah Rokhmati/ Asymmetries Model Of... ISBN. 978-979-96880-8-8
M-100 0,0427 0,0804 0,0592 -0,0090
-0,0740 0,0912 0,0469 -0,1329
EGARCH Model
EGARCH models were introduced by Nelson (1991) formulated as follows
ln( ) = + ln( ) + + +
Table 5. Model EGARCH ISSI
Variance Equation Variable Coefficient
a b1
b2
c1
c2
d1
d2
-10 -0,33317 - 0,35445 0,6318 -0,2409 -0,1879
Based on Table 5 obtained parameter estimates
ln = −10−0,2409 + −0,1879 +
+ 0,3544 + 0,6318 −0,33317 ln
CONCLUSION AND SUGGESTION
Based on the results and the previous discussion it can be concluded that the appropriate model to model the return data ISSI especially the period January 2011 to August 2014, the model EGARCH (1,2) model with AR (1) as the average model
REFERENCES
Balvers, R. J. (1990), “Predicting Stock Return in an Efficient Market”, Journal of Finance, Vol.45, hal 1109 – 1128.
Berument,Hakan,K. (2001), Modelling Inflation Uncertainty Using EGARCH: An Application to Turkey. Department of Economic Bilkent University.
Bollerslev, T. (1986), “Generalized Autoregressive Conditional Heteroskedasticity”, Journal of Econometrics, Vol. 31, hal 307 – 327.
Chen, W.Y. (2005), “A Comparison of Forecasting Models for ASEAN Equity Markets”, Sunway Academic Journal, Vol. 2, hal 1 – 12.
Engle, R. F. (1982), “Autoregressive Conditional Heteroscedasticity with Estimates of the Variance of United Kingdom Inflation”, Econometrica, Vol 50, hal 987 – 1006.
Ismoyo, G. (2011), Analisis Pengaruh Rasio Keuangan terhadap Return Indeks Saham LQ 45. Fakultas Ekonomi dan Bisnis. Universitas Diponegoro. Semarang.
Martowardojo, A. (2014), Laporan Pelaksanaan Bank Indonesia Triwulan 2014,Bank Indonesia, Jakarta