Research paper
Pro
fi
le of muscle tissue gene expression speci
fi
c to water buffalo:
Comparison with domestic cattle by genome array
Yingying Zhang
a,1, Hongbao Wang
a,b,1, Linsheng Gui
a, Hongcheng Wang
a, Chugang Mei
a, Yaran Zhang
a,
Huaichao Xu
a, Cunlin Jia
a,b, Linsen Zan
a,b,⁎
aCollege of Animal Science and Technology, Northwest A&F University, Yangling, Shaanxi 712100, PR China bNational Beef Cattle Improvement Center of Northwest A&F University, Yangling, Shaanxi 712100, PR China
a b s t r a c t
a r t i c l e
i n f o
Article history:
Received 22 June 2015
Received in revised form 10 November 2015 Accepted 13 November 2015
Available online 18 November 2015
In contrast with the past, the water buffalo is now not only a draft animal, but also an important food source of milk and meat. It is increasingly apparent that the water buffalo have huge potential for meat production, but its breeding needs to be investigated. Regarding the molecular mechanisms involved in the meat quality differ-ence between the buffalo (Bubalus bulabis) and yellow cattle (Bos taurus), 12 chemical-physical characteristics related to the meat quality oflongissimus thoracismuscles (LTM) have been compared at the age of 36 months. Intramuscular lipid and b* (yellowness) were greater in cattle than the buffalo, whereas a* (redness) was greater in the buffalo. Gene expression profiles were constructed by bovine genome array. A total of 8884 and 10,960 probes were detected in buffalo and cattle, respectively, with 1580 genes being differentially expressed. Over 400 probes were upregulated and nearly 1200 were downregulated in LTM of the buffalo, most being involved in ribosomal RNA (rRNA) processing, cholesterol homeostasis, regulation of transcription, response to hypoxia, and glycolysis. Quantitative real-time PCR was used to validate the microarray data. Enriched GO analyses of highly expressed genes in LTM showed that protein biosynthesis, striated muscle contraction, iron homeostasis, iron transport, glycolysis and glucose metabolism were similar between the buffalo and cattle. High protein con-tent, low fat content and deep meat color of buffalo LTM may be closely associated with the increased expression of genes involved in cholesterol and iron homeostasis, while also reducing the expression of genes involved in ubiquitin-mediated proteolysis and protein oxidative phosphorylation. These results establish the groundwork for further studies on buffalo meat quality and will be beneficial in improving water buffalo breeding by molec-ular biotechnology.
© 2015 Elsevier B.V. All rights reserved.
Keywords:
Buffalo Cattle
Skeletal muscle tissues Gene expression profile
1. Introduction
Genomic analysis of the water buffalo has advanced significantly in recent years. The draft assembly of the buffalo genome sequence was completed in 2013. In 2014 the genome sequence was annotated by United State National Center of Biotechnology Information (NCBI), which identified 21,711 coding genes compared with 23,103 in the cat-tle genome (Williams, 2015). Because both water buffalo and domestic cattle belong to the Bovidae family and therefore are genetically related, cross-species comparative genomics tools, such as microarrays and comparative sequencing, may be help us gain insight into the buffalo
genome and provide technologies that might optimize buffalo meat production (Moaeen-ud-Din, 2014).
Water buffalo meat from old and culled animalsN10 years of age is eaten in developing countries (Neath et al., 2007). Therefore, it had long been considered that buffalo meat is tougher and of lower quality than beef because of the poor sensory properties, e.g. darkness, toughness and odor (Khan and Iqbal, 2009). Buffalo meat is now gaining increasing popularity in the world and is regarded as a good alternative meat source, catering for increasing consumer demand for sustainable, eco-nomically viable, high quality, and healthier meat products (Naveena and Kiran, 2014). Compared with beef, buffalo meat is not inferior in terms of composition (Anjaneyulu et al., 2007), quality, or organoleptic characteristics (Neath et al., 2007; Tateo et al., 2007), and has an advan-tage in being less fat, lower in cholesterol, and less calories, which can confer significant cardiovascular benefits (Naveena and Kiran, 2014).
However, the water buffalo remains an underutilized meat source due to lack of adequately fed and timely bred animals that are properly managed. Although there are many advantages in raising buffalo, more knowledge is needed on their breeding and optimal nutritional
Abbreviations:LTM,longissimus thoracismuscle; rRNA, ribosomal RNA; DEGs, differentially expressed genes; IACUC, Institutional Animal Care and Use Committee; SAM, Significant Analysis of Microarray; GO, Gene Ontology; qRT-PCR, quantitative real-time PCR; GEO, Gene Expression Omnibus; FDR, false discovery rate.
⁎ Corresponding author at: College of Animal Science and Technology, Northwest A&F University, Yangling, Shaanxi 712100, PR China.
E-mail address:[email protected](L. Zan).
1 These authors contributed equally to this study.
http://dx.doi.org/10.1016/j.gene.2015.11.015
0378-1119/© 2015 Elsevier B.V. All rights reserved.
Contents lists available atScienceDirect
Gene
requirement (Khan and Iqbal, 2009). To achieve better insight into mo-lecular breeding needed to optimize production potential and meat quality, we have investigated the regulation of gene expression of the skeletal muscle in water buffalo, which has seldom been investigated. TheFuzhongwater buffalos, mainly found in Fuzhong county of Guangxi province China, are superior draft animals that have good potential for meat production. To compare meat quality traits, the Chinese domestic yellow breedQinchuancattle was used; these are ranked as one of the best livestock breeds in the country with a good reputation for their ca-pacity for drafting, along with better growth and productivity. Progress in breeding and improving meat traits has been accelerated towards producing beef rather than the animals being used for laboring. Meat performances and quality ofQinchuan cattlehave greatly improved after 60 years of selective breeding, with ~4 million heads of cattle in China (Zhang et al., 2011).
We have compared 12 chemical-physical characteristics of the meat quality in the LTM of 36-month-old buffalos with cattle in regard to their gene expression profiles. Differentially expressed genes (DEGs), functional categories and pathways were also explored. We hypothe-sized that understanding the molecular mechanisms of meat produc-tion and quality traits in the water buffalo should provide a theoretical basis for improving the production of water buffalo meat.
2. Materials and methods
2.1. Animal sampling
Six female Fuzhong buffalo from Nanning city, Guangxi province, and 6 femaleQinchuancattle from Baoji city, Shaan'xi province, born within a 30 day period were used. Animals within each group had sim-ilar genetic backgrounds. To reduce the influence of environment and nutrition on meat quality, the animals were raised under the same ex-perimental conditions (Qinbao Animal Husbandry Co., Ltd., Baoji city, Shaan'xi province) and fed the same diets about optimum for both spe-cies, a concentrate given at 4–5 kg/day comprising 48.8% corn, 20.4% bran, 26.0% corn grit, 2.0% cotton cake, 2.3% vitamin and mineral supple-ment and 0.5% salt) for 6 months, from when they were about 30 month old and weighed 311 ± 6 kg (buffalo) and 415 ± 8 kg (cattle). The mean daily gains were 0.22 ± 0.03 kg and 0.30 ± 0.04 kg respectively. The an-imals were stunned with a captive bolt and slaughtered according to commercial standard procedures at 36 months. We used only 6 animals per group for meat quality evaluation and 3 animals per group for mi-croarray hybridization because of significant protein, ether extract and meat color differences between buffalo and cattle, which provided suf-ficient discrimination in breed differences. The selection of animals used in chip hybridization was based on detection values of protein, ether extract and meat color that were very close in average phenotypic values for each groups. Approximately 5 g of tissues adjacent to the 12th section of the LTM was removed immediately after slaughter, frozen in liquid nitrogen and stored at−80 °C before RNA preparation. The car-casses were aged at 2 °C for the following 12 days. The animal protocols were approved by the Institutional Animal Care and Use Committee (IACUC) of Northwest A and F University..
2.2. Meat quality evaluation
Two days after slaughter, the pH was measured at the same position in the LTM on the right side using a Thermo Orion pH meter (C310P-43; Orion, Hudson, NH, USA). Twelve days after slaughter, a portion of steak from the LTM between the 8th and 12th ribs was taken from the right side of each animal. After aging, the samples were kept at 2 °C through-out the following analyses, which were performed in triplicate. Water content was measured by weight loss after drying at 100 °C for 24 h (Association of Official Analytical Chemist, 1984). Ether extractable lipid was evaluated by extracting with petroleum ether for 8 h, and the ash content was assessed by ashing at 600 °C for 8 h (Association
of Official Analytical Chemist, 1984). Lightness, chroma and hue were determined using a WSC-S colorimeter (Shanghai Precision and Scien-tific Instrument Co., Ltd., Shanghai, China). Drip loss was calculated on a 1.5-cm-thick steak weighing approximately 80 g and kept for 48 h in a plastic container with a double bottom (Lundström and Malmfors, 1985). Cooking loss was measured on a 4-cm-thick steak, sealed in a polyethylene bag and heated in a water bath to an internal temperature of 70 °C (Destefanis et al., 2003). Shear values were determined on cy-lindrical cores of 2.54 cm in diameter, taken parallel to the musclefibers and obtained from the steaks used to determine cooking losses; the shear force was measured using a C-LM3 digital display tenderness in-strument equipped with a shearing device (XIELI Sci. Co., Ltd., Harbin, China) and calibrated at 100 mm/min. The hydroxyproline content was determined according to the International Organization for Standardization. The data were analyzed by one-way ANOVA (SPSS 19.0, 2010). Differences between the two groups were compared using a post hoc test.
2.3. Microarray analysis
Six LTM samples, three from buffalo and three from cattle, were col-lected to screen DEGs. The hybridizations were performed of each ani-mal with each one-by“peer”. The total mRNA was isolated from 0.2 g of LTM tissues with TRIzol®(Invitrogen Life Technologies, Carlsbad, CA, USA) according to the manufacturer's instructions using an RNeasy MinElute Cleanup Kit (QIAGEN, Valencia, CA, USA) and quantified by spectrophotometry (ND-1000, NanoDrop Inc.). The purity and yield of RNA were determined by the OD 260/280 ratio and OD 260. The RNA in-tegrity was examined by electrophoresis on a 1.2% formaldehyde dena-turing gel. An aliquot of 1μg of total RNA was used to synthesize double-stranded cDNA prepared by T7 oligo(dT)-primed reverse transcription using a Eukaryotic Poly-A RNA Control kit (Affymetrix, Inc.); biotin-tagged cRNA was produced using the Custom MessageAmp™II-Biotin aRNA Amplification Kit (Ambion, Austin, TX, USA.). The bio-tagged cRNA (15μg) was fragmented to produce strands of 50–200 nt in length using protocols from Affymetrix. The fragmented cRNA was hybridized to an Affymetrix Bovine Genome Array containing 23,000 transcripts. Hybridization was performed at 45 °C for 16 h (Affymetrix®GeneChip Hybridization Oven 640). The GeneChip arrays were washed and stained (streptavidin-phycoerythrin) on an Affymetrix® Fluidics Station 450 (Affymetrix) followed by scanning on an Affymetrix® GeneChip®Scanner 3000.
Hybridization data were analyzed using GeneChip operating soft-ware (Gcos 1.4). The scanned images were assessed visually and then analyzed to generate raw datafiles saved as CELfiles using the default setting of Gcos 1.4. The raw datasets were normalized by invariant set normalization, and the signal values were computed by the model-base expression index using the dChip 2006 software (Li and Wong, 2001). For a comparison analysis, we applied a two class unpaired method in the Significant Analysis of Microarray (SAM) software to identify genes that were significantly differentially expressed between buffalo and cattle. Gene Ontology (GO) and pathway analyses of these DEGs were conducted using a free web-based Molecular Annotation System 2.0, (MAS 2.0,www.capitalbio.com), which integrates three dif-ferent open source pathway resources—KEGG, BioCarta and GenMAPP. All of the analyses were based on the annotation information from cattle databases.
3. Quantitative real–time PCR confirmation
using GAPDH were performed to normalize the amount of template cDNA. The protocol for Quantitative real-time PCR (qRT-PCR) was as fol-lows: using the ABI PRISM 7500 qRT PCR System (Applied Biosystems), initiation with 30 s of denaturation at 95 °C, followed by 40 cycles of am-plification with 5 s denaturation at 95 °C and 34 s of annealing at 60 °C. A melting curve was produced from 60 to 95 °C to check the specificity of the amplified product. Each of the amplifications was duplicated, and the mean value was calculated using theΔΔCtmethod. The results (fold changes) were expressed as 2ΔΔCt:
ΔΔCt= (Ctij−CtGAPDHj)− (Cti1−CtGAPDH1). whereCtijandCtGAPDHjare the Ct values for genei
and for GAPDH in a sample (namedj);Cti1andCtGAPDH1are theCtvalues in sample 1, expressed as the standard (Bourneuf et al., 2006). Student's t-test of independent data was used to assess the statistical significance of differential expression levels of each gene or transcript within the six samples (three cattle and three buffalo).
4. Results
4.1. Meat quality comparison
The composition of the buffalo meat compared with the cattle is shown inTable 1. The buffalo meat had deeper color than the cattle (Pb0.05), whereas the cattle had lower protein and higher ether ex-tractable contents than the buffalo (Pb0.05). But beyond that, it is to be noted that buffalo meat is almost similar in chemical and physical characteristics to cattle meat.
4.2. Analysis of consistency within buffalo and cattle
To evaluate the biological repeat variation, cluster analysis was con-ducted by comparing the commonality within each group. The buffalo had approximately 96% and the cattle group approximately 98% com-monality (Fig. 1).
4.3. The LTM gene expression profiles of buffalo and cattle
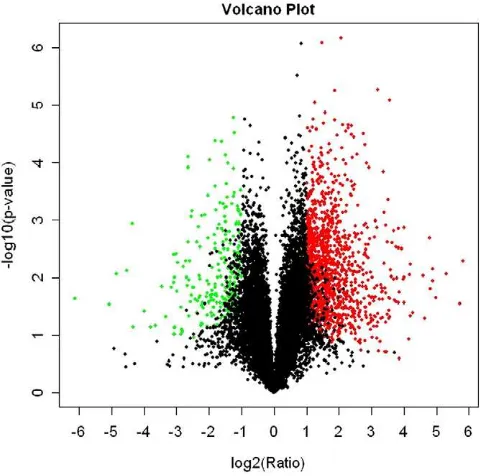
The pattern of gene expression in the LTM from buffalo and cattle by a GeneChip® Bovine genome array containing 24,027 probe sets representing over 23,000 transcripts. All data were deposited in the NCBI Gene Expression Omnibus (GEO,http://www.ncbi.nlm.nih.gov/ geo/info/linking. html) and are accessible through the following GEO Series accession numbers: GSE488102, GSE488103, GSE488104, GSE488108, GSE488109, and GSE488110. The normalized data were used to analyze the total expressed genes. Approximately 11,000 probe sets were detected in the LTM of the buffalo and cattle. The volca-no plot of each probe is shown inFig. 2, and the relationship between the two species can be compared readily.
4.4. Highly expressed gene analysis
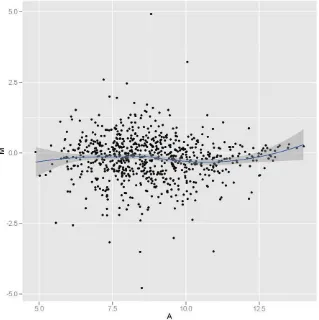
Highly expressed genes play important roles in the development and differentiation of tissues. The top 1% of genes were considered as highly expressed genes in LTM. The enriched GO analyses of the highly expressed genes in two groups were also investigated. The top 10 signif-icantly enriched GO terms such as protein biosynthesis, iron ion homeo-stasis, iron ion transport, striated muscle contraction, glycolysis are shared between buffalo and cattle (P b0.01;Fig. 3, Table 2s, and Table 3s). To contrast the muscle transcriptomes between the two spe-cies, we performed a gene enrichment analysis using the Gene Trail. Genes expressed in LTM of three animals from both breeds were used for the analysis. From the analysis, 766 total genes are involved in skel-etal muscle contraction, energy metabolism, lipid metabolism, and iron ion metabolism, and they are included in the MA plot (Fig. 4).
4.5. identification of DEGs between buffalo and cattle
SAM data from the three buffalo and three cattle indicated that a total of 1580 genes were significantly differentially expressed. There
Table 1
Comparison of the chemical and physical characteristics between buffalo and cattle
longissimus thoracismuscle. Chemical-physical characteristics
Means ± s.e.(n = 6) Student t-test (P-value) Water buffalo Cattle
Water (g/100 g) 72.04 ± 0.37 71.30 ± 0.18 0.051 Protein (g/100 g) 22.39 ± 0.26 21.10 ± 0.44 0.033* Ether extract (g/100 g) 2.72 ± 0.33 4.00 ± 0.48 0.042* Ash content (g/100 g) 0.91 ± 0.02 1.18 ± 0.18 0.183 Hydroxyproline (mg/g) 0.53 ± 0.07 0.57 ± 0.04 0.621 Shear force values (kg) 3.09 ± 0.24 3.73 ± 0.33 0.279 pH 4.71 ± 0.19 4.54 ± 0.15 0.392 Lightness 28.30 ± 0.72 30.98 ± 1.03 0.076 Redness (a*) 23.68 ± 0.49 21.51 ± 0.74 0.041* Yellowness (b*) 14.42 ± 0.28 15.91 ± 0.44 0.037* Drip losses (%) 1.55 ± 0.15 1.87 ± 0.19 0.255 Cooking losses (%) 29.82 ± 0.38 28.64 ± 0.98 0.205 Means with different superscript letters (a, b) within the same rows differ significantly (Pb0.05).
Fig. 1.The hierarchical clustering results of three buffalo and three cattle. (A) Hierarchical clustering results for three buffalo. (B) Hierarchical clustering results for three cattle. The data used for clustering were normalized data that excluded the“not expressed”genes. R represents the coefficient of correlation among individuals. The buffalo shared about 96% consistency, while the cattle shared about 98% consistency. FZ represents the buffalo, and QC represents the cattle.
Fig. 2.Volcano plot used to visually compare the differentially expressed genes between the buffalo group and cattle group. The X-axis represents the log2 ratio of the conversion values of the two groups; the Y-axis represents thePvalue of the negative log10 con-version values calculated by a t-test. The graph for each data point represents gene expres-sion; the red marker and green tag data points correspond to fold changes (onset/control)
≥2 and≤0.5, respectively, andPvalue≤0.05 in gene expression, while the black marker
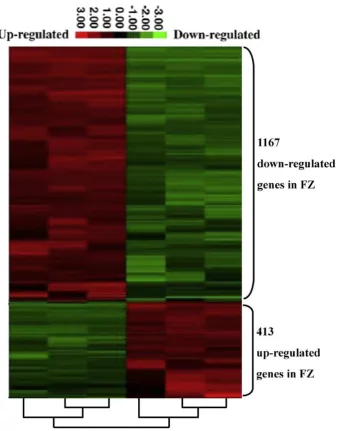
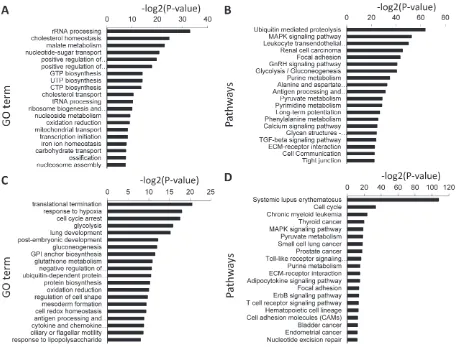
was a selection threshold of false discovery rate, false discovery rate (FDR)b5%, fold change≥2 and sample number≥3 in the SAM output. A total of 413 genes were upregulated and 1167 genes were downregu-lated in the buffalo compared with the cattle (Table 4s). The clustering of DEGs is displayed inFig. 5. A total of 127 significant GO terms (Fig. 6A) and 98 pathways were identified in the downregulated genes (Fig. 6B), and 72 significant GO terms (Fig. 6C) and 56 pathways (Fig. 6D) were found in the upregulated genes (Pb0.01). The enriched GO terms and pathways are listed in Table 5s, Table 6s, Table 7s, and Table 8s. Upregulated genes are predominantly involved in rRNA
processing, cholesterol homeostasis, malate metabolism, nucleotide-sugar transport, regulation of transcription and other functions. In con-trast, the downregulated genes were mainly related to selenium metab-olism, translational termination, positive regulation of actinfilament polymerization, negative regulation of T cell differentiation, response to hypoxia, glycolysis and other functions. Moreover, pathway analysis showed that these DEGs were mainly involved in ubiquitin mediated proteolysis, MAPK signaling pathway, leukocyte transendothelial migra-tion, renal cell carcinoma, systemic lupus erythematosus, glycolysis/ gluconeogenesis, purine metabolism and focal adhesion (Fig. 6B,6D). Fig. 3.Gene Ontology (GO) analysis of the highly expressed genes. (A) Top 10 significant GO terms (biological processes) associated with the highly expressed genes in buffalo LTM. (B) Top 10 significant GO terms associated with the highly expressed genes in cattle LTM. The vertical axis represents the GO category, and the horizontal axis represents the
−log2(P-value) of the significant GO terms. Greater−log2(P-value) scores correlated with increased statistical significance.
Fig. 4.MA plot between the two species highlighting key genes. Genes expressed in all six samples were used for the analysis. From the analysis, a total of 766 genes involved in skeletal muscle contraction, energy metabolism, lipid metabolism and iron ion metabolism were used for making the MA plot. M = log2PMFZ−log2PMQC, A = (log2PMFZ + log2PMQC) / 2,
4.6. validation of gene expression data by quantitative real-time PCR
Quantitative real-time PCR was used to validate ten differentially expressed genes or transcripts (insulin-like growth factor 2, IGF2; solute carrier family 25, member 34, SLC25A34; ankyrin repeat and SOCS box-containing 12, ASB12; solute carrier family 27, member 6, SLC27A6 and thioesterase superfamily member 4,THEM4; mitogen-activated protein kinase 14, MAPK14; shisa homolog 2, SHISA2; calmodulin 1, CA1M1; 1-acylglycerol-3-phosphate O-acyltransferase 5, AGPAT5; complement component 1, s subcomponent, C1S) that were randomly selected to confirm their expression differences (Table 2). The data from quantitative real-time PCR validated the microarray re-sults, and the two different methods were consistent.
5. Discussion
The meat quality evaluation indicated that buffalo LTM was similar in chemical and physical characteristics to LTM of cattle, except for the higher protein content, lower fat content and deeper meat color in the buffalo,findings that are in line with a previous report that buffalo
meat is lean and often indistinguishable from beef (Nanda and Nakao, 2003), although our sample size was smaller. As a meat resource from an original and underutilized species, the darker color of buffalo meat has been explained byDosi et al. (2006), who showed that the main structural and functional properties of buffalo due to darker and greater myoglobin content, along with other factors than its oxidation rate. De-spite being is darker, the lower fat content of buffalo meat is less satisfy-ing because of its level besatisfy-ing closely related to meat quality; the intramuscular fat directly affects the juiciness of beef and indirectly in-fluences its tenderness (Hocquette et al., 2010). The tenderness buffalo LTM was similar to that of cattle, but this is only slightly influenced by fat content. Therefore, the data strongly support the conclusion of Khan and Iqbal (2009)that buffalo meat is of good quality because it is lean and tender. We found the tenderness and hydroxyproline con-tent of buffalo LTM similar to that of cattle. This is in different from thefindings fromNeath et al. (2007)andValin et al. (1984), who found that buffalo meat (Philippine Carabao × Bulgarian Murrah) is more tender than beef (Brahman × Philippine Native), and that it contained significantly less muscle collagen than beef. These differences might be explained by heterogeneities in the animal species, age, feed-ing regimes and carcass treatment.
Buffalo have traditionally been draft animals that live mainly in tropical and subtropical forests, wet grasslands, marshes and swamps. The unique environment and specialization as farm animals have created unique biological and economic characteristics, such as being good beasts of burden that use less digestible feeds and have a high re-sistance to disease. However, buffalo remain underutilized, have poorer
reproductive efficiency with higher infertility, sub-optimal meat pro-duction potential, and lower rates of calf survival. Further research is re-quired to characterize buffalo meat and alter the common perception that it is of poorer quality than beef. Improvements in buffalo breeding and improvement are necessary for optimizing production potential and meat quality. This can be facilitated by an in-depth understanding of the genetic mechanisms regulating of buffalo muscle energy metabolism.
GO analysis of buffalo LTM and the associated highly expressed genes indicate that genes involved in protein biosynthesis, striated mus-cle contraction, iron homeostasis and transport, glycolysis and glucose metabolism were important. Importantly, GO analysis indicates that the highly expressed genes in buffalo LTM (Fig. 3A) are also found in LTM of cattle (Fig. 3B) (Pb0.01; Table 2s and 3s). This indicates that the metabolism of protein, iron, glucose and muscle contraction is very important for maintaining muscle structure and function. The reg-ulation of ribosome biogenesis in response to environmental conditions is associated with cell growth. In altered cell states, ribosomal biogene-sis depends on coordinated expression of the ribosomal protein genes that constitute a gene regulatory network (Li et al., 2005). Irrespective of the cattle species, skeletal muscles are the important sites involved in glucose metabolism and the protein accumulation. These physiologi-cal characteristics are closely related to the high levels of genes expressed in the cattle muscle tissues relating to ribosomal protein, glu-cose metabolism and muscle contraction. Iron is of major importance in red blood cells, with a high cell count being vital for carrying oxygen throughout the body to replenish muscles and organs. Thus, cattle Fig. 6.Gene Ontology (GO) and pathway analysis of differentially expressed genes (DEGs). (A) Top 20 significant GO terms (biological processes) associated with the identified downreg-ulated DEGs in buffalo LTM than cattle. (B) Top 20 significant pathways associated with the downregulated DEGs in buffalo LTM than cattle. (C) Top 20 significant GO terms (biological processes) associated with the identified upregulated DEGs in buffalo LTM than cattle. (D) Top 20 significant pathways associated with the upregulated DEGs in buffalo LTM than cattle. The vertical axis represents the GO category (A, C) or the pathways category (B, D), and the horizontal axis represents the−log2(P-value) of the significant GO terms(A, C) or the signif-icant pathways(B, D). Greater−log2(P-value) scores correlated with increased statistical significance.
Table 2
Comparison of microarray and quantitative real–time PCR (qRT PCR) analyses. Gene Microarray qRT PCR
Fold change (buffalo/cattle)
Fold change (buffalo/cattle)
Student t-test (P-value) IGF2 −5.36 −17.31 0** THEM4 0.06 32.32 0.002** SLC25A34 −8.09 −5.73 0.040*
ASB12 −6.87 −13.78 0.001**
SLC27A6 −17.63 −516.40 0.010*
MAPK14 −13.57 −10.62 0.022** SHISA2 −18.54 −17.28 0** CALM1 −18.10 −18.12 0.004** AGPAT5 −7.94 −8.15 0.010** C1S −7.25 −6.55 0.020**
must take up and store large amounts of iron in their muscle tissues, which increases the body's oxygen-carrying capacity and provides power sources for maintaining muscle function.
The higher mRNA expression of genes involved in iron ion homeo-stasis was found in buffalo muscle than cattle such as TF (transferring), and FTL (ferritin, light polypeptide) which is noteworthy. Ferritin is pri-marily taken as a serum index of overall iron storage by the body. TF is used to transfer iron to hemoglobin in blood and myoglobin in the mus-cles, and they use iron to supply oxygen and energy for everyday func-tioning. Adapting to heavy endurance training often results in a greater iron consumption. Considering buffalo as draft animals, they probably store more iron to ensure that they have sufficient myoglobin in muscle tissue for their heavier workloads, since it is needed for providing oxy-gen to the working muscles and its storage (Mancini and Hunt, 2005). However, the darker color of the buffalo meat is usually attributed to a higher myoglobin content, which leads to muscle proteins having a red-brown color (Tateo et al., 2007). Our data show that the character-istics of darker meat color to be closely associated with the high levels of iron (Fe ++) homeostasis genes expressed in buffalo muscle tissues. However, dark meat is undesirable because it is esthetically less pleas-ing to the consumer and is more susceptible to microbial growth. This means that it is easy to regard meat quality for water buffalo to be infe-rior compared to beef from domestic cattle. Therefore, an important di-rection for water buffalo breeding is to improve the perception of its apparent quality.
We have screened 1580 DEGs in comparing buffalo and cattle LTM gene expression profiles. Genes implicated in ubiquitin-mediated pro-teolysis are differentially in buffalo and cattle. Skeletal muscle proteins are continually being synthesized and degraded, synchronized to main-tain the stability of muscle mass. The extent of muscle protein degrada-tion by this mechanism is influenced by the endocrine system, enzyme activity and a range of catabolic conditions that include starvation, weightlessness and disease (Wing and Goldberg, 1993; Biolo et al., 2000). Therefore, the harsh environmental factors in which buffalos de-velop–less digestible feeds, heavier work-loads, and providing farm power in waterlogged conditions–may have induced unique gene reg-ulation and expression with respect to muscle protein turnover.
The expression of genes involved in protein oxidative phosphoryla-tion also differs in buffalo and cattle. Phosphorylaphosphoryla-tion is an important post-translational modification of proteins than can regulate cell signal transduction, growth and differentiation. Protein phosphorylation is in-fluenced by the environment, resulting in changes in intracellular pro-tein composition and quantity that eventually leads to changes in physiological status (Kaufmann et al., 1999). Buffalo and cattle have de-veloped in different geographical locations and the DEGs between the species could reflect differences in long-term adaption and evolution under very different environments.
Expression of genes implicated in cholesterol homeostasis are up-regulated in water buffalo LTM, including LCAT (lecithin–cholesterol acyltransferase), APOAI (apolipoprotein A-I), PPARα (peroxisome proliferator-activated receptor alpha), and LPL (lipoprotein lipase). These are associated with cholesterol and lipid homeostasis through reverse cholesterol transport (RCT) and fatty acidβ-oxidation. Apolipo-protein A-I attenuates atherosclerosis via RCT, which allows cholesterol to be transported from vessel walls to the liver for excretion (Wang et al., 2007). LCAT is also activated APOAI on HDL. PPARs are closely as-sociated with fatty acid-binding proteins (FABP) and affect transcription of target genes that are important in the regulation of the RCT pathway and fatty acidβ-oxidation (Huss and Kelly, 2004). LPL is a major enzyme responsible for the hydrolysis of triglycerides in chylomicrons and very low-density lipoproteins (VLDL). Mutations of its gene are associated with a risk for coronary heart disease. The low fat content of water buf-falo LTM may be related to the upregulation of genes involved in choles-terol homeostasis, which may lower saturated fat, cholescholes-terol and calories, supporting the viewpoint that water buffalo meat is one of the healthiest for human consumption (Anjaneyulu et al., 2007).
Present personal health concerns have arisen about the fat content in beef and the possible negative effect on consumer cholesterol levels (Van Wezemael et al., 2014). As nutrition and health considerations af-fect in food choices (da Fonseca and Salay, 2008), there are many rea-sons to believe that the market potential for buffalo meat is promising.
6. Conclusion
We have compared the chemical and physical characteristics of meat from buffalo and cattle, the skeletal muscle gene expression pro-files of the two cattle species were constructed, and 1580 DEGs have been screened. The genes involved in protein biosynthesis, striated muscle contraction, iron homeostasis, iron transport, glycolysis and glu-cose metabolism were highly expressed in LTM from both species. We observed high protein content, low fat content and deep meat color and found the expression of cholesterol homeostasis and iron ion homeostasis-related genes was increased markedly, meanwhile the ex-pression of ubiquitin mediated proteolysis and protein oxidative phosphorylation-related genes was significantly reduced in the LTM of buffalo. Thus we have gained a preliminary understanding of the ex-pression profile characteristics of buffalo muscle compared with cattle. The data are a solid basis for future research on buffalo meat quality, which should also be helpful in elucidating the molecular mechanisms underlying buffalo meat traits.
Acknowledgments
The authors thank all of the investigators, research assistants and laboratory technicians who have contributed to this study. This work was supported by the National Natural Science Foundation of China (No. 31272411), the National “863” Program of China (No. 2011AA100307-02; No. 2013AA102505), the construct special funds of the Modern Agricultural Industry Technology System (CARS-38) and the China Postdoctoral Science Foundation Funded Project (No. k308021412).
Appendix A. Supplementary data
Supplementary data to this article can be found online athttp://dx. doi.org/10.1016/j.gene.2015.11.015.
References
Anjaneyulu, A.S.R., Thomas, R., Kondaiah, N., 2007.Technologies for value added buffalo meat products—a review. Am. J. Food Technol. 2, 104–114.
AOAC, 1984.Official Methods of Analysis. 14th ed. Association of Official Analytical Chem-ist, Arlington, VA, Washington, DC.
Biolo, G., Bosutti, A., Iscara, F., Toigo, G., Gallo, A., Guarnieri, G., 2000.Contribution of the ubiquitin–proteasome pathway to overall muscle proteolysis in hypercatabolic pa-tients. Metabolism 49, 689–691.
Bourneuf, E., Hérault, F., Chicault, C., Carré, W., Assaf, S., Monnier, A., Mottier, S., Lagarrigue, S., Douaire, M., Mosser, J., Diot, C., 2006.Microarray analysis of differential gene expression in the liver of lean and fat chickens. Gene 372, 162–170.
da Fonseca, M.D.C.P., Salay, E., 2008.Beef, chicken and pork consumption and consumer safety and nutritional concerns in the City of Campinas. Brazil. Food. Control. 19, 1051–1058.
Destefanis, G., Brugiapaglia, A., Barge, M.T., Lazzaroni, C., 2003.Effect of castration on meat quality in Piemontese cattle. Meat Sci. 64, 215–218.
Dosi, R., Di Maro, A., Chambery, A., Colonna, G., Costantini, S., Geraci, G., Parente, A., 2006.
Characterization and kinetics studies of water buffalo (Bubalus bubalis) myoglobin. Comp. Biochem. Physiol. B 145, 230–238.
Hocquette, J.F., Gondret, F., Baéza, E., Médale, F., Jurie, C., Pethick, D.W., 2010. Intramuscu-lar fat content in meat-producing animals: development, genetic and nutritional con-trol, and identification of putative markers. Animal 4, 303–319.
Huss, J.M., Kelly, D.P., 2004.Nuclear receptor signaling and cardiac energetics. Circ. Res. 95, 568–578.
Kaufmann, H., Mazur, X., Fussenegger, M., Bailey, J.E., 1999.Influence of low temperature on productivity, proteome and protein phosphorylation of CHO cells. Biotechnol. Bioeng. 63, 573–582.
Khan, B.B., Iqbal, A., 2009.The water buffalo: an underutilized source of milk and meat: a review. Pak. J. Zool. (Suppl. 9), 517–521.
Li, X., Zhong, S., Wong, W.H., 2005.Reliable prediction of transcription factor binding sites by phylogenetic verification. P. Acad. Sci. USA 102, 16945–16950.
Lundström, K., Malmfors, G., 1985.Variation in light scattering and water-holding capac-ity along the porcine longissimus thoracis muscle. Meat Sci. 15, 203–214.
Mancini, R.A., Hunt, M., 2005.Current research in meat color. Meat Sci. 71, 100–121.
Moaeen-ud-Din, M., 2014.Buffalo and cattle sequence diversity and molecular evolution. 2014 ADSA–ASAS–CSAS Joint Annual Meeting. Kansas (USA), 20–24 July 2014 (Kansas, Missouri, USA).
Nanda, A.S., Nakao, T., 2003.Role of buffalo in the socioeconomic development of rural Asia: current status and future prospectus. Anim. Sci. J. 74, 443–455.
Naveena, B.M., Kiran, M., 2014.Buffalo meat quality, composition, and processing charac-teristics: contribution to the global economy and nutritional security. Anim. Front. 4, 18–24.
Neath, K.E., Del Barrio, A.N., Lapitan, R.M., Herrera, J.R.V., Cruz, L.C., Fujihara, T., Muroya, K., Chikuni, M., Hirabayashi, Y., Kanai, Y., 2007.Difference in tenderness and pH decline between water buffalo meat and beef during postmortem aging. Meat Sci. 75, 499–505.
Tateo, A., De Palo, P., Quaglia, N.C., Centoducati, P., 2007.Some qualitative and chromatic aspects of thawed buffalo (Bubalus bubalis) meat. Meat Sci. 76, 352–358.
Valin, C., Pinkas, A., Dragnev, H., Boikovski, S., Polikronov, D., 1984.Comparative study of buffalo meat and beef. Meat Sci. 10, 69–84.
Van Wezemael, L., Caputo, V., Nayga Jr., R.M., Chryssochoidis, G., Verbeke, W., 2014.
European consumer preferences for beef with nutrition and health claims: a multi-country investigation using discrete choice experiments. Food Policy 44, 167–176.
Wang, X., Collins, H.L., Ranalletta, M., Fuki, I.V., Billheimer, J.T., Rothblat, G.H., Tall, A.R., Rader, D.J., 2007.Macrophage ABCA1 and ABCG1, but not SR-BI, promote macro-phage reverse cholesterol transport in vivo. J. Clin. Invest. 117, 2216–2224.
Williams, J., 2015.Status of the Buffalo Genome Project. Plant and Animal Genome XXIII Conference. San Diego (USA), 10–14 January 2015 (San Diego, CA, USA).
Wing, S.S., Goldberg, A.L., 1993.Glucocorticoids activate the ATP-ubiqutin-dependent proteolytic system in skeletal muscle during fasting. Am. J. Physiol. 264, E668-E668.