OECD Economic Surveys
France
September 2017
OVERVIEW
This Overview is extracted from the 2017 Economic Survey of France. The Survey is published on
the responsibility of the Economic and Development Review Committee (EDRC) of the OECD,
which is charged with the examination of the economic situation of member countries.
This document and any map included herein are without prejudice to the status of or sovereignty
over any territory, to the delimitation of international frontiers and boundaries and to the name
of any territory, city or area
OECD Economic Surveys: France© OECD 2017
Executive summary
● The economy is expanding, but stronger growth would help to maintain the level of social protection
● Too many people are excluded from the labour market
The economy is expanding, but stronger growth would help to maintain the level of social protection
GDP is set to grow by at least 1.6% in 2017-18, supported by private consumption and investment. The labour market is improving, but productivity gains are too low to sustain the current level of social protection, high-quality public services and rising incomes in the long run. Recent reforms have strengthened competition in some services sectors, but it remains weak in others. Along with high and complex taxes, this weighs on employment and productivity growth. Too many adults have weak basic skills, and their access to training is hindered by excessive turnover of fixed-term contracts and a complex training system.
Too many people are excluded from the labour market
Poverty is low overall. Yet, many youngsters and low-skilled workers are excluded from the labour market, especially when they live in poor neighbourhoods. These can be difficult to leave, as housing affordability is an issue, at least in big cities. Efforts to increase the number of apprenticeships have not sufficiently benefited secondary school students, who need them most. Shorter court procedures with less uncertain outcomes might entice firms to hire staff on permanent contracts with higher wages and better access to training, fostering a more inclusive labour market. The labour laws need to give businesses and their workers more flexibility to negotiate working conditions and wages, in order to promote employment and productivity. The challenge is to ensure a reasonable balance of power between employers and employees.
A long-term strategy would help to reduce public spending and improve its impact on equity
A long-term strategy is needed to reduce public expenditure without endangering social protection so as to allow lower taxes with sustainable public finances. Such a combination would generate faster growth and lower unemployment. Pension spending remains high, as the retirement age remains low, although it has been gradually raised by recent reforms. Increasing the focus on infrastructure and education spending for the poor would improve equity. Health-care quality is high, but there is room to improve prevention and co-ordination between providers, while the broad coverage of expenditures for most households results in significant use and spending.
Weaker productivity gains have slowed potential growth
Source: OECD Economic Outlook 101 Database.
1 2 http://dx.doi.org/10.1787/888933578465 0.0
2000 2002 2004 2006 2008 2010 2012 2014 2016 2018 Capital per worker Labour input
TFP Potential growth
Likelihood of unemployment by place of residence1
15-29, %
1. After controlling for individual characteristics; see Figure 36 for details.
Source: ONPV (2016), Rapport annuel 2015.
1 2 http://dx.doi.org/10.1787/888933578484 0
Poor neighbourhoods Surrounding urban areas
Public spending is high
Per cent of GDP, 20161
1. Or latest year available.
Source: OECD Economic Outlook 101 Database.
MAIN FINDINGS KEY RECOMMENDATIONS
Developing a long-term strategy to reduce public spending and taxes
A large public sector requires high taxes that weigh on employment and investment.
Meet the ambitious targets to reduce public spending and taxes. Lower social contribution rates and corporate income tax rates, as planned.
The share of the progressive income tax in revenues is low. VAT exemptions and reduced rates are important, and higher green taxes would improve environmental outcomes.
Withdraw reduced rates for VAT, and increase green taxes. Use lower social contributions as an opportunity to give a bigger role to the progressive income tax by lowering the basic allowance. Remove personal tax breaks on capital income, and lower the tax rate. The pension system is fragmented and pension spending elevated. Move towards a single pension system to improve labour mobility
and lower management costs.
Then, gradually increase the minimum retirement age in line with life expectancy.
Health-care quality is high, but there is room to improve prevention and co-ordination between different care providers. This increases spending unnecessarily.
Increase health practitioners’ remuneration for prevention and treating complex chronic diseases, which will help reduce the level of medical intervention, the number of prescriptions and drug sales. Facilitate insurance schemes’ contracting with groups of providers. Expand electronic health records to improve health-care co-ordination.
Fostering an inclusive development of skills and employment
Too many adults have weak basic skills. Their access to training is hampered by the great number of different schemes and the complexity of the personal training account (compte personnel de formation – CPF).
Simplify the CPF, and reduce the number of similar schemes. Improve information about providers by strengthening the quality label system.
Continuously evaluate active labour market policies. Education outcomes are highly dependent on parental background.
Too many youngsters are excluded from the labour market.
Offer attractive salaries and career prospects to excellent teachers in schools with many pupils from disadvantaged backgrounds. Develop apprenticeships in vocational lycées by encouraging businesses to take in young apprentices.
Promote an innovative range of different practices in teacher training in order to meet the different needs of pupils.
The labour law leaves insufficient room for firms and their employees to adjust working conditions to their needs. The government limits that room further by extending sectoral agreements systematically to firms not involved in negotiations. Many sectors are too small for effective negotiations, and firms often lack worker representatives with whom they can negotiate because of the complex governance of representation and discrimination against workers negotiating for colleagues.
Merge inactive sectors and those that lack the critical mass for effective bargaining.
Ensure that the extension procedure for sectoral agreements takes account of their economic and social impacts, and authorise exemptions.
Encourage sectoral agreements that are differentiated by the size or age of the business, for example.
Reduce the number of institutions that represent workers. Ensure better protection for workers that represent colleagues against discrimination, and improve the performance of employment tribunals.
Workers in poor neighbourhoods suffer from insufficient access to jobs and public services. Low flexibility of housing supply and the rigid allocation of social housing hinder access to housing for the poor and greater residential and labour mobility. Workers living in underprivileged areas are discriminated against.
Use urban renewal in poor neighbourhoods as an entry point to offer practical training in firms and basic skills courses.
Better target public spending at transportation, childcare services and face-to-face public services in poor neighbourhoods. Reduce registration fees, and increase taxes on immovable property. Tighten obligations to pay higher rents and encourage occupants whose income rises above the eligibility ceiling to move house. Continue awareness campaigns for recruiters.
Improving productivity growth
Despite some progress, barriers to entry and competition in services remain high.
Obtain an independent assessment of the impact on competition of laws and regulations, and increase dialogue on this subject between the competition authority and the Ministry for the Economy during the decision-making process.
Long labour court procedures with a high rate of appeals limit the use of open-ended contracts.
Introduce professional judges to guide lay assessors.
Science-industry collaboration remains weak, as is the share of competitive project financing of public research.
Increase the share of project funding in the financing of public research institutes and universities.
Assessment and recommendations
● The French economy has many strengths but also faces important challenges
● Making taxes more favourable to employment and productivity while maintaining social protection
● Strengthening productivity growth
● Enhancing employment and access to high-quality jobs
The French economy has many strengths but also faces important challenges
The French economy has high productivity and standards of living, excellent childcare services, adequate fertility, long life expectancy in good health and a good work-life balance for the average person (Figure 1). Extensive social benefits and the minimum wage have kept poverty and inequality relatively low (Figure 2). The economy, although still a bit weaker than the euro-area average, is expanding, and the labour market is gradually recovering.
However, potential growth has declined, mainly due to a weakening of productivity trends, undermining incomes and the government’s capacity to provide social protection and high-quality public services. Elevated public spending, while contributing to low poverty and good health, requires high taxes that limit firms’ ability to invest and create jobs and reduce incentives for people to work. Unemployment is still high, and spells are long, particularly for young people; too many of them are not in employment, education nor training. Educational outcomes that strongly reflect parental socio-economic background put inter-generational social mobility at risk (Figure 3). While poverty is relatively low on average, it is highly concentrated in certain neighbourhoods, where residents are confronted with poor housing and public infrastructure, a difficult school environment, a lack of services and amenities, and discrimination, notably in the labour market. The new government was elected on a platform of structural reforms designed to address these weaknesses (Box 1).
Figure 1. The average person has enviable well-being in France
1. Unweighted average.
Source: OECD Better Life Index, www.betterlifeinitiative.org.
1 2 http://dx.doi.org/10.1787/888933576964 0
1 2 3 4 5 6 7 8 9 10
Income and wealth
Jobs and earnings
Housing
Work and life balance
Health status
Education and skills Social connections
Civic engagement and governance² Environmental quality
Personal security Subjective well-being France
Against this background this Survey has four main messages:
● Too many low-skilled people are excluded from the labour market, and sharp inequalities in educational outcomes hinder social mobility and prevent more inclusive labour market outcomes.
● Residents of poor neighbourhoods suffer from multiple social and economic disadvantages, such as discrimination and a lack of transport services connecting them to jobs.
● Labour law leaves insufficient flexibility to negotiate wages and working conditions, while long court procedures lead to excessive use of very short-term contracts.
● Developing a long-term strategy to reduce public spending in relation to GDP would help to reduce high taxes that hinder economic development and employment growth.
Figure 2. France has many strengths
1. Average number of years that a new-born infant can expect to live in full health by taking into account years lived in less than full health due to disease and/or injury (HALE). The countries are ranked according to women’s life expectancy.
2. Or latest year available.
Source:OECD (2017), Family, Economic Outlook 101 and Income Distribution and Poverty Databases.
1 2 http://dx.doi.org/10.1787/888933576983 50
TUR MEX HUN USA LVA SVK POL CZE EST DNK CHL NZL GBR
OECD
IRL DEU BEL AUS FIN
SWE LUX NLD PRT CAN SVN NOR AUT GRC ISL ITA ISR ESP CHE FRA KOR JPN
Men
Women, additional years
A. Health-adjusted life expectancy¹, 2015 Number of years
NOR DNK SVN FIN CZE BEL SVK AUT LUX SWE NLD DEU FRA CHE POL IRL OECD CAN
ITA JPN NZL AUS PRT
GRC ESP LVA LTU GBR EST ISR USA CHL B. Income inequality, 2014²
Gini coefficient, after taxes and transfers
0
MEX HUN LVA ISL EST POL KOR PRT NZL CZE SVK ISR GRC SVN JPN CAN GBR FIN OECD ESP
ITA AUS
SWE USA AUT DEU DNK FRA NLD CHE BEL IRL NOR LUX C. Hourly labour productivity, 2016²
USD-PPPs
CZE DNK SVK NOR AUT FIN FRA CHE NLD DEU SVN LUX IRL HUN SWE GBR POL BEL
OECD NZL ITA KOR PRT CAN AUS GRC JPN LVA ESP MEX CHL EST USA TUR ISR D. Poverty rate, 2014²
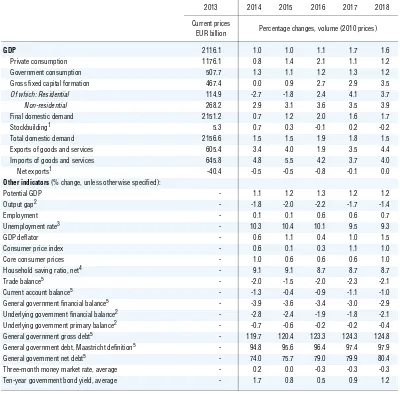
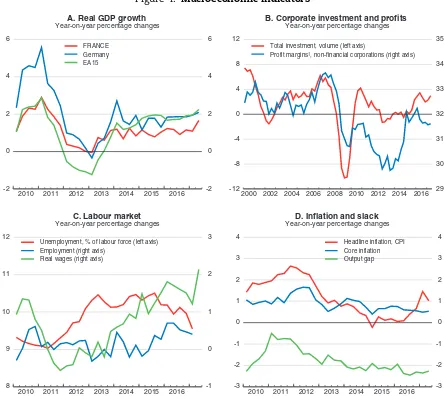
Private consumption and investment are underpinning growth (Table 1). Although real wage gains have been slow, a modest but strengthening labour market recovery is supporting consumption. Cuts in social contributions and business taxes have helped firms restore their profit margins after a protracted decline (Figure 4). Improved internal financing capacity along with still favourable financing conditions is buoying business investment. Overall GDP growth is expected to reach at least 1.6% in 2017-18, the highest level since 2011 but still below the euro-area average.
After increasing strongly in 2015, exports dipped in 2016 due to temporary factors. But France’s competitiveness problems do not seem to have been fully resolved: the hourly cost in particular is higher than the euro area average, despite measures to support cost-competitiveness such as the CICE tax credit for competitiveness and employment. In
Figure 3. The country also faces many challenges
1. Real net household disposable income per capita.
2. Share of adults 16-65 scoring below level 2 in PIAAC’s reading proficiency scale.
3. The data are based solely on Flanders for Belgium and England and Northern Ireland for the United Kingdom.
Source:OECD (2017), Economic Outlook 101 and Education Statistics Databases; OECD (2016), Skills Matter: Further Results from the Survey of Adult Skills, OECD Skills Studies, OECD Publishing, Paris.
1 2 http://dx.doi.org/10.1787/888933577002
1990 1995 2000 2005 2010 2015
-0.5 A. Potential growth has been slowing
Contributions to potential output growth, %
0
NLD CHE LUX DEU SWE NOR JPN AUT DNK AUS CZE EST LVA CAN NZL GBR BEL ISR FIN USA OECD SVN PRT POL HUN IRL FRA SVK KOR CHL MEX ESP GRC ITA TUR C. Many youths are not in employment,
education or training % of the 15-29 population, 2015
0
JPN FIN SVK NLD CZE NZL NOR AUS KOR EST SWE BEL AUT DNK CAN GBR IRL USA DEU POL OECD FRA SVN GRC
ISR ESP ITA TUR CHL D. Many people have low skills²
Per cent, 16-65, 2012-2015³
-6
GRC PRT ITA BEL ESP AUT IRL SVN FIN EA16 NLD FRA JPN GBR NZL AUS CHE SVK
OECD DNK DEU CZE CAN USA POL SWE HUN KOR LVA NOR EST B. Income growth has been weak¹
Box 1. Key features of the programme of the new government and a preliminary assessment
● Labour market reform: The draft decrees reforming the labor market aim at encouraging social dialogue
within firms and defining work relations and the conditions for dismissals. In this respect, the link between sector-level and firm-level agreements will be modified by listing the areas reserved for negotiations at the sectoral level and by leaving more room for taking initiatives at the firm level in other matters. In addition, sector-specific agreements will have to include explicit conditions for micro, small and medium-sized firms. Collective bargaining will be strengthened by allowing companies with fewer than 50 employees to negotiate directly with a staff representative. Companies with fewer than 20 employees who do not have staff representatives will be able to negotiate directly with their employees. One works council, the social and economic council, will be created in all firms with at least 11 employees; and for firms with more than 50 employees, this new council will merge all existing bodies. Moreover, a binding scale including minimum and maximum amounts for the indemnities decided by the labour courts will be put in place. The scope of economic justification for dismissals will now be set at the national level. Finally, statutory severance payments will be increased by 25%.
● Unemployment insurance, vocational training and adult learning reforms: Unemployment benefits are
to be extended to the self-employed and employees who resign (once every five years). In return, job-search controls and sanctions are to be strengthened. Comprehensive vocational training and adult learning reforms are also to be implemented. To make more financing available for the personal training account various competing schemes will be withdrawn. All certified training measures will be available through it. These reforms will be reviewed by parliament in spring 2018. A national vocational training investment plan of 15 billion euros is also scheduled for implementation.
● Pension reform: The government plans to move to a single pension system to improve equity and
transparency and lower costs. Discussions about this reform are projected to start in 2018 culminating in a reform framework at the end of 2018.
● Public spending: The government intends to reduce the weight of current public expenditure by three
points of GDP over the next five years, by keeping it stable in real terms for the first three years. The details will be set out at the end of September in the initial Finance Law for 2018, but the President’s manifesto contained a number of indications, including 25 billion euros corresponding to lower social spending obtained from reduced health and unemployment insurance outlays. A further 10 billion euros would come from expenditure reductions to be negotiated with local governments and 25 billion euros from other government spending cuts, notably by reducing the number of civil servants by 120 000. On the spending side, there will be a new investment plan worth a total of 50 billion euros, i.e. half a percentage point of GDP per year, including the 15 billion euros for training. The planned cuts in public spending could add around 2% to GDP in 20 years (according to Fournier and Johansson, 2016). If the increase in spending planned for investment during the President’s five-year term of office were maintained, this impact could rise by 0.5% to 2% according to the different models used by the OECD (OECD, 2016a).
● Tax reform: The government plans to eliminate the residency tax (taxe d’habitation) for 80% of
Box 1. Key features of the programme of the new government and a preliminary assessment (cont.)
● Education reform: The government intends to halve class size to 12 pupils for grade 1 and grade 2 in poor
neighbourhoods (priority education schools), with implementation starting in the 2017-18 school year. Universities will be granted more autonomy to recruit their professors and define their teaching programmes.
● Health care: Prevention, access to care and efficiency are the pillars of the national health-care strategy.
Vaccines for babies and toddlers should become mandatory in 2018, and the cost of a packet of cigarettes should gradually rise to ten euros. The Minister for Solidarity and Health is also preparing a plan to combat health-care deserts for September 2017 and new incentives for information sharing and co-operation between health-care professionals, and care quality. The government has also pledged to provide full coverage for glasses, dental care and hearing aids.
Table 1. Macroeconomic indicators and projections
2013 2014 2015 2016 2017 2018
Current prices
EUR billion Percentage changes, volume (2010 prices)
GDP 2116.1 1.0 1.0 1.1 1.7 1.6
Private consumption 1176.1 0.8 1.4 2.1 1.1 1.2
Government consumption 507.7 1.3 1.1 1.2 1.3 1.2
Gross fixed capital formation 467.4 0.0 0.9 2.7 2.9 3.5
Of which: Residential 114.9 -2.7 -1.8 2.4 4.1 3.7
Non-residential 268.2 2.9 3.1 3.6 3.5 3.9
Final domestic demand 2151.2 0.7 1.2 2.0 1.6 1.7
Stockbuilding1 5.3 0.7 0.3 -0.1 0.2 -0.2
Total domestic demand 2156.6 1.5 1.5 1.9 1.8 1.5
Exports of goods and services 605.4 3.4 4.0 1.9 3.5 4.4
Imports of goods and services 645.8 4.8 5.5 4.2 3.7 4.0
Net exports1 -40.4 -0.5 -0.5 -0.8 -0.1 0.0
Other indicators (% change, unless otherwise specified):
Potential GDP - 1.1 1.2 1.3 1.2 1.2
Output gap2 - -1.8 -2.0 -2.2 -1.7 -1.4
Employment - 0.1 0.1 0.6 0.6 0.7
Unemployment rate3 - 10.3 10.4 10.1 9.5 9.3
GDP deflator - 0.6 1.1 0.4 1.0 1.5
Consumer price index - 0.6 0.1 0.3 1.1 1.0
Core consumer prices - 1.0 0.6 0.6 0.6 1.0
Household saving ratio, net4 - 9.1 9.1 8.7 8.7 8.7
Trade balance5 - -2.0 -1.5 -2.0 -2.3 -2.1
Current account balance5 - -1.3 -0.4 -0.9 -1.1 -1.0
General government financial balance5 - -3.9 -3.6 -3.4 -3.0 -2.9
Underlying government financial balance2 - -2.8 -2.4 -1.9 -1.8 -2.1
Underlying government primary balance2 - -0.7 -0.6 -0.2 -0.2 -0.4
General government gross debt5 - 119.7 120.4 123.3 124.3 124.8
General government debt, Maastricht definition5 - 94.8 95.6 96.4 97.4 97.9
General government net debt5 - 74.0 75.7 79.0 79.9 80.4
Three-month money market rate, average - 0.2 0.0 -0.3 -0.3 -0.3
Ten-year government bond yield, average - 1.7 0.8 0.5 0.9 1.2
1. Contributions to changes in real GDP, actual amount in the first column. 2. As a percentage of potential GDP.
3. As a percentage of the labour force.
4. As a percentage of household disposable income. 5. As a percentage of GDP.
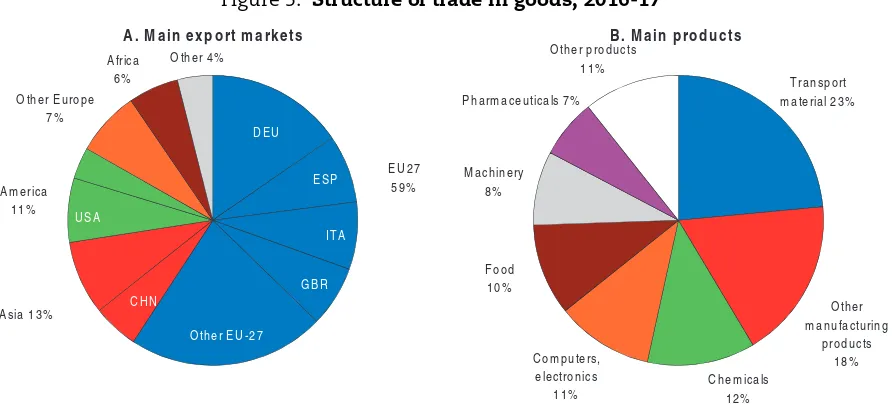
France, non-price competitiveness is hampered by weaker innovation than in the best-performing economies, whereas research spending is mostly directed at industries that are in decline in terms of their share of value added. After the sharp fall observed at the beginning of the 2000s, France’s export performance has been relatively stable since 2010. Exports are expected to rebound thanks to revived world demand, in particular from France’s main European trading partners. The share of services has been growing strongly, reaching close to 30%, second in Europe only to the United Kingdom. While goods exports are fairly well diversified by both type and destination (Figure 5), their growth has depended on only a few sectors (aircraft in particular), indicating vulnerabilities.
A clear downward trend in the unemployment rate set in towards end-2015, thanks to lower social contributions, hiring subsidies and stepped-up training programmes for the unemployed. Surveys point to solid hiring intentions, and the effects of labour tax cuts are expected to strengthen over time, so unemployment should continue its gradual fall.
Figure 4. Macroeconomic indicators
1. As a percentage of gross value added.
Source:OECD (2017), OECD Economic Outlook 101 Database (and updates); INSEE.
1 2 http://dx.doi.org/10.1787/888933577021
2010 2011 2012 2013 2014 2015 2016 -2
A. Real GDP growth Year-on-year percentage changes
2000 2002 2004 2006 2008 2010 2012 2014 2016 -12 Total investment, volume (left axis)
Profit margins¹, non-financial corporations (right axis) B. Corporate investment and profits
Year-on-year percentage changes
2010 2011 2012 2013 2014 2015 2016 8 Unemployment, % of labour force (left axis)
Employment (right axis) Real wages (right axis)
C. Labour market Year-on-year percentage changes
Headline inflation increased at the beginning of 2017 as energy prices rebounded. With persistent ample slack, however, inflationary pressures will remain muted, even as the labour market gradually recovers.
The development of France’s exports depends on demand in trading partners’ economies in a context where the effects of the United Kingdom’s exit from the European Union remain highly uncertain, as does the economic situation in major emerging economies, notably China. The medium-term effects of lower business taxes and social charges on business sentiment could be stronger than expected, leading to more dynamic investment, employment growth and consumption. In addition, a number of possible shocks could alter the economic outlook significantly (Table 2).
Financial-sector vulnerabilities appear contained, and the French banking sector seems to be resilient to adverse economic developments (EBA, 2016). The level of non-performing loans remains low, at 3.9% on average in 2016, compared to 5.7% on average in OECD countries. The ECB’s bank lending survey suggests ongoing accommodative lending conditions. Loan growth to the private sector is accelerating and remains higher than in other major euro-area economies. According to the Banque de France, the debt-to-GDP ratio
Figure 5. Structure of trade in goods, 2016-171
1. 12-month cumulated flows (values) as of June 2017, excluding military equipment. Source:INSEE.
1 2 http://dx.doi.org/10.1787/888933577040
ESP
A. Main export markets B. Main products
Table 2. Events that could lead to major changes in the outlook
Shock Possible impact
Worldwide rise in protectionism. This would have adverse effects on exports and firm entry, harming productivity and potential growth.
Further deterioration of banks’ problems in some European countries, triggering a European banking system crisis.
This could have ripple effects across the EU and beyond, engendering financial market turmoil and higher interest rates.
of non-financial corporations (net of intra-group transactions) has continued to rise to 71.3% in the fourth quarter of 2016, compared to 63.5% on average in the euro area. Also, in the fourth quarter of 2016 household debt had risen to 57.4% of GDP, just under the figure for the euro area as a whole (58.6% of GDP). Beyond knock-on effects related to a further deterioration of the European banking system’s financial health, the key financial-sector risk is the very low interest-rate environment that is harming banks’ profitability and encouraging risk-taking and private-sector borrowing. An abrupt interest rate increase would lead to a major rise in businesses’ debt (Banque de France, 2017). And a steep hike in rates could also lower asset prices, notably commercial property valuations in the office building segment, which has seen strong, steady growth since 2009. The systemic consequences of a sharp fall in commercial property prices, however, seem limited (Haut Conseil de stabilité financière, 2017).
The budget deficit has declined, but there are risks for future public-debt developments. Tax cuts have curbed revenue growth, and there has been additional spending in 2017 on security to tackle the terrorist threat, employment and education, but some restraint in other areas. Lower debt-servicing costs should also help to lower the deficit further to just below 3% of GDP in 2018. The OECD expects the budget trend for all public administrations to be more or less neutral in 2017-18, which seems appropriate, given the recovery in growth and EU constraints. Under a no-policy-change scenario, public debt should continue to move up, albeit at a slow pace (Figure 6). Should interest rates rise more than expected, debt would quickly increase, seriously shrinking room for fiscal policy manoeuvre in the wake of any unanticipated shocks. As such, it is necessary to gradually reduce public spending through reforms addressing inefficiencies as explained below. Such spending cuts should be large enough to lower public debt and labour taxes to raise long-term growth, which would be reinforced by structural reforms discussed below. Such policies would allow debt to decline (see the green line in Figure 6).
Figure 6. Without policy changes the debt-to-GDP ratio is set to increase further
Per cent of GDP
1. The business-as-usual scenario is consistent with the projections from the June 2017 OECD Economic Outlook until 2018, and assumes thereafter an annual real GDP growth of 1.2%, an effective interest rate of 2.7%, annual inflation according to the GDP deflator gradually rising to 1.75% by 2020, and a primary balance deficit improving to 0.5% of GDP from 2020.
2. Assumes a permanent increase in the effective interest rate to 4.1% by 2019. Source:OECD calculations based on OECD (2017), OECD Economic Outlook 101 Database.
1 2 http://dx.doi.org/10.1787/888933577059
2000 2002 2004 2006 2008 2010 2012 2014 2016 2018 2020 2022 2024 2026 2028 2030 50
60 70 80 90 100 110 120 130 140
50 60 70 80 90 100 110 120 130 140
Higher interest rate² (+1.4% points)
Making taxes more favourable to employment and productivity
while maintaining social protection
Sustainable spending reductions
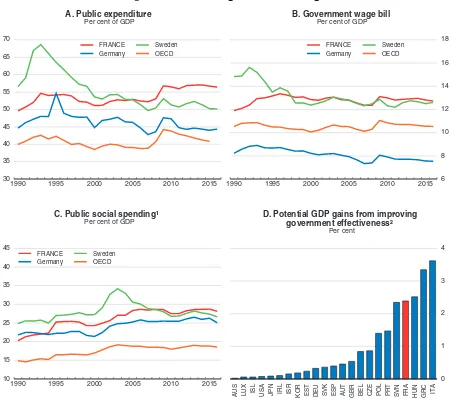
At 56.4% of GDP in 2016 (standardised definition, including tax credits), France has the highest public spending of any OECD country (Figure 7). A long-run strategy is needed to contain public spending, ensure debt sustainability and make room for further tax cuts and simplification. This would help to strengthen employment and investment. Recent tax cuts are helpful, but the tax burden is still too high and complying with the tax system too complex. A long-term strategy to shrink public spending should include reducing pension
Figure 7. The size of government is large
1. Data from 2014 onwards are estimates.
2. Effect after 10 years of a reform phased in over 10 years. In countries where the effectiveness of government is below the average of the top half of the countries, the government effectiveness will gradually converge to this level. See Fournier and Johansson (2016) for details. No potential GDP gains are foreseeable for Canada, Denmark, Finland, New Zealand, the Netherlands, Norway, Sweden and Switzerland, which were already found to be at the frontier of government effectiveness.
Source:OECD (2017), OECD Economic Outlook 101 and OECD Social Expenditure (SOCX) Databases; Fournier, J. and A. Johansson (2016), “The Effect of the Size and the Mix of Public Spending on Growth and Inequality”, OECD Economics Department Working Papers, No. 1344, OECD Publishing, Paris.
1 2 http://dx.doi.org/10.1787/888933577078
1990 1995 2000 2005 2010 2015
30
Per cent of GDP
1990 1995 2000 2005 2010 2015 6
8 B. Government wage bill
Per cent of GDP
1990 1995 2000 2005 2010 2015
10
C. Public social spending¹ Per cent of GDP
0 1 2 3 4
AUS LUX ISL USA JPN IRL ISR KOR EST DEU SVK ESP AUT GBR BEL CZE POL PRT SVN FRA HUN GRC ITA D. Potential GDP gains from improving
spending in relation to GDP, lowering the substantial government wage bill and addressing inefficiencies in public spending, particularly related to the plethora of local governments. Housing policies are another area where heavy fiscal support yields comparatively little benefit (OECD, 2011).
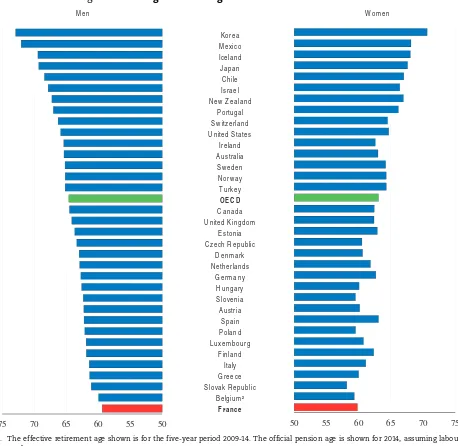
Elevated pension spending, together with the government wage bill, explains most of the gap of public spending between France and comparable economies such as Germany and Sweden (Table 3). Pension spending stands at 14.3% of GDP, which is among the highest in the OECD, although international benchmarking does not reflect the total cost, including private-sector financing. The average age at which workers leave the labour market remains among the lowest in the OECD (Figure 8), but recent reforms to pensions in 2010 and 2015 and unemployment insurance for workers over 50 in 2017 have yet to fully deliver. The system’s long-term financial viability is ensured only under favourable macroeconomic assumptions, even though pension spending will fall significantly as a share of GDP in several scenarios (Conseil d’orientation des retraites, 2017). To strengthen the sustainability and reduce public spending in relation to GDP, gradually increasing the minimum retirement age in line with rising life expectancy seems appropriate (see below). For example, the Conseil d’orientation des retraites (2016) estimates that progressively increasing the minimum retirement age to 65 years could lead to a fall in direct-entitlement pension spending of around 0.6% of GDP by 2030 with sizeable benefits for economic activity (about 0.75% on GDP by 2030 compared to the situation if no reform were introduced). The two other levers that could be used to rein in pension spending, the number of years of contributions required for a full pension and the replacement rate, have largely been used in previous reforms so that they offer little room to generate substantial additional savings.
While the employment rate of older workers (aged 55 to 64) has increased significantly, it remains more than nine percentage points below the OECD average. Older workers still enjoy a longer unemployment benefit entitlement period than their younger counterparts. These advantages were reduced in 2017, but aligning benefit entitlements completely would further improve work incentives for older workers. Better access to high-quality training would
Table 3. Composition of public spending by main component
As a percentage of GDP
Year France Germany
France vs. Germany
Sweden
France vs. Sweden
Difference1 Share in total
difference (%)1 Difference
1 Share in total difference (%)1
Total public spending 2013 57.0 44.6 12.4 100 52.3 4.7 100
2016 56.4 44.4 12.0 100 50.2 6.2 100
Wage bill 2013 12.9 7.7 5.2 42 12.8 0.1 2
2016 12.8 7.5 5.3 43 12.6 0.2 4
Pensions 2013 14.3 10.1 4.2 34 10 4.3 91
Health 2013 8.6 7.9 0.7 6 6.6 2 43
Education2 2013 4.7 3.7 1.0 8 5.2 -0.5 -11
Family benefits 2013 2.9 2.2 0.7 6 3.6 -0.7 -15
Housing 2013 0.8 0.6 0.2 2 0.5 0.3 6
Unemployment 2013 1.6 1.0 0.6 5 0.5 1.1 23
ALMPs 2013 0.9 0.7 0.2 2 1.4 -0.5 -11
1. Numbers may not add to totals because of rounding, overlapping across selected spending categories and non-universal coverage of all spending categories.
2. Excluding pre-primary education.
improve their employability, and making gradual retirement more attractive would help them adapt their working time to their fitness (OECD, 2014a). With 37 different pension schemes the pension system is deeply fragmented, leading to higher management costs than in comparable European countries (1.9% of total pension spending against about 1.3% in Germany and Italy). Building on the planned merger of the two main occupational top-up schemes (Table 4) by moving further towards a single pension system, as planned by the new government, would strengthen labour mobility and lower management costs. The improved transparency would help address public concerns regarding inequities. Once the different schemes have been aligned, it will make sense to gradually raise the minimum retirement age.
Figure 8. Average effective age of labour-market exit in 20141
1. The effective retirement age shown is for the five-year period 2009-14. The official pension age is shown for 2014, assuming labour market entry at age 20.
2. Belgium introduced a certain number of measures in 2015 to raise the effective age of labour market exit, focusing on conditions for accessing early retirement.
Source:OECD (2015), OECD Pensions at a Glance 2015, OECD Publishing, Paris.
1 2 http://dx.doi.org/10.1787/888933577097
Iceland
Men Women
Korea Mexico
Turkey Japan Chile Israel New Zealand
Portugal Switzerland United States
Ireland Australia Sweden Norway
Spain OECD Canada United Kingdom
Estonia Czech Republic
Denmark Netherlands
Germany Hungary Slovenia Austria
Belgium² France Poland Luxembourg
Finland Italy Greece Slovak Republic
50 55 60 65 70 75 50
Local government expenditure represents about 20% of overall public spending. The many layers of government with overlapping competencies and the unusually small size of municipalities generate inefficiencies. Further streamlining local governments could lead to substantial savings over time (Table 4). Continuing reforms and clearly allocating responsibilities will be important. Quickening the pace of commune mergers would help achieve economies of scale and contribute to improving environmental outcomes, as poor waste water treatment tends to be concentrated in small municipalities, for example (OECD, 2016b).
The government wage bill is substantially higher than the OECD average (Figure 7, Panel B). The local government wage bill has increased particularly fast, but there is also room to improve efficiency in some central government services. The new government plans to cut the number of civil servants by 120 000 over the next five years, split between central and local governments. This can be done by replacing one out of every three retiring civil servants. Over time, the restructuring of sub-central governments should contribute to reducing the number of civil servants further. Moreover, the wage bill could be contained and better aligned with conditions in different government services by changing the system governing salary increases. As it stands, salary increases for all 5.6 million civil servants depend on the change in an index reflecting the payment grid to which base salary and other components are linked. Changes are decided by the central government, which announced that it was freezing the index in 2018. Decentralising the calculation of the index between all three categories of the civil service, as planned by the new government, is a step in the right direction.
Improving efficiency and equity in health care
Health outcomes are generally good in France. Health-adjusted life expectancy is high, and the number of deaths that could have been avoided if the health-care system offered more timely and effective services is low (Figure 9, Panel A). However, health-care spending is rising steadily (Panel B), and population ageing will put the system under growing pressure. The life expectancy of lower-income groups is shorter than average (Figure 10,
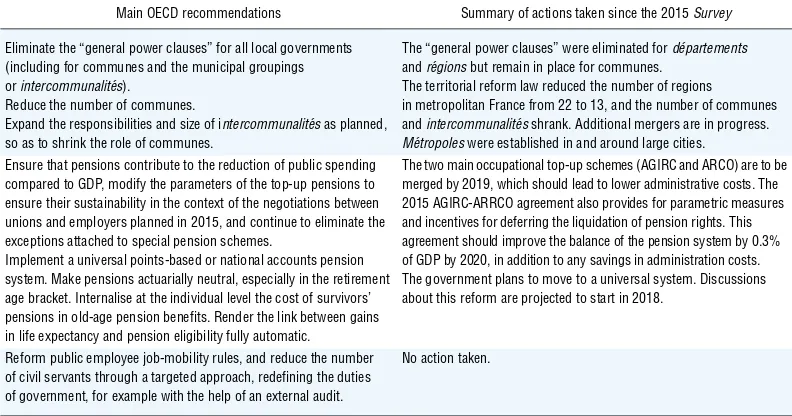
Table 4. Past OECD recommendations to reduce the weight of public
spending and boost its efficiency
Main OECD recommendations Summary of actions taken since the 2015 Survey
Eliminate the “general power clauses” for all local governments (including for communes and the municipal groupings or intercommunalités).
Reduce the number of communes.
Expand the responsibilities and size of intercommunalités as planned, so as to shrink the role of communes.
The “general power clauses” were eliminated for départements
and régions but remain in place for communes. The territorial reform law reduced the number of regions in metropolitan France from 22 to 13, and the number of communes and intercommunalités shrank. Additional mergers are in progress.
Métropoles were established in and around large cities. Ensure that pensions contribute to the reduction of public spending
compared to GDP, modify the parameters of the top-up pensions to ensure their sustainability in the context of the negotiations between unions and employers planned in 2015, and continue to eliminate the exceptions attached to special pension schemes.
Implement a universal points-based or national accounts pension system. Make pensions actuarially neutral, especially in the retirement age bracket. Internalise at the individual level the cost of survivors’ pensions in old-age pension benefits. Render the link between gains in life expectancy and pension eligibility fully automatic.
The two main occupational top-up schemes (AGIRC and ARCO) are to be merged by 2019, which should lead to lower administrative costs. The 2015 AGIRC-ARRCO agreement also provides for parametric measures and incentives for deferring the liquidation of pension rights. This agreement should improve the balance of the pension system by 0.3% of GDP by 2020, in addition to any savings in administration costs. The government plans to move to a universal system. Discussions about this reform are projected to start in 2018.
Reform public employee job-mobility rules, and reduce the number of civil servants through a targeted approach, redefining the duties of government, for example with the help of an external audit.
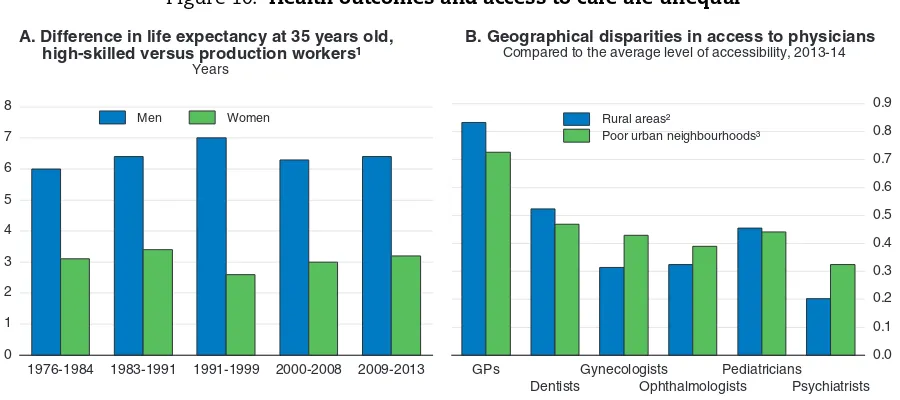
Panel A) and shows no sign of converging, and there are fewer providers in rural areas and poor neighbourhoods (Panel B). The governments’ plan to increase the number of health centres gathering different providers is one way of improving access to care in these areas. The centres would also be helpful to improve co-ordination among providers.
Figure 9. Health outcomes are good, but spending is high
Source:OECD (2017), OECD Health Statistics database; Eurostat (2017), Amenable and Preventable Deaths Statistics.
1 2 http://dx.doi.org/10.1787/888933577116
Figure 10. Health outcomes and access to care are unequal
1. High-skilled workers include white collar and highly qualified workers, such as managers, researchers and industry experts. Production workers refer to both unskilled and less than highly-skilled employees doing mainly manual work.
2. Ratio of accessibility index in rural areas to the index in France. Rural areas are weighted according to their population in 2011. 3. Ratio of density per inhabitants in poor urban neighbourhoods (quartiers prioritaires de la ville) to density in metropolitan France. Source:Blanpain, N. (2016), « Les hommes cadres vivent toujours 6 ans de plus que les hommes ouvriers », Insee Première, No. 1584; Direction de la recherche, des études, de l’évaluation et des statistiques, Drees; OECD calculations based on ONPV (2016), « L’offre de soins dans les quartiers prioritaires de la politique de la ville en 2014 », Rapport annuel de l’Observatoire national de la politique de la ville 2015; Vergier, N. (2016), « Accessibilité aux professionnels de santé libéraux: des disparités géographiques variables selon les conditions tarifaires », Etudes et Résultats, No. 970, Drees; Brutel, C. and D. Levy (2011), « Le nouveau zonage en aires urbaines de 2010 », Insee Première, No. 1374; Drees (2016), Les dépenses de santé en 2015 – Résultats des comptes de la santé.
1 2 http://dx.doi.org/10.1787/888933577135 0
CHE FRA ESP ITA NLD NOR SWE DNK BEL AUT LUX PRT IRL DEU FIN GBR GRC SVN EU28 POL TUR CZE HRV SRB EST SVK HUN BGR ROU LTU LVA A. Deaths avoidable through better health-care, 2014
Per 100 000 inhabitants
1990 1995 2000 2005 2010 2015 0
2
B. Current health-care spending, 1990-2016 Per cent of GDP
0
1976-1984 1983-1991 1991-1999 2000-2008 2009-2013 Men Women
A. Difference in life expectancy at 35 years old, high-skilled versus production workers¹
Years
Health insurance coverage is universal, and access to these rights was strengthened in 2016 when universal health cover (protection universelle maladie) came into force. There are several occupational schemes in addition to the main public insurance scheme. These are topped up by complementary insurance plans, which reimburse a varying amount of what is not covered by the statutory scheme. Out-of-pocket payments are generally low. Government programmes exist for chronic diseases and for the poorest sections of the population (CMU-C and ACS). However, because of a lack of uptake of these programmes, some groups, such as the unemployed and elderly, are less well covered by complementary schemes. Tax breaks promote the expansion of complementary plans for employees. The authorities have recently capped the reimbursement of extra billing by most employer-provided complementary insurance plans, although at a high level. Hence, many employees still have generous complementary insurance plans, contributing to high prices and thereby reducing access for low-income households with less generous coverage (Dormont and Péron, 2016).
Reforming payment schemes for primary care and pharmacists would strengthen prevention (Figure 11) and improve health outcomes. There is near full freedom of practitioner choice, and general practitioners and specialists are mostly remunerated by fee-for-service arrangements, which appear to foster extra billing and large numbers of prescriptions (Figure 12; Paris et al., 2016). Raising the fees pharmacists and physicians receive for prevention efforts, particularly so for complex diseases that require extensive co-ordination, would increase preventive care (OECD, 2016c). In contrast, fees related to sales volume and numbers of prescriptions for less complex diseases should be reduced (OECD, 2016c). Regarding medicines the government has achieved some cost containment through the promotion of generics and caps on some public reimbursements. Developing further the ability of health insurers to contract with groups of providers would improve health-care pathways and ease the treatment of chronic diseases. Sharing electronic
Figure 11. Spending on prevention is low1
Per cent of health-care spending, 20152
1. The scope of institutional spending is different from the entirety of spending on prevention in France, especially for ordinary consultations, which amount to 9.3 billion euros in 2014 according to Drees, i.e. 3.9% of health spending, compared to 2.0% in 2014 according to OECD figures.
2. Or latest available year.
Source:OECD (2017), OECD Health Statistics Database.
1 2 http://dx.doi.org/10.1787/888933577154 0
1 2 3 4 5 6 7
0 1 2 3 4 5 6 7
ISR GRC BEL PRT AUS FRA ESP LVA SVK AUT ISL CHE LUX DNK HUN SVN POL IRL CZE JPN
OECD USA NOR DEU SWE EST MEX KOR NLD FIN ITA
health records between primary-care providers would also aid in co-ordination and limit wasteful expenditures (OECD, 2017a). Strengthening the assessment of clinical and cost effectiveness and safety of new medications would also help (Polton, 2015).
Promoting prevention and healthier lifestyles, as announced by the new government, would improve long-term health outcomes. Despite information campaigns and higher taxes on tobacco and some sugary drinks, the number of daily smokers and the level of alcohol consumption are still well above the OECD averages, while the obesity rate was increasing rapidly until recently (OECD, 2014b). Banning advertisements on digital media, monitoring high-risk populations, tightening sanctions against illegal sales and encouraging technology blocking drunk drivers would significantly lower the social costs of alcohol consumption. Raising taxes on alcohol and reforming the excise tax on soft drinks to reflect their sugar content and extending it to food products would be more effective than information campaigns (Sassi et al., 2013).
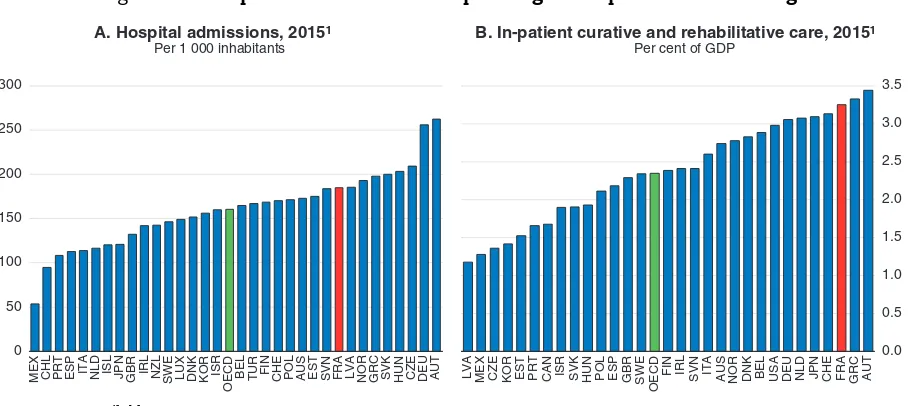
The hospital sector has unexploited efficiency reserves. Admissions are numerous and costly, partly encouraged by an activity-based payment system (Figure 13). Staff management rigidity largely related to the civil service status of most public hospital employees has led to a rising and costly recourse to temporary contracts with independent health practitioners, worsening patient outcomes and working conditions (Bloom et al., 2014; Coutrot and Davie, 2014). The remuneration of practitioners on temporary missions was capped by the 2016 law modernising the health-care system. This trend could be reversed by amending the status of hospitals’ employees to enhance the autonomy of public hospital managers for hiring decisions, careers and wages. This would allow them to manage human resources more efficiently and could lead to lower spending, as the wage bill amounts to 60% of public hospital spending (Drees, 2016). A 2016 reform eased collaboration between hospitals and their specialisation by creating new local hospital groups. This should reduce incentives for activity maximisation and help rationalise coverage in rural areas.
Figure 12. Spending on pharmaceuticals and prescriptions is high
1. Or latest available year.
2. In hospital and primary care. A drug’s defined daily dose is the assumed average maintenance dose per day for its main indication in adults (e.g. 3 grams for oral aspirin). It is constant across countries.
Source:OECD (2017), OECD Health Statistics Database.
1 2 http://dx.doi.org/10.1787/888933577173
0.0 0.5 1.0 1.5 2.0 2.5 3.0
DNK NOR ISR EST NLD SWE FIN IRL GBR POL CHE CZE KOR AUS LVA BEL OECD MEX AUT PRT
ITA SVN CAN ESP DEU FRA JPN USA HUN SVK GRC A. Medical goods, 2015¹
Per cent of GDP
0 5 10 15 20 25 30 35 40 45
CHL NLD EST SWE LVA HUN SVN ISR DEU KOR NOR AUT DNK FIN LTU CAN CZE OECD GBR
ISL PRT AUS POL SVK IRL ESP LUX ITA BEL FRA GRC TUR B. Overall volume of antibiotics prescribed, 2013¹
Simplifying the tax system and the framework of environmental regulation
The tax system is complex, with a large number of frequently changing exemptions and credits, making for high compliance and collection costs. For example, firms are subject to 233 different taxes. Taxes on production, such as the contribution sociale de solidarité des sociétés
levied on firms’ turnover and the cotisation sur la valeur ajoutée des entreprises levied on firms’ value added, which directly affect profit margins, are particularly onerous: 3% of GDP, compared to 1% in Spain and 0.4% in Germany (European Commission, 2017). Eliminating taxes, reducing rates and broadening bases should continue to be a priority.
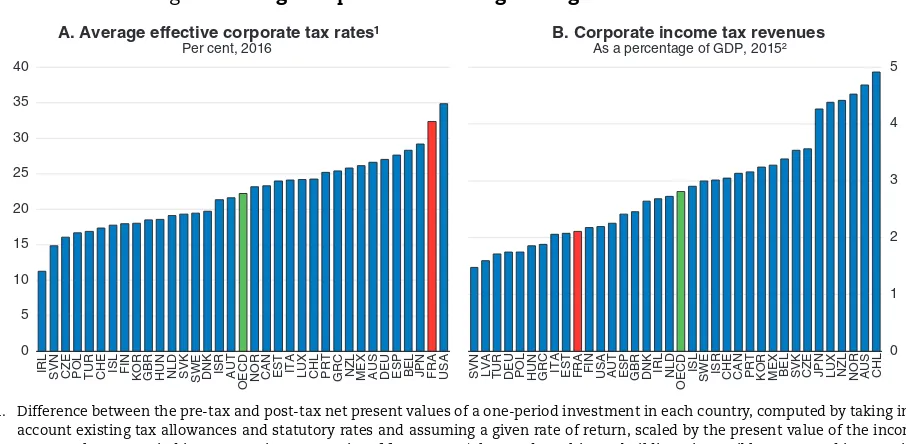
The corporate income tax combines high rates, which differ by firm size, with a low yield, creating financing distortions, despite measures taken in 2013 to limit the deductibility of interest, and obstacles to investment, firm entry and productivity growth (Figure 14). Reducing the statutory rate to 25% from 33.3%, as promised by the new government, is desirable, as is broadening its base (Conseil des prélèvements obligatoires, 2016). The effectiveness of generous R&D tax credits would be worth further examination. New rules could be introduced to limit the possibility for firms to carry back their losses, while further cutting corporate rates to promote innovation spending (OECD, 2014c). The reduced corporate rate for SMEs can be a barrier to firm growth, as small firms may shy away from growing beyond the threshold for the reduced rate. It should be reconsidered.
Limiting the role of earmarked social contributions would make the tax system simpler and more employment-friendly. More than a third of revenues are labour taxes – mainly social contributions. This is high in international comparison (Figure 15) and undermines incentives to work and hire. Recent cuts in social contributions on low wages are welcome, as studies show that this is likely to promote employment (Cahuc et al., 2014). Yet, these measures combine a tax credit, the credit d’impôt pour la competitivité et l’emploi (CICE), paid with a year’s lag, and reductions of contributions with different withdrawal rates, a complex set-up that can limit effectiveness. In fact, early evaluations of this tax credit have shown benefits that may take some time to materialise but are already perceptible. The CICE monitoring committee (France Stratégie, 2017) reports a positive impact on employment in
Figure 13. Hospital admissions and spending on in-patient care are high
1. Or nearest available year.
Source:OECD (2017), OECD Health Statistics Database.
1 2 http://dx.doi.org/10.1787/888933577192
0 50 100 150 200 250 300
MEX CHL PRT ESP ITA NLD ISL JPN GBR IRL NZL SWE LUX DNK KOR ISR
OECD
BEL TUR FIN CHE POL AUS EST SVN FRA LVA NOR GRC SVK HUN CZE DEU AUT A. Hospital admissions, 2015¹
Per 1 000 inhabitants
0.0 0.5 1.0 1.5 2.0 2.5 3.0 3.5
LVA MEX CZE KOR EST PRT CAN ISR SVK HUN POL ESP GBR SWE OECD FIN IRL SVN ITA AUS NOR DNK BEL USA DEU NLD JPN CHE FRA GRC AUT B. In-patient curative and rehabilitative care, 2015¹
2013 and 2014, amounting to between 50 000 and 100 000 jobs created or saved. Reducing social contributions across the board while giving progressive income taxes a bigger role would be a simpler way to lower labour taxes on low wages. Many expenditures for which social contributions are currently earmarked benefit society as a whole and would be better financed from the general budget, for example those for families, training, social housing and non-contributory health insurance.
Figure 14. High corporate tax rates go along with low revenues
1. Difference between the pre-tax and post-tax net present values of a one-period investment in each country, computed by taking into account existing tax allowances and statutory rates and assuming a given rate of return, scaled by the present value of the income stream. The one-period investment is a composite of four assets (plant and machinery, buildings, intangible assets and inventories) financed by debt and equity.
2. Or latest year available.
Source:Oxford Centre for Business Taxation (2017), CBT Database; OECD (2017), OECD Revenue Statistics Database.
1 2 http://dx.doi.org/10.1787/888933577211
Figure 15. Taxes on labour remain high
1. The tax wedge corresponds to income tax plus employee and employer contributions less cash benefits. 2. At 67% of the national average wage.
Source:OECD (2017), OECD Taxing Wages Database.
1 2 http://dx.doi.org/10.1787/888933577230
0
IRL SVN CZE POL TUR CHE ISL FIN KOR GBR HUN NLD SVK SWE DNK ISR AUT
OECD NOR CAN EST ITA LUX CHL PRT GRC NZL MEX AUS DEU ESP BEL JPN FRA USA A. Average effective corporate tax rates¹
Per cent, 2016
SVN LVA TUR DEU POL HUN GRC ITA EST FRA FIN USA AUT ESP GBR DNK IRL NLD
OECD
ISL
SWE ISR CHE CAN PRT KOR MEX BEL SVK CZE JPN LUX NZL NOR AUS CHL B. Corporate income tax revenues
As a percentage of GDP, 2015²
0
CHL NZL ISR MEX KOR CHE IRL AUS GBR CAN USA ISL NLD JPN LUX
OECD NOR DNK POL TUR ESP GRC PRT EST FIN SVN SVK CZE ITA SWE LVA AUT FRA DEU BEL HUN A. Tax wedge on low wages¹
% of labour costs, single person (no children)², 2016
0
CHL NZL MEX CHE ISR KOR IRL AUS GBR CAN USA JPN ISL POL
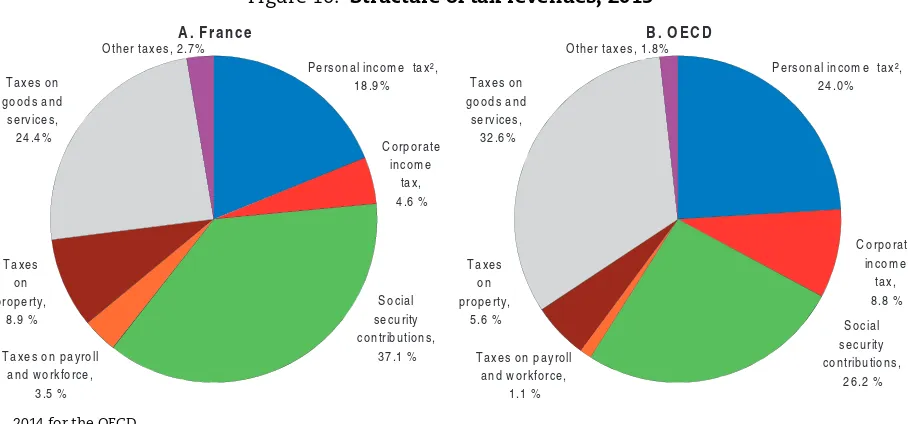
The personal income tax currently contributes far less to overall tax revenues than in the average OECD country (Figure 16). It combines progressive (impôt sur le revenu des personnes physiques) and proportional (contribution sociale généralisée) components. The proportional PIT has a broader base and generates more revenues, while only 42.8% of households paid the progressive PIT in 2016. Given the limited revenue share of progressive income taxes the tax system contributes less to the reduction in inequality than in many other OECD countries (Figure 17). The new government plans to compensate the revenue loss from the planned elimination of employees’ contributions for health care and unemployment by increasing the
Figure 16. Structure of tax revenues, 20151
1. 2014 for the OECD.
2. Including the contribution sociale généralisée. Source:OECD (2017), OECD Revenue Statistics Database.
1 2 http://dx.doi.org/10.1787/888933577249
Figure 17. Taxes have limited effectiveness in reducing income inequality
Reduction in gross income inequality1 due to household taxes, Gini coefficient points, 20142
1. After social transfers. 2. Or latest year available.
Source:OECD (2017), OECD Income, Distribution and Poverty Database.
1 2 http://dx.doi.org/10.1787/888933577268
Personal income tax², 18.9% Taxes on payroll
and workforce,
Other taxes, 2.7%A. France
Personal income tax², 24.0% Taxes on payroll
and workforce,
Other taxes, 1.8%B. OECD
0.00
CHE CHL POL SVK LTU JPN EST NZL SWE LVA CZE ESP FRA LUX OECD GRC
ISL CAN USA DNK
proportional PIT. But the tax system would gain in transparency and equity by giving a more important role to the progressive PIT, for example by further reducing tax expenditures that benefit mainly higher-income households. The new government plans to tax capital income at a single 30 per cent flat rate, which could give room to remove at least some of the myriad tax breaks to specific savings accounts (e.g.,plan d’épargne logement, livret d’épargne populaire
and livret de développement durable) and shared savings plans (plan d’épargne en actions and plan d’épargne salariale). This would ensure neutrality of taxation across and within asset classes (Table 5; OECD, 2013). Lower social contributions could be combined with a new tax bracket with a low rate to extend progressive income taxes to more households, while lowering their labour taxes overall. The special tax reduction mechanism on the progressive PIT (décote) should be phased out, as it complicates the tax system, hinders progressivity and leads to threshold effects that are detrimental for economic activity (Pacifico and Trannoy, 2015). A desirable long-term objective would be to implement a single, simple and progressive PIT as in most other OECD countries. The move to withhold the progressive PIT at the source in 2019 will facilitate implementing such a change.
Table 5. Past OECD recommendations for a tax system
promoting sustainable growth
Main recent OECD recommendations Actions taken since the 2015 Survey
Pursue the development of an efficient environmental tax system by aligning the tax structure for fossil fuels with their carbon emissions and other externalities.
The tax differential between diesel and petrol cars was reduced, and the new government plans to align the taxation of diesel with that of petrol by 2022. The trend in the carbon tax, which was written into the law with a target of 100€/t CO2 by 2030, is on track. The new administration intends to accelerate this rise.
Free up the property market by cutting transaction costs. Registration fees increased in most départements. Enhance the neutrality of capital taxation across and within asset
classes, in particular by ending preferential tax treatment of certain investment income.
No action taken.
Figure 18. VAT revenue shortfall due to tax breaks
VAT revenue ratio1 (%), 2014
1. Ratio between the actual value-added tax (VAT) revenue collected and the revenue that would theoretically be raised if VAT was applied at the standard rate to all final consumption. It implicitly measures the share of potential tax revenues lost due to the existence of preferential tax treatments.
Source:OECD (2016), Consumption Tax Trends 2016: VAT/GST and excise rates, trends and policy issues, OECD Publishing, Paris.
1 2 http://dx.doi.org/10.1787/888933577287
0.0 0.2 0.4 0.6 0.8 1.0 1.2 1.4
0.0 0.2 0.4 0.6 0.8 1.0 1.2 1.4
MEX GRC ITA ESP TUR POL GBR ISL BEL NLD SVK PRT FRA IRL AUS CAN LVA FIN DEU
OECD NOR HUN SWE CZE DNK AUT SVN CHL
Value added taxes account for a relatively low share of revenues, reflecting exemptions and reduced rates (Figure 18). The effect of these is often regressive, for example in the case of hotels and restaurants (Ruiz and Trannoy, 2008), yet a stronger role for VAT could still reduce the progressivity of the tax system. This is best counteracted through means-tested transfers to low-income households and a larger role for the progressive personal income tax.
Figure 19. Green growth indicators: France
Source:OECD (2017), Green Growth Indicators (database). For detailed metadata click here.
1 2 http://dx.doi.org/10.1787/888933577306
A. CO2 intensity B. Energy intensity
C. Population exposure to air pollution D. Municipal waste generation and recycling
E. Environment-related taxes F. Environment-related technologies
0.0
CO2per GDP - production based
(kg/USD, 2010 PPP prices)
OECD
CO2tonnes per capita,
demand and production based
OECD Total primary energy supply per GDP (ktoe/100 USD 2010 PPP)
OECD % of renewables in total
primary energy supply Mean annual concentration
of PM2.5 (μ g/m³) % of population exposed
to PM2.5, 2015 2015 (% of treated)
Incineration
2000 2005 2010 2015 Municipal waste generated
(kg/person) Tax rate of unleaded petrol and diesel, 2015 (USD/litre)
0 Inventions per capita 2011-13 (patents/million persons)
FRA OECD FRA OECD 1990-92 2011-13
Increasing environmentally related taxes would yield extra revenues, while helping to address environmental challenges. Environmentally related tax revenues are low compared to the OECD average (Figure 19, Panel E), reflecting in part low CO2 emissions (as France relies heavily on nuclear energy) but also low average effective tax rates on heating and process energy and on CO2 by international standards (OECD, 2015a). The increase in diesel taxation to bring it closer to petrol taxes is encouraging and could be expedited. Diesel has long enjoyed preferential treatment in terms of vehicle and fuel taxation, but taxing it more leniently than petrol is not justified, given the fact that it pollutes more by most measures such as fine particles and NO2 (Harding, 2014). The share of private diesel cars almost doubled to 62% from 2000 to 2014, one of Europe’s highest rates, and many people are exposed to dangerous amounts of particulate matter (Panel C). The government has announced its intention to equalise the taxation of diesel and petrol before the end of the current administration. The incorporation of a carbon component into fossil fuel taxation in 2014 was a significant step. It could be made more effective by further removing environmentally damaging fuel tax exemptions, for example for road haulage, agricultural machinery and public works, which cost more than 2 billion euros per year. Other pollutants should also be taxed more, such as mineral fertilisers, which are an important source of environmental damage in France. The government should continue to raise its carbon tax, as it has been doing, to its target of 100 euros per tonne of CO2 in 2030 to strengthen France’s efforts to
reduce greenhouse gas emissions, in accordance with the trajectory set out in the Energy Transition for Green Growth Act. This trajectory must be at a minimum respected or raised.
Beyond taxation, the quality of environmental regulation needs to improve. The 2015 Energy Transition for Green Growth Act established ambitious objectives to shift electricity generation towards renewables (Figure 19, Panel B). Yet, there are many targets that are difficult to reconcile, and regulations are complex, with frequent changes hampering their effectiveness (OECD, 2016b). Pursuing the rationalisation efforts launched by the Energy Transition Act in order to ensure clearer and more stable long-term measures to support renewables and energy efficiency more generally, while reducing the role of nuclear energy, would support the energy transition (OECD, 2016b). In this light, the new government has announced its intention to close nuclear power stations in step with the expansion of renewable energies.
Strengthening productivity growth
While hourly labour productivity is high in France, its growth has slowed, as elsewhere in the OECD, particularly since the mid-2000s, mainly because of weak total factor productivity (TFP) increases (Figure 20). High labour productivity is partly linked to the exclusion of many low-productivity workers from the labour market. In turn, a major cause of the recent productivity slowdown is a combination of factors common to all advanced countries. But it can be partly traced to factors specific to France, such as greater entry of lower-productivity workers owing to a simplified regime for micro entrepreneurs (auto-entrepreneurs), reduced taxes on low-wage workers – two measures that have boosted employment but depressed the productivity trend, and a sharp rise in the use of contracts shorter than a month that limit on-the-job-training opportunities (Askenazy and Erhel, 2015) (Figure 21). But there are other factors hampering the adoption of new technologies and productivity in many French firms.
necessary to adopt new technologies. But France has a larger share of poorly managed firms than the United States and Sweden (Figure 23, Panel A), which explains more than half of its shortfall in total factor productivity vis-à-vis the United States (Bloom et al., 2016). Stronger competition would spur the adoption of better management practices and re-allocation of resources to the best managed firms. Good labour relations are also crucial to re-organise work processes. In fact, French firms with better labour relations enjoy higher productivity (Cette et al., 2013). Reforms have improved labour unions’ representativeness and the quality of labour relations, but managers still tend to see them as conflictual (Panel B).
Reforms of labour and product markets and housing regulations would enhance competition, skills matches and productivity (Figure 24). Regulations on start-ups and those in services sectors that hinder firm entry, competition and productivity are stricter than in many other OECD countries (Bourlès et al., 2013). Dismissal costs for open-ended contracts are high, owing to long legal procedures with highly uncertain outcomes, despite
Figure 20. TFP growth has slowed
Source:OECD (2017), OECD Economic Outlook 101 Database.
1 2 http://dx.doi.org/10.1787/888933577325
Figure 21. The use of employment contracts shorter than one month has risen steadily
New hires by type of contract, index 2000 Q1=100
Source:ACOSS-URSSAF.
1 2 http://dx.doi.org/10.1787/888933577344
-1.0 -0.5 0.0 0.5 1.0 1.5 2.0 2.5 3.0
ITA PRT MEX ESP LUX BEL GRC AUT NLD CAN FRA DNK GBR FIN CHE NZL AUS CHL OECD JPN DEU ISR USA SWE SVN HUN NOR EST TUR ISL KOR LVA IRL CZE POL SVK
A. TFP growth, 2000-16 Average annual percentage changes
1990 1995 2000 2005 2010 2015 95 100 105 110 115 120 125 130
FRANCE OECD
France, 1990-2000 trend
B. TFP levels Index, 1990=100
2000 2001 2002 2003 2004 2005 2006 2007 2008 2009 2010 2011 2012 2013 2014 2015 2016 50
100 150 200 250 300
50 100 150 200 250 300
Open-ended contracts
the introduction in 2016 of indicative scales for indemnities payable in cases of dismissal without real and serious cause and in conciliation cases. High dismissal costs hinder a more efficient resource allocation towards the most productive and innovative firms (Andrews and Cingano, 2012; Andrews and Westmore, 2014). Housing transactions costs are elevated, hindering labour mobility and thus productivity and employment (Adalet McGowan and Andrews, 2015). Lowering high registration fees for real estate transactions and raising recurrent taxes on immovable property, which are less distortionary, would improve labour mobility (Arnold et al., 2011).
The 2015 law on growth, activity and equal opportunities improved the competitive environment in a number of areas (Table 6). But barriers to entry and restrictions on
Figure 22. The share of adults with no knowledge of ICT is high1
16-65, 2012-15
1. Share of adults who declared a lack of any ICT experience, opted out of the PIAAC computer-based assessment or failed the ICT core test. 2. The data are based solely on Flanders for Belgium and England and Northern Ireland for the United Kingdom.
Source:OECD (2016), Skills Matter: Further Results from the Survey of Adult Skills, OECD Skills Studies, OECD Publishing, Paris.
1 2 http://dx.doi.org/10.1787/888933577363
Figure 23. Better management and labour relations would support technology adoption
1. Index scale from 1 (worst practice) to 5 (best practice), manufacturing sector.
2. Index scale of 0 to 7, from lowest to highest perceived quality in labour-employer relationship.
Source: World Management Survey Database; World Economic Forum (2016), World Competitiveness Report 2016-17 Database.
1 2 http://dx.doi.org/10.1787/888933577382
0
France Sweden United States
A. Density of firms across management practice scores¹
2004-2014
B. Quality of labour-employer relations
Figure 24. Estimated gains to the level of labour productivity from policy reforms that reduce skills mismatch
Per cent increase in labour productivity associated with aligning policies to best practice
1. Estimates are based on: i) logit regressions of probability of mismatch controlling for age, marital and migrant status, gender, education, firm size, contract type, a dummy for working full-time and working in the private sector; and ii) OLS regressions of labour productivity on skills mismatch.
Source:Adalet McGowan, M. and D. Andrews (2015), “Skill Mismatch and Public Policy in OECD countries”, OECD Economics Department Working Paper, No. 1210, OECD Publishing, Paris http://dx.doi.org/10.1787/5js1pzw9lnwk-en.
1 2 http://dx.doi.org/10.1787/888933577401
Maximum
Minimum Minimum Minimum Minimum Minimum Minimum Minimum Minimum Minimum (POL)
Framework policies Housing policies Other policies
France
Table 6. Past OECD recommendations for improving competition
and the business environment
Main recent OECD recommendations Actions taken since the 2015 Survey
Task an independent institution to conduct a thorough review of all existing and proposed regulations affecting firms, applying the OECD Competition Assessment Toolkit principles.
No action taken.
Continue to streamline burdensome permit procedures for large new stores. Eliminate restrictions on loss-leader selling, dates of discount sales and opening hours (for which time-off and salary compensation should be negotiated).
New touristic areas were created to facilitate work on Sundays. Mayors can authorise openings on up to 12 Sundays a year.
Continue to liberalise the regulated professions by: reducing entry requirements to those needed to protect the public; narrowing professions’ exclusive rights; eliminating regulated tariffs in potentially competitive activities; and gradually abandoning quotas.
Entry barriers in regulated legal professions were eased. Tariff regulations governing certain legal professions were reformed. The creation of firms combining all legal and accounting professions is now possible.
Ensure non-discriminatory access to the rail network. In particular, modernise the process of allocating service slots for rail freight, and separate the rail infrastructure manager from the station manager. Pool regulatory powers for the various modes of transport under a single land transport regulator.