ANALYSIS OF MARKET TIMING TOWARD LEVERAGE OF
NON-FINANCIAL COMPANIES IN INDONESIA
Vera Pipin Wulandari
Faculty of Economics and Business Universitas Gadjah Mada ([email protected])
Kusdhianto Setiawan
Faculty of Economics and Business, Universitas Gadjah Mada ([email protected])
ABSTRACT
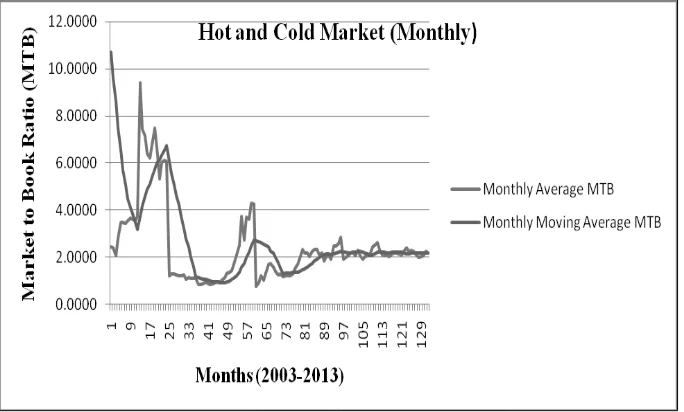
This study aimed to examine the effect of market timing on leverage on non-financial compa-nies in Indonesia. Market timing was tested on the hot and cold market conditions. Hot and cold markets are determined by the monthly market to book ratio. A hot (cold) market occurs when the average market to book ratio of a particular month is above (below) the value of the moving average of the monthly market to book ratio. This study also aimed to test whether non-financial companies in Indonesia persistently applied leverage policies. This study used two research models. The first model was a panel data with a sample size of 77 non-financial companies listed on the Indonesian Stock Exchange from 2002-2013.The second model was a cross section data with a sample size of 157 non-financial companies that conducted their IPO in Indonesia from 2003-2013. The dependent variable in both the research models was leveraget (levt). The independent variables were markett and leveraget-1 (levt–1). The control variables were profitabi-lityt-1 (proft-1); and sizet-1. The results of this study indicated that market timing affected the lev-erage of non-financial companies listed on the Indonesian Stock Exchange. However, market timing did not affect the leverage of non-financial companies that had their IPO in Indonesia. The non-financial companies in Indonesia were not persistently applying a leverage policy. The capital structure of non-financial companies in Indonesia changed because of the influence of variable profitability and size (which supports the pecking order and trade off theory).
Keywords: market timing theory, leverage, hot and cold market, market to book ratio
INTRODUCTION
The goal of financial decision making is to maximize the shareholders’ wealth. Such finan-cial decisions include (1) the investment deci-sion; (2) financing decideci-sion; and (3) dividend policy.
The most important funding decision is the value of the company's capital structure. The optimal capital structure by Brealey, et al (2011) would be a capital structure that could minimize the overall costs of capital or the average costs of capital in order to maximize its value.
There are several theories regarding the capi-tal structure, which are the trade off theory, pecking order theory and market timing theory. Baker and Wurgler (2002) explained that equity market timing was an important aspect of corpo-rate financing policy. The market timing theory says that companies tend to issue their shares when their market value is high and are likely to buy back the stock, or issue the debt, when the market value is low, in order to obtain funds at a cheaper cost of capital.
leverage. That effect is permanent and had per-sistence in the capital structure for at least a ten year period. In the long run, the changes in capi-tal structure are influenced by the opportunity to issue or buy back shares. This means that chang-es in the capital structure in the long term are influenced by the perceptions of managers in taking advantage of the issuance and repurchase of equity. So, the accumulation of capital struc-ture is the result of a decision to utilize, by trad-ing in the market, the value of the shares when they are overvalued or undervalued.
However, the research of Hovakimian (2006) explained that the effect of market timing on capital structures was temporary. That effect was negative and significant to the leverage only in the first year after the IPO. Hovakimian (2006) treated convertible debt as debt. But, Baker and Wurgler (2002) treated convertible debt as equi-ty. This would reduce the leverage ratio.
Alti (2006) examined the effect of market timing on capital structures by using other varia-bles, which happened to be the same as those used by Baker and Wurgler (2002). The differ-ence was that Alti (2006) used a hot and/or cold market as a proxy of market timing. The re-search result showed that the hot market had a very strong negative effect on leverage, but the negative effect was quickly turned around. In the second year after the IPO, that effect was already lost. Overall, the results of this study showed that market timing was an important factor in financing activities in the short term, but the ef-fects of market timing were limited in the long term.
One of the practices of market timing is uti-lizing the company's stock mispricing in the market, to obtain funds at relatively low capital costs. Mispricing is a condition in which the price of a stock, instead of being at its fair, rea-listic value is actually overvalued or undervalued on the market. The implication is that (1) if the stock is overvalued compared to its assessed fair value, the company will tend to issue new shares; and (2) if the stock is undervalued, the company would issue the debt and buy back its shares.
The consistent utilization of share mispricing can only occur in an inefficient market. In such inefficient markets, managers can choose the right time to issue shares, in other words when the price is above the fair value. Quoted from Saad and Siagian (2011), “The behavior of in-vestors as if rational and arbitration mechanisms that not perfect will lead mispricing and cause markets to be inefficient”. Empirical evidence has shown that the Indonesian capital market is in an inefficient condition (Kim and Shamsud-din, 2008; Hoque, et al, 2007). It gave signs that investors in Indonesia’s capital market behaved as if they were rational. Therefore, it can be con-cluded that the theory of capital structure equity market timing by Baker and Wurgler (2002) should be applied to markets which are not effi-cient.
Quoted from Muhsinin (2011) “The research that has been conducted into the condition of the capital markets in Indonesia showed that the ma-jority of shares had a low autocorrelation coeffi-cient which was not significantly different from zero” (Husnan, 1990 and Esti, 1995). However, the Indonesian capital market cannot be said to be efficient because there were shares that had different autocorrelation coefficients to zero. The test was a weak form of efficiency testing. In testing the weak forms of efficiency, the capital market should be efficient if the changes in stock prices followed a random walk pattern. There-fore, investors cannot earn abnormal returns by using trading rules which were based on the in-formation of a stock’s previous price (Husnan, 2005). The change in the share’s price in the past is expressed as a percentage. To determine the relationship between the past share price with the future share price, an autocorrelation coeffi-cient is used. If the coefficoeffi-cient is found to be equal to zero then the capital market is efficient. This is because the pattern of changes in the share prices follows a random walk pattern.
condi-tions on the capital structure of non-financial companies in Indonesia in the two models. The first model examined the effect of market condi-tions (hot and cold markets) on the capital struc-ture of non-financial companies listed on the Indonesian Stock Exchange (IDX) from 2002 to 2013. The second model examined the effect of market conditions (hot and cold markets) on the non-financial corporate capital structure which conducted an IPO in Indonesia from 2003 to 2013. The researchers used data from 2002 to 2013 as the period of study in order to reduce any bias in the result. The researchers also used non-financial companies as the sample because non-financial companies have different charac-teristics to financial companies. The financial companies tend to carry larger levels of debt than the non-financial companies for the same equivalent level of risk (Jensen and Meckling, 1976).
Hot and cold market values were determined based on the monthly market to book ratio. Hot (cold) market was the monthly average market to book ratio that was above (below) the monthly moving average market to book ratio. Market conditions were used as independent variables to test their effects on changes in the level of leve-rage used by the company.
The researchers focused on the market to book ratio to capture any market timing and its impact on the capital structure. There is one ver-sion of market timing where economic agents have motives that can be perceived as mispric-ing, which causes irrational mispricing of stocks from time to time. Based on this, a manager act-ing in the interest of his existact-ing shareholders will take advantage of market timing in order to obtain funds at a lower capital cost by issuing shares which are overvalued at the time. The market to book ratio can be used to see if the value of the equity was overvalued or underva-lued. Thus, the market to book ratio indicates the motivation for the market timing for the funding policy (Baker and Wurgler, 2002).
In this study, the researchers tried to investi-gate the persistence of non-financial corporate leverage policy in Indonesia. If such a policy of leverage by non-financial companies listed on
the stock exchange was persistent, then the value of the leverage ratio in year t-1 would be equal or nearly equal to the value of leverage in year t (at any market condition in year t-1 and t).
Therefore, there were three objectives of the research. The first objective was to determine whether market conditions (hot and cold mar-kets) affected the leverage of non-financial com-panies listed on the Indonesian Stock Exchange and of non-financial companies that held their IPO in Indonesia. The second objective was to determine whether non-financial companies listed on the Indonesian Stock Exchange and the non-financial companies who held their IPO in Indonesia persistently applied a leverage policy. The third objective was to determine whether the pecking order and trade off theory had any effect on the leverage of non-financial companies listed on the Indonesian Stock Exchange and non-financial companies that issued their IPO in Indonesia.
THEORIES AND HYPOTHESES
1. Theory of Equity Market Timing
The equity market timing theory (Baker and Wurgler, 2002) states that firms will tend to is-sue equity (decrease leverage) when they have a high market value and will buy back the equity or issue the debt when they have a low market value.
There exists two versions of market timing (Baker and Wurgler, 2002) based on two eco-nomic motive agents. The first version is that the economic agent has perceived a mispricing motif that is irrational. That causes mispricing in the share price of the companies from time to time. Therefore, managers that act in the interests of the shareholders will take advantage of this mar-ket timing in order to obtain funds at a lower capital cost by issuing shares when the price is overvalued. This applies to companies prior to and after their Initial Public Offering (IPO).
found when the average market to book ratio for a certain month is above (below) the moving average market to book ratio of that same month. The theory of market timing, as explained above, will be tested on hot and cold market conditions. H1 : market condition (hot market and cold mar-ket) negatively affect the leverage changes in non-financial companies listed on the In-donesian Stock Exchange.
H5 : market conditions (hot market and cold market) negatively affect the leverage changes in non-financial companies that did their IPO in Indonesia.
2. Persistence of Leverage Policy
Leverage policy persistency is applied if the value of the leverage at t-1 is equal or nearly equal to the value of the leverage at t, despite market conditions at the time t-1 being the same or different to the market conditions at the time t. In the first model, if the leverage policy of non-financial listed companies on the stock ex-change is persistent, the value of the leverage ratio in year t-1 will be equal or nearly equal to the value of the leverage in year t (any market conditions in year t-1 and t). In the second mod-el, if the leverage policy of the non-financial corporations that held their IPOs in Indonesia is persistent, the value of the leverage ratio in year t-1 (the year prior to the IPO) will be equal or nearly equal to the value of leverage in year t (the year after an IPO) for any market conditions in the years before and after the IPO. The hypo-theses of persistence of leverage policy are for-mulated below:
H2: non-financial companies listed on the Indo-nesian Stock Exchange persistently apply a leverage policy.
H6: non-financial companies that had their IPO in Indonesia persistently apply a leverage policy.
The leverage policy of non-financial compa-nies in Indonesia is persistent, if:
1) The control variable Levt-1 has tvalue> ttable; tant factor in determining its capital structure. If it has large retained earnings, the company will tend to use these retained earnings as working capital. This is because of the cost of informa-tion asymmetry. Issuance of debt has a cost asymmetry higher than that of the use of retained earnings in the fulfillment of its financing needs (Hanafi, 2008). Based on the theory of the peck-ing order as explained above, the followpeck-ing hy-potheses were formulated:
H3: profitabilityt-1 affects leveraget in non-finan-cial companies listed on the Indonesian Stock Exchange.
H7: profitabilityt-1 affects leveraget in non-finan-cial companies that held their IPO in Indo-nesia.
4. Trade Off Theory
H4: sizet-1 affects leveraget in non-financial com-panies listed on the Indonesian Stock Ex-change.
H8: sizet-1 affects leveraget in non-financial com-panies that had an IPO in Indonesia.
RESEARCH METHODOLOGY
1. Types and Sources of Data
The data used in this study was secondary data. The secondary data comprised of the an-nual basic financial statements issued by the companies to the public. These were obtained from the Indonesian Stock Exchange; OSIRIS; and the Indonesian Capital Market Directory.
2. Population and Sample
The populations in this research comprised of non-financial companies listed on the Indo-nesian Stock Exchange between 2002-2013 (the first model) and non-financial companies that held their IPOs in Indonesia between 2003-2013 (the second model). The researchers used a pur-posive sampling technique to obtain a represent-ative sample in accordance with the criteria, as set by the author. This purposive sampling method is a method of sampling research by matching certain criteria with the needs of the research (Sekaran, 2010). The author included specific considerations (judgment sampling) in order to provide the desired information. The criteria that were set by the author to determine the sample of the companies in the first research model were:
1) The non-financial companies that were listed on the Indonesian Stock Exchange during the period from 2002-2013.
2) These companies did not stop their operations and delist during the research period.
3) The companies provided annual financial reports periodically to the Indonesian Stock Exchange during the research period.
4) The companies had a complete data set that could be used in the research.
5) Based on the criteria above, the researcher found 77 samples for the first model.
The criteria that were set by the researcher to determine the sample of the companies in the second research model were:
1) The non-financial companies that held their Initial Public Offering (IPO) on the Indone-sian Stock Exchange between 2003-2013. 2) The companies did not stop their operations
and delist during the research period.
3) The companies provided annual financial reports periodically to the Indonesian Stock Exchange during the research period.
4) The companies had a complete data set that could be used in the research.
Based on the criteria above, the researcher obtained 157 samples for the first model.
1. Models Analysis
a. The First Model
Levi,t = β0 + β1 (market)t + β2 (Levt-1)i,t + β3 (Proft-1)i,t+ β4 (Sizet-1)i,t + ɛi,t (1) where:
Levi,t = leverage on firm i in year t
(market)t = market conditions in year t, described by a dummy variable, which is the number one (1) if the market condition in year t is more than 50 percent of the monthly average market to book ratio in year t above the monthly moving average market to book ratio in year t. Zero (0) if the market condition in year t is more than 50 percent of the monthly average market to book ratio in year t below the monthly moving average market to book ratio in year t.
(levt-1)i,t = leveraget-1 firm i in year t (Proft-1)i,t = profitabilityt-1 firm i in year t (Sizet-1)i,t = sizet-1 firm i in year t
b. The Second Model
(Levt)i = β0 + β1 (Markett)i + β2 (Levt-1)i + β3 (Proft-1)i + β4 (Sizet-1)i + ɛi (2) where:
(Markett) i = the current market conditions to go public or do an IPO of shares in firm i, is described by a dummy variable, which is the number one (1) if the company i goes public during hot months of the market and the number zero (0) if firm i goes public during cold months of the market
(Levt-1)i = leverage before the IPO shares (pre-IPO) in firm i
(Proft-1)i = profitability before the IPO shares (pre-IPO) in firm i
(Sizet-1)i = the size of the company before the IPO shares (pre-IPO).
2. Measuring Research Variables
a.
Dependent VariablesBaker and Wurgler (2002) and Alti (2006) defined the level of leverage as the ratio of the book value of debt to the total assets as follows.
Lev = Debts / Assets (2)
Debts represent the total debt that consists of long-term debt and short-term debt. Assets are the total asset of the company based on the book value.
b.
Independent Variables - MarketMarket timing will be tested in hot market and cold market conditions. Hot and cold markets are defined on the basis of the monthly market to book ratio. A hot market is a market in a condition where the average market to book ratio during a certain month is above the moving average market to book ratio of that month. A cold market is when the average market to book ratio is below the moving average market to book ratio during a certain month.
In the first model, this variable was de-scribed by a dummy variable, which was the number one (1) if the market condition in year t was more than 50 percent of the monthly average market to book ratio in year t above the monthly moving average market to book ratio in year t. Zero (0) if
the market condition in year t was more than 50 percent of the monthly average market to book ratio in year t below the monthly moving average market to book ra-tio in year t.
In the second model, this variable was de-scribed by a dummy variable, which was the number one (1) if company i went pub-lic during the hot months of the market and the number zero (0) if firm i went public during the cold months of the market. - Leveraget-1 (Levt-1)
Leveraget-1 was calculated by dividing the total debtt-1 to total assetst-1.
Formulated as follows:
(Levt-1) = (Debtt-1) / (Assetst-1) (3)
Levt-1 variable was used to test the persis-tency of the leverage policy.
c.
Variable Control -Profitabilityt-1According to Titman and Wessels (1988) profitability is defined as the operating in-come divided by the total assets.
(Proft-1) = (OIt-1) / (Assetst-1) (4)
Proft-1 was used to test the pecking order theory
-Sizet-1
According to Baker and Wurgler (2002) and Alti (2006) size is defined as the logarithm of net sales (net sales).
(Sizet-1) = (logarithm net salest-1)
= (log net salest-1) (5)
In this study, the inflation rate of net sales has been adjusted using the GDP deflator with a base year of 2000. Size was used to test the trade off theory.
3. Determination of the Conditions of Hot
and Cold Markets
-
Firstly, by seeking the average value of the monthly market to book ratio of non-financial companies listed on the Indonesian Stock Exchange from 2002-2013 (first sample model of 77 companies).-
Secondly, by seeking the value of the monthly moving average market to book ratio (with a size window of twelve months).-
Thirdly, by determining the monthly marketconditions during the period from 2003-2013. Hot months occurred in the market when the average market to book ratio of a month was above the moving average market book ratio of a month and cold months were if the average market to book ratio of a month was below the moving average market value to book ratio of a month.
RESULTS AND DISCUSSION
1. Analysis of Hot and Cold Markets
Figure 1 below shows the conditions of hot and cold market (monthly) during the study.
In the first model, the independent variable was the market condition in year t (markett), de-scribed by a dummy variable. Number one (1) if it was more than 50 percent of the value of monthly average market to book ratio in year t above the value of the monthly moving average market to book ratio in year t. Zero (0) if more
than 50 percent of the value of monthly average market to book ratio in year t was below the val-ue of the monthly moving average market to book ratio in year t. Therefore, the market condi-tions of non-financial companies in Indonesia each year during the study period (2003-2013) can be seen in detail in the appendix, and are summarized in the table 1.
Based on Table 1, we can see the market conditions during our study period from 2003-2013. The cold markets occurred in 2003, 2005, 2006, 2008, 2011, 2012, and 2013, and hot mar-kets occurred in 2004, 2007, 2009, and 2010.
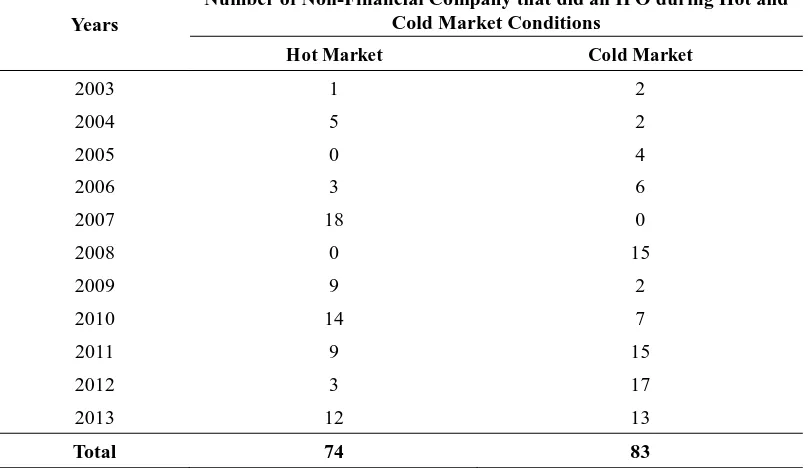
In the second model, the independent varia-ble was the current market conditions to go pub-lic or hold an IPO of shares in firm i (markett)i, which was also described by a dummy variable. Number one (1) if the company i went public when the market condition was a hot market and the number zero (0) if firm i went public when the market was a cold market. The table below shows the number of non-financial companies that went public or did an IPO during hot and cold market conditions.
Based on Table 2, we can see, that there were 74 non-financial companies that held their IPO during a hot market condition (from 2003-2013), and 83 non-financial companies which did their IPO while in a cold market condition (from 2003-2013).
Table 1. Market Condition during Study Period
Years Market Conditions
2003 Cold
2004 Hot
2005 Cold
2006 Cold
2007 Hot
2008 Cold
2009 Hot
2010 Hot
2011 Cold
2012 Cold
2013 Cold
Table 2. Number of Non-Financial Companies that did an IPO during Hot and Cold
Mar-ket Conditions
Years
Number of Non-Financial Company that did an IPO during Hot and Cold Market Conditions
Hot Market Cold Market
2003 1 2
2004 5 2
2005 0 4
2006 3 6
2007 18 0
2008 0 15
2009 9 2
2010 14 7
2011 9 15
2012 3 17
2013 12 13
Total 74 83
2. Analysis of The Research Results
The data from this research were processed using Eview 7.0. and Tables 3 and 4 show the results.
So, the equation of the first model (1) is :
Levi,t = 0,2243 - 0,0139 (market)t +
0,6929 (Levt-1)i,t -0,333 (Proft-1)i,t – 0,0023 (Sizet-1)i,t + ɛi,t (6)
So, the equation of the second model (2) is :
(Levt)i = -0,4739– 0,0078 (markett)i+ 0,4659 (Levt-1)i – 0,3193 (Proft-1)i + 0,0592 (Sizet-1)i + ɛt (7)
Table 3. The Results of the First Model (1)
Variable Coefficient Std. Error t-Statistic Prob.
Market -0,0139 0,0048 -2,895 0,0039
Leveraget-1 0,6929 0,0242 28,676 0,0000
Profitabilityt-1 -0,333 0,0559 -5,9611 0,0000
Sizet-1 -0,0023 0,008 -0,2932 0,7694
C 0,2243 0,091 2,4638 0,0140
R-squared 0,9059
Table 4. The Results of the Second Model (2)
Variable Coefficient Std. Error t-Statistic Prob.
Market -0,0078 0,0259 -0,3009 0,7639
Leveraget-1 0,4659 0,09 5,1721 0,0000
Profitabilityt-1 -0,3193 0,144 -2,2171 0,0281
Sizet-1 0,0592 0,0236 2,5052 0,0133
C -0,4739 0,2344 -2,0224 0,0449
R-squared 0,4029
Source of the data in Tables 3 and 4: Indonesian Stock Exchange; OSIRIS; and the Indonesian Capital Market Directory 2002-2013 (the primary data were processed by using Eviews 7.0 in 2014).
Table 5. Research Results: The Effect of the Independent Variable on the Dependent Variable
Var. Dependent
Var. Independent
The First Model The Second Model
Leveraget on non-financial companies
listed on the Stock Exchange
Leveraget on non-financial companies
that held IPOs in Indonesia
Market Conditions (hot and cold market)
Significant (-)
t statistic = -2,895 > t table = -2,015 and ρ
value market = 0,0039 < α = 5% (H1 is
supported).
Not Significant
t statistic = -0,3009 < t table = -2,015 and ρ
value market = 0,7639 > α = 5% (H5 is
not supported).
Persistence of Leverage Policy
Not Significant
t statistic = 28,676 > t table = 2,015 and ρ
value levt-1 = 0,00 < α = 5%. But the
coefficient of levt-1 is not equal or close
to 1 (H2 is not supported).
Not Significant
t statistic = 5,1721 > t table = 2,015 and ρ
value levt-1 = 0,0 < α = 5%. But the
coefficient of levt-1 is not equal or close
to 1 (H6 is not supported).
Proft-1
Significant (-)
t statistic = -5,9612 > t table = -2,015 and ρ
value proft-1 = 0,0000 < α = 5% (H3 is
supported).
Significant (-)
t statistic = -2,2171 > t table = -2,015 and ρ
value proft-1 = 0,0281 < α = 5% (H7 is
supported).
Sizet-1
Not Significant
t statistic = -0,2932 < t table = -2,015 and ρ
value sizet-1 = 0,7694 > α = 5% (H4 is not
supported).
Significant (+)
t statistic = 2,5052 > t table = 2,015 and ρ
value market = 0,0133 < α = 5% (H8 is
supported).
Description:
t in first model means in year t
Economic agents have perceived mispricing motives as being irrational. It causes mispricing (share prices overvalued or undervalued) in shares of the companies from time to time. This is because the capital market in Indonesia is in-efficient. Economic agents can earn abnormal returns by using irrelevant information. Non-financial corporate managers take advantage of mispricing in Indonesian markets to determine their funding structure. This can be seen in Table 3 above, the market conditions (hot and cold markets) have affected the leverage of the non-financial companies that were listed on the Indo-nesian Stock Exchange (H1 is supported). The companies publishing the equity looked for whether the market was in a hot or cold condi-tion (market timing occurred in Indonesia, espe-cially in the non-financial companies that were listed on the Indonesian Stock Exchange). Finan-cial managers utilized the mispricing of the stock to establish their optimal capital structure policy. The non-financial companies that were listed on the Indonesian Stock Exchange did not persis-tently apply a leverage policy (H2 is not sup-ported). Profitabilityt-1 had significant effects on leveraget on non-financial companies listed on the stock exchange (H3 is supported). The rela-tionship between profitabilityt-1 and leveraget was negative. The companies that had great profitability tended to use internal sources of funding rather than external sources (such as debt) because the costs of information asymme-try on internal funding were lower than the costs of information asymmetry for external funding (this supports the pecking order theory). Sizet-1 had no effect on the leveraget of non-financial companies that were listed on the Indonesian Stock Exchange (H4 is not supported). The size of the non-financial companies that were listed on the Indonesian Stock Exchange did not affect the leverage ratio in the following year. There-model, R-squared (R2)was 0,9059, which means the leveraget of the non-financial companies that were listed on the Indonesian Stock Exchange could be explained by the model at 90,59 percent
and the remainder of it could be explained by other variables outside of the model, at 9,41 per-cent.
Market conditions (hot and cold markets) had no effect on the leverage of the non-financial companies that did their IPOs in Indonesia (H5 is not supported). Finance managers at the non-financial companies in Indonesia did not pay attention to the IPO market conditions (market timing did not occur in Indonesia, particularly in non-financial companies that did IPOs in Indo-nesia). The non-financial companies that did IP-Os in Indonesia did not persistently apply lever-age policies (H6 is not supported). Corporate did IPOs in Indonesia (H7 is supported). The re-lationship between the two variables was nega-tive. If the profitability of the company before an IPO was high, the leverage of the company after the IPO fell, because the manager chose an in-ternal funding source for the profitability of the company, because that had a lower information asymmetry cost than issuing debt. If the profita-bility of the company before an IPO was low, the leverage of the company after its IPO would rise because internal capital resources were not sufficient to meet the financing needs of the company (which supports the pecking order the-ory).
in Indonesia after the IPO would be small (sup-ports the trade-off theory).
Based the on regression result of the second model, R-squared (R2)was 0,4029. It means the leveraget of the non-financial companies that were listed on the Indonesian Stock Exchange could be explained by the model at 40,29 percent and the remainder of it could be explained by other variables outside of the model at 59,71 per-cent.
CONCLUSION
Based on the analysis of the results of the first model, it could be concluded that the market conditions (hot and cold markets) affected the leverage of the non-financial companies that were listed on the Indonesian Stock Exchange. However, based on the analysis of the result of the second model, it could be concluded that market conditions (hot and cold markets) did not affect the leverage of the non-financial compa-nies that did their IPOs in Indonesia. This means that the non-financial firms in Indonesia issuing equity considered the market conditions (a hot or cold market). Yet, the non-financial firms in In-donesia which issued equity did not consider the market conditions (hot or cold market) when issuing equity the first time (IPO). In addition, the capital structure of the companies in Indone-sia changed due to the influence of the variable size and profitability of the company.
The non-financial companies that were listed on the Indonesian Stock Exchange and the non-financial companies that did IPOs in Indonesia did not apply persistent leverage policies. This means that the leverage of the non-financial companies in Indonesia in year t-1 and the leve-rage of the non-financial companies before their IPO were not equal with the leverage of the non-financial companies in Indonesia in year t and the leverage of the non-financial companies after their IPO. This could mean a change in the capi-tal structure policy of the non-financial compa-nies in Indonesia. The changes in capital struc-ture policies were not only caused by the market conditions (hot and cold markets) when issuing equity, but also caused by the variable profitabil-ity and size of the companies.
REFERENCES
Alti, A. (2006) How Persistent Is The Impact of Market Timing on Capital Structure?. Journal of Finance, 61 (4): 1681-1710 Barker, M. and Wurgler, J. (2002) Market
Timing and Capital Structure. Journal of Finance, 57 (1): 1-32
Brealey, R.A., Myers, S.C., and Marcus, A. J. (2011). Principles of Corporate Finance 10/e. New York: McGraw-Hill
Gujarati, D. (2003) Basic Econometrics Fourth Edition. New York: McGraw-Hill
Hanafi, M.M. (2008) Manajemen Keuangan Edisi Pertama. Yogyakarta: BPFE
Muhsinin, N. (2011) Analisis Pengaruh Market Timing Terhadap Kebijakan Leverage Perusahaan. Skripsi Jurusan Manajemen Universitas Gadjah Mada
Hovakimian, A. (2006) Are Observed Capital Structures Determined by Equity Market Timing?. Journal of Financial and Quanti-tative Analyisis, 41 (1): 221-243
Jansen, M. and Meckling, W. (1976) Theory of the Firm: Managerial Behavior, Agency Costs and Ownership Structure. Journal of Financial Economics, 3 (4): 305-360
Kennedy. (2003) A Guide to Econometrics Fifth Edition. Blackwell Publishing Victoria Saad, M. and Siagian, H. (2011) Sentimen
Investor, Kendala Keuangan, dan Equity Market Timing. Finance and Banking Journal,
13 (1):1-15
Sartono, A. (2008). Manajemen Keuangan Teori dan Aplikasi Edisi Keempat. Yogyakarta: BPFE
Sekaran U., and Bougie R. (2010) Research Method for Business: A Skill Building Ap-proach Fifth Edition. John Wiley and Sons Titman, S. and R, Wessels. (1988) The
Determi-nants of Capital Structure Choice. Journal of Finance, 43 (1): 1-19
APPENDIX
Market Condition during the Study Period
Months
Moving Average
MTB Moving Average MTB (Monthly) Market Condition (Monthly)
Market Condition
(Monthly) (Size Window = 12 Month) In Year t
Jan-03 2.4304 10.7148 Cold Market
Cold Market
Feb-03 2.4139 9.6141 Cold Market
Mar-03 2.0747 8.6561 Cold Market
Apr-03 2.7967 7.4895 Cold Market
May-03 3.4622 6.5574 Cold Market
Jun-03 3.4651 5.7197 Cold Market
Jul-03 3.4442 5.0608 Cold Market
Aug-03 3.5304 4.4977 Cold Market
Sep-03 3.6518 4.1259 Cold Market
Oct-03 3.6277 3.8452 Cold Market
Nov-03 3.5477 3.4676 Hot Market
Dec-03 3.7167 3.1801 Hot Market
Jan-04 9.3961 3.7606 Hot Market
Hot Market
Feb-04 7.4313 4.1787 Hot Market
Mar-04 7.1296 4.6000 Hot Market
Apr-04 6.4078 4.9009 Hot Market
May-04 6.2123 5.1301 Hot Market
Jun-04 6.7850 5.4067 Hot Market
Jul-04 7.4790 5.7430 Hot Market
Aug-04 6.6477 6.0027 Hot Market
Sep-04 5.3168 6.1415 Cold Market
Oct-04 6.0294 6.3416 Cold Market
Nov-04 6.0993 6.5542 Cold Market
Dec-04 6.0784 6.7511 Cold Market
Jan-05 1.2148 6.0693 Cold Market
Cold Market
Feb-05 1.2870 5.5573 Cold Market
Mar-05 1.2960 5.0711 Cold Market
Apr-05 1.2419 4.6406 Cold Market
May-05 1.2060 4.2234 Cold Market
Jun-05 1.2188 3.7596 Cold Market
Jul-05 1.2435 3.2400 Cold Market
Aug-05 1.0808 2.7761 Cold Market
Sep-05 1.1540 2.4292 Cold Market
Oct-05 1.1000 2.0184 Cold Market
Nov-05 1.1220 1.6036 Cold Market
Dec-05 1.0875 1.1877 Cold Market
Jan-06 0.8463 1.1570 Cold Market
Cold Market
Feb-06 0.8316 1.1190 Cold Market
Mar-06 0.9003 1.0861 Cold Market
Apr-06 0.9528 1.0620 Cold Market
May-06 0.8912 1.0357 Cold Market
Jun-06 0.8593 1.0058 Cold Market
Jul-06 0.8891 0.9762 Cold Market
Aug-06 0.9171 0.9626 Cold Market
Sep-06 0.9427 0.9450 Cold Market
Nov-06 1.0289 0.9257 Hot Market
Dec-06 1.1255 0.9288 Hot Market
Jan-07 1.3170 0.9681 Hot Market
Hot Market
Feb-07 1.3703 1.0130 Hot Market
Mar-07 1.4372 1.0577 Hot Market
Apr-07 1.8260 1.1305 Hot Market
May-07 2.0882 1.2302 Hot Market
Jun-07 2.4987 1.3668 Hot Market
Jul-07 3.7438 1.6047 Hot Market
Aug-07 2.7196 1.7549 Hot Market
Sep-07 3.6867 1.9836 Hot Market
Oct-07 3.6173 2.2049 Hot Market
Nov-07 4.2837 2.4762 Hot Market
Dec-07 4.2376 2.7355 Hot Market
Jan-08 0.7718 2.6901 Cold Market
Cold Market
Feb-08 0.9099 2.6517 Cold Market
Mar-08 1.2097 2.6327 Cold Market
Apr-08 1.0349 2.5668 Cold Market
May-08 1.3341 2.5040 Cold Market
Jun-08 1.6938 2.4369 Cold Market
Jul-08 1.7345 2.2695 Cold Market
Aug-08 1.5998 2.1761 Cold Market
Sep-08 1.3996 1.9855 Cold Market
Oct-08 1.2363 1.7871 Cold Market
Nov-08 1.3082 1.5392 Cold Market
Dec-08 1.1968 1.2858 Cold Market
Jan-09 1.2207 1.3232 Cold Market
Hot Market
Feb-09 1.2034 1.3476 Cold Market
Mar-09 1.2202 1.3485 Cold Market
Apr-09 1.2868 1.3695 Cold Market
May-09 1.5100 1.3842 Hot Market
Jun-09 1.7150 1.3859 Hot Market
Jul-09 1.9645 1.4051 Hot Market
Aug-09 2.3279 1.4658 Hot Market
Sep-09 2.1738 1.5303 Hot Market
Oct-09 2.1912 1.6099 Hot Market
Nov-09 2.0186 1.6691 Hot Market
Dec-09 2.2656 1.7581 Hot Market
Jan-10 2.3133 1.8492 Hot Market
Hot Market
Feb-10 2.3344 1.9435 Hot Market
Mar-10 2.0919 2.0161 Hot Market
Apr-10 2.1837 2.0908 Hot Market
May-10 1.8405 2.1184 Cold Market
Jun-10 2.0349 2.1450 Cold Market
Jul-10 2.0673 2.1536 Cold Market
Aug-10 1.9119 2.1189 Cold Market
Sep-10 2.4910 2.1454 Hot Market
Oct-10 2.4769 2.1692 Hot Market
Nov-10 2.6040 2.2180 Hot Market
Dec-10 2.8376 2.2656 Hot Market
Jan-11 1.9200 2.2328 Cold Market
Cold Market
Feb-11 2.0090 2.2057 Cold Market
Apr-11 2.1628 2.2013 Cold Market
May-11 2.1974 2.2310 Cold Market
Jun-11 2.0844 2.2351 Cold Market
Jul-11 2.2716 2.2521 Hot Market
Aug-11 2.0666 2.2650 Cold Market
Sep-11 1.9306 2.2183 Cold Market
Oct-11 2.0324 2.1813 Cold Market
Nov-11 2.0815 2.1377 Cold Market
Dec-11 2.1102 2.0771 Hot Market
Jan-12 2.4427 2.1207 Hot Market
Cold Market
Feb-12 2.4995 2.1616 Hot Market
Mar-12 2.6349 2.2095 Hot Market
Apr-12 2.3156 2.2223 Hot Market
May-12 2.1148 2.2154 Cold Market
Jun-12 2.0536 2.2128 Cold Market
Jul-12 2.0812 2.1970 Cold Market
Aug-12 2.0177 2.1929 Cold Market
Sep-12 2.1589 2.2119 Cold Market
Oct-12 2.1690 2.2233 Cold Market
Nov-12 2.1922 2.2325 Cold Market
Dec-12 2.1410 2.2351 Cold Market
Jan-13 2.0915 2.2058 Cold Market
Cold Market
Feb-13 2.2422 2.1844 Hot Market
Mar-13 2.4173 2.1663 Hot Market
Apr-13 2.2649 2.1620 Hot Market
May-13 2.2966 2.1772 Hot Market
Jun-13 2.2396 2.1927 Hot Market
Jul-13 2.1160 2.1956 Cold Market
Aug-13 1.9830 2.1927 Cold Market
Sep-13 2.0402 2.1828 Cold Market
Oct-13 2.0761 2.1751 Cold Market
Nov-13 2.2444 2.1794 Hot Market