Water security in Amazonia
A report for the Amazonia Security Agenda Project
February 2013
amazoniasecurity.org
Mark Mulligan
1, Jorge Rubiano
12, Sophia Burke
3and Arnout van Soesbergen
11
Department of Geography, King’s College London
3
AmbioTEK Community Interest Company, UK
Water Security in Amazonia was produced for this project by Mark Mulligan
1, Jorge
Rubiano
12, Sophia Burke
3and Arnout van Soesbergen
1of the
1Department of
Geography, King’s College London,
2Department of Geography, Universidad del
Valle, Colombia and
3AmbioTEK Community Interest Company, UK.
Suggested citation:
MULLIGAN, M., RUBIANO, J.R., BURKE, S. & VAN SOESBERGEN, A. (2013)
Water Security in Amazonia. Report for Global Canopy Programme and
International Center for Tropical Agriculture as part of the Amazonia Security
Agenda project.
This report was conducted by the International Center for Tropical Agriculture
(CIAT) and the Global Canopy Programme (GCP) for the Amazonia Security
Agenda. This report was supported with funds from the Climate and Development
Knowledge Network (CDKN) and Fundación Futuro Latinoamericano (FFLA).
Contents
List of figures ... 5
List of tables ... 6
Purpose ... 7
The interactions between Amazonian ecosystem services and water security ... 7
Some definitions: Ecosystem services ... 7
Some definitions: Environmental vs. Ecosystem Services ... 7
Some definitions: Water security: ... 8
Relationships between ES and water security ... 9
The existing threats to water security ... 10
The baseline hydrology of the Amazon ... 10
Population across the Amazon ... 10
Poverty across the Amazon ... 11
Baseline water balance ... 12
Baseline water quality ... 15
The land cover and use threats ... 17
Current pressures vs. future threats ... 17
Protected areas ... 20
The impacts of key threats on water security ... 21
The mechanisms of land use change impacts on water security ... 21
Land-use and climate feedback mechanisms ... 22
Modelling studies on the impacts of land use change ... 23
Data-based studies on impacts of land use change ... 24
Agricultural Land management ... 26
Extractives - mining and oil and gas ... 26
Hydropower ... 27
Population ... 27
Water treatment, supply and sanitation ... 28
Modelling the impacts of land use change on the water security future of the Amazon . 29 The role of climate change in exacerbating these threats and generating new threats to water security ... 35
The climatic threats ... 35
The impact of climate variability: ... 35
Climate change scenarios for the Amazon ... 35
Gradual change vs. abrupt events ... 36
The impacts on water security ... 37
Water quantity ... 37
Water quality ... 40
Flow regulation and seasonality ... 42
Climate-induced wildcards ... 43
Migration ... 43
Agricultural change ... 43
Interactions with other securities ... 44
Health ... 44
Energy ... 44
Food ... 44
Climate change and Brazil’s global food basket ... 45
Case studies illustrating threats to water security in the Amazon ... 45
1: The status of dams in the Amazon and their downstream impact ... 45
2: The water security impacts of the Amazon droughts of 2005 and 2010 ... 47
3: Major changes in land use and their impacts ... 48
4: Mining and oil and gas development. ... 49
5: Infrastructural threats to water quality in the Amazon ... 53
The impacts of water security across different populations ... 54
Rural settlers ... 55
Institutional weakness ... Error! Bookmark not defined. The potential policy options to mitigate or exacerbate the impacts of security threats on water security ... 60
Water security hotspots ... 60
Climate change ... 60
Land use and cover change ... 61
Common myths and their corresponding realities ... 62
Key climate change impacts ... 62
Snow and ice ... 62
Implications for policy ... 64
Managing extreme events ... 64
Water supply and sanitation infrastructure planning ... 65
Agrarian Reform ... 65
List of figures
Figure 1 Population by major sub-basin ... 11
Figure 2 Percent of population considered poor (<$2 per day) by major sub-basin. Data source Elvidge et al. (2009) ... 12
Figure 3 Baseline water balance by major sub-basin ... 13
Figure 4 Baseline per-capita water balance by local administrative region (Mm3/person). . 14
Figure 5 Baseline water stress index by major sub-basin ... 15
Figure 6 Baseline water quality (HF) index (%) by local administrative region. ... 16
Figure 7 Baseline number of people with poor quality drinking water by local administrative region ... 17
Figure 8 Current pressure index according to Co$ting Nature ... 18
Figure 9 Current pressure index according to Co$ting Nature, mean by country ... 18
Figure 10 Future threat index according to Co$ting Nature. ... 19
Figure 11 Future threat index according to Co$ting Nature, by country ... 19
Figure 12 Protected area coverage by major sub-basin ... 20
Figure 13 Protected area coverage by country ... 21
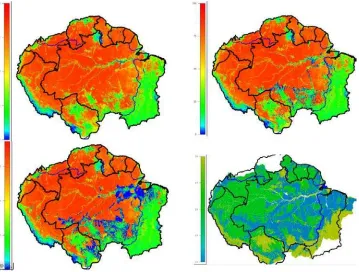
Figure 14 Tree cover (%) for top left : baseline (2000), top right: LUC (2050) and bottom left: ACCEL (2050) scenarios. ... 30
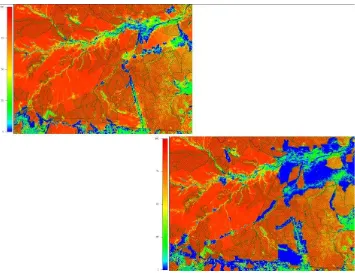
Figure 15 Tree cover (%) for top left: LUC (2050) and bottom right: ACCEL (2050) scenarios for Rondonia in relation to protected areas (WDPA, 2012) ... 31
Figure 16 Change in tree cover resulting from continued deforestation at current rates for a further 40 years (LUC), by major sub-basin ... 32
Figure 17 Change in tree cover resulting from continued deforestation at quadrupled current rates for a further 40 years (ACCEL), by major sub-basin ... 32
Figure 18 Change in water stress index resulting from continued deforestation at current rates for a further 40 years (LUC), by major sub-basin ... 32
Figure 19 Change in water stress index resulting from continued deforestation at quadrupled current rates for a further 40 years (ACCEL), by major sub-basin ... 33
Figure 20 Change in HF pollution index resulting from continued deforestation at current rates for a further 40 years (LUC), by major sub-basin ... 33
Figure 21 Change in HF pollution index resulting from continued deforestation at quadrupled current rates for a further 40 years (ACCEL), by major sub-basin. ... 34
Figure 22 Change in persons per km2 with poor water quality resulting from continued deforestation at current rates for a further 40 years (LUC), by major sub-basin ... 34
Figure 23 Change in persons with poor water quality resulting from continued deforestation at quadrupled current rates for a further 40 years (ACCEL), by major sub-basin ... 34
Figure 24 Change in rainfall with AR4 A2 mean of all (20) models 2050s ... 38
Figure 25 Change in rainfall with AR4 A2 mean of all (20) models minus one sd 2050s ... 38
Figure 26 Change in rainfall with AR4 A2 mean of all (20) models 2080s ... 38
... 40
Figure 29 Change in water stress with AR4 A2 mean of all (20) models 2080s ... 40
Figure 30 Change in human footprint on water with AR4 A2 mean of all (20) models 2050s ... 41
Figure 31 Change in human footprint on water with AR4 A2 mean of all minus one standard deviation (20) models 2050s ... 42
Figure 32 Change in human footprint on water with AR4 A2 mean of all (20) models 2080s ... 42
Figure 33 Estimate of flood affected populations summed by major sub-basin. ... 43
Figure 34 Current large dams by major sub-basin. ... 47
Figure 35 Current and planned large dams by major sub-basin. ... 47
Figure 36 Per-cent of major sub-basin converted during the period 2004-2012 according to terra-i ... 49
Figure 37 Number of current large mines by major sub-basin. ... 51
Figure 38 Fractional coverage of mining concessions by major sub-basin ... 51
Figure 39 Number of current oil wells by major sub-basin ... 52
Figure 40 Fractional coverage of oil and gas concessions by major sub-basin ... 52
Figure 41 Pixel-scale (left) and sub-basin scale (right) increase in HF pollution index resulting from operationalisation of 1% of oil and gas concessions. ... 52
Figure 42 Pixel-scale (left) and sub-basin scale (right) increase in HF pollution index resulting from operationalisation of 10% of mining concessions. ... 53
Figure 43 Planned roads by major sub-basin. ... 54
Figure 44 Sensitivity of water balance to rainfall change (mm/mm), at sub-basin scale ... 61
Figure 45 Sensitivity of water stress index to rainfall change (%/mm) at sub-basin scale .. 61
Figure 46 Sensitivity of water stress index to change in tree cover (%/%) associated with conversion to pasture ... 62
Figure 47 The contribution of annual total snowmelt to water balance (% of water balance) at the pixel scale (left) and the sub-basin scale (right) for southern Peru. ... 63
Figure 48 The change in contribution of snowmelt to water balance between baseline and A2 mean of all GCMs 2040s (% of water balance) at the pixel scale (left) and the sub-basin scale (right) for southern Peru. ... 63
List of tables
Table 1 Links between services and water security ... 9Table 2 Population by country in the greater Amazon. Source: GPW (2000) *UNEP and ACTO, 2009. ... 55
Table 3 Water demand for agriculture Sources: Goulding et al (2003), INRENA (2006),SUPELANO (2006) USACE (2001) ... 57
Purpose
This report will assess the scientific evidence-base for water security risks in the Amazon and the role of climate change as a threat multiplier. We will do this by examining the interactions between the land use and climate controls on supply of hydrological ecosystem services in the Amazon and the impact upon water security in the region. We will identify the existing water related conflicts between countries of the Amazon and examine which of these may be impacted by climate change. Further, we will examine the socio-economic opportunities arising out of water security in the region and will indicate the role of ecosystems and the hydrological services that they supply in ensuring that these opportunities can be sustainably realised.
The interactions between Amazonian ecosystem services
and water security
Some definitions: Ecosystem services
Ecosystem services are the supply of benefits to humans resulting from the operation of ecosystem processes. These benefits may accrue to all humans (for example climate mitigation services) or a subset of beneficiaries that receive a local service (for example those downstream of ecosystems providing hydrological services such as flow regulation). An ecosystem service (ES) is not a ‘service’ at all until it is utilised and thus any discussion or quantification of ES involves: (a) the quantification of the source of ecosystem attributes that will later become services, (b) understanding the distribution of beneficiaries (both local and distant) and (c) assessing the delivery of these attributes to the beneficiaries (Mulligan et al., 2010). For water as a service the first beneficiary may be the agricultural producer and their employees who gain livelihood from growing crops with that water but these crops continue to make profits along the supply chain from distributor/exporter through to the supermarket that sells them on to consumers. The profits made along the supply chain are often higher than those made by the original producer and the whole supply chain is sustained by the ES provided to the farmer. So, one of the first decisions we need to make in quantifying ES is who are the beneficiaries we are targeting and how far do they extend beyond the basin.
Some definitions: Environmental vs. Ecosystem Services
One should distinguish between those services that are provided by the environment (environmental services per se, EnS) and those that are a function of the ecosystem
processes and thus produce a lot of water. This environmental service is independent of the ecosystem that might occur on the mountain range in question (which has little effect on the mountain climate). The same mountain ranges might also supply specific ecosystem services such as the contribution to water resources of fog stripping by tropical montane cloud forests. This ecosystem service is a function of the cloud forest ecosystem and is significantly reduced when cloud forest is converted to pasture, whereas the aforementioned environmental service is unaffected. This cloud forest effect, like many hydrological ES, is highly scale-dependent and significant locally but becomes insignificant further downstream as the proportion of the catchment that is made up of cloud forest diminishes.
There tends to be a spatial autocorrelation between areas of high ecosystem service provision (especially for carbon and water) and areas of high biodiversity but this is likely because the same climatic and terrain drivers of ecosystem service provision also have a role to play in the generation and maintenance of biodiversity rather than because biodiversity itself controls these ecosystem services. It is thus important to recognise the real biophysical mechanisms of ES provision rather than make assumptions connecting ES provision to particular land use classes or areas of high biodiversity. Here we will use the MEA (2005) classification of ecosystem services into provisioning, regulating and
supporting services.
Some definitions: Water security
Narrowly defined, water security is the capacity of a population to ensure sustained access to water and clearly involves issues of water availability in the environment but also of socio-economic access to water. More broadly, the term water security also incorporates safeguarding against water related hazards such as floods and droughts. Water security has a fundamental basis in natural capital and the provision of ecosystem services so that we can define the following elements of water security alongside their basis in ecosystem services:
a. Mean (quantity and quality) of water supply vs. demand (provisioning services)
b. Risks to supply (such as unusual seasonal, inter-annual or long term variability or extreme events including floods, droughts and landslides) (atmospheric and terrestrial regulating services)
Socio-economic factors that affect the demand for services and the equality of access to them are also critical:
c. Risks to demand (progressive increases in demand associated with
result from environmental migration, conflict or rapid infrastructural and/or agricultural development)
d. Access to and sharing of water (infrastructure, socioeconomic conditions, poverty, rights)
Water security is trans-boundary in nature since water demand and contamination in upstream regions and countries can impact significantly on supply in downstream areas. Moreover, large-scale land use change downstream can destabilize regional climates with a resulting impact on rainfall (and thus water security) upstream. Water security
fundamentally underpins securities for health (through water quality), energy (through hydropower and biofuels) and food (through irrigation and crop ’green’ water use).
Relationships between ES and water security
At the scale of the Amazon basin, climate is considered an ecosystem service here since land use change at this scale has the potential to affect climate at the basin scale and thus land use-induced climate change is manageable by policies at the basin scale. It may not be so at the national scale, especially for the Andean countries whose climates may be affected by large scale land use change in downstream Brazil. Greenhouse induced climate change cannot be managed in the Amazon alone so it is considered an environmental service here. Environmental and ecosystem services underpin the elements of water security as shown in Table 1. There is no single service that is more important for water security than others: the services vary in importance from site to site.
Services Water security
Environmental services
Global climate regulation Underpins mean water provision and risks to supply
Ecosystem services (function of natural capital)
Regional climate regulation Underpins mean water provision and risks to supply
Hydrological provisioning services Underpins mean water provision Hydrological regulating Underpins risks to supply in the dry
season
Agricultural provisioning services Underpinned by hydrological ecosystem services
Biodiversity and cultural/aesthetic services Spatially correlated with climate and thus hydrological ecosystem services
The existing threats to water security
The Amazon River system is the single, largest source of freshwater on Earth and its flow regime is relatively un-impacted by human activity compared with many large basins. It is, however, subject to inter-annual and long-term variability in tropical precipitation and resulting large variations in downstream flow conditions. The Amazon drains an area of 6.2
× 106 km2 and discharges an average of 6,300 km3 of water to the Atlantic ocean annually -
equivalent to 15-20% of global freshwater that flows into the oceans (Foley, 2002; Marengo, 2006; Tomasella et al., 2011). Interdependencies of water resources with other ecological and social systems exist at all spatial and temporal scales and are driven, for example, by proximal drivers such as land-use, water withdrawals, pollution, eutrophication and anthropogenic climate disruption. The underlying distal drivers of these proximal drivers include population growth, economic development and globalization as well as changes in consumption patterns, including diets (Hoff, 2009).
The baseline hydrology of the Amazon
In order to understand threats to water security we must first understand the baseline distribution of water and water security in the basin. The Amazon has a unique socio-cultural context being characterized by low population densities, few urban centres and relatively low levels of poverty. Despite the low population density, widespread human impacts on the Amazon have occurred and these even have global implications. Over the last few decades, 84 million ha of natural ecosystems have been lost in the basin (Malhi et al. 2008). This signifies an average direct impact (land clearing) of 1.8 ha per person in the Amazon (2.4 ha per rural inhabitant) (Porro et al., 2008). Since the hydrological cycle is fundamentally dependent upon land cover and land use, there may also be consequences for water security in the region.
Population across the Amazon
According to Porro et al. (2008), the population in the Amazon was nearly 29 million in 2000 and has grown over 250% since 1960 with the greatest growth in Colombia, French Guiana1, and Venezuela (though these countries represent only 11% of the total population
of the ACTO basin). In 2000, Brazil had over half of the Amazon population, followed by Peru at 25% and Ecuador at less than 10%. In the coming 30 years (based on 1960-2000 growth rates) we can expect population in the Amazon to reach 75 million with 52% in Brazil, 28% in Peru, 6% in Ecuador and nearly 9% in Colombia. By major sub-basin (Figure 1) current population is highly concentrated in the high altitude basins of Peru, Ecuador and Bolivia, around Manaus, Amazonas, Rondonia and the basins of Para, Maranhao and Tocantins in the east. Some 6 million (21%) Amazon inhabitants are considered urban
populations, 21 million (74%) are classed as rural colonisers and just over 1 million (4%) as indigenous. Growth rates are highest amongst the rural coloniser community at 170% and 30 years from now (based on 1960-2000 rates) urban population could reach 32 million (20%), rural colonisers 126 million (77%) and indigenous 5.4 million (3%).
Figure 1: Population by major sub-basin
Poverty across the Amazon
Measures of poverty such as per-capita income, unsatisfied basic needs, human
Figure 2: Percent of population considered poor (<$2 per day) by major sub-basin. Data source Elvidge et al. (2009)
Baseline water balance
There is significant spatial variation in water balance (rainfall plus fog inputs minus transpiration) across the Amazon reflecting differences in precipitation inputs and evapo-traspiration losses. The WaterWorld model (www.policysupport.org/waterworld, Mulligan and Burke, 2005; Mulligan et al., 2010; Bruijnzeel, Mulligan and Scatena, 2011, Mulligan, 2012) is a sophisticated spatial hydrological model based on the best available global datasets for climatic inputs and models for inputs of fog and snowmelt and for outputs of actual evapo-transpiration (AET). WaterWorld (v2.5) has been applied here to understand the sub-basin level variability in water balance and indicates significant differences
Figure 3: Baseline water balance by major sub-basin
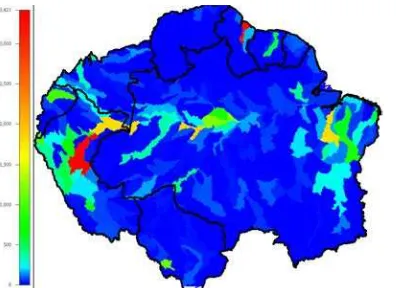
Per-capita water balances from WaterWorld (Figure 4) reinforce the existing patterns since the greatest populations are in some of the drier areas of the Amazon and the least
populations in the wetter areas. It is important to note that these volumes represent
available (blue) water, only a fraction of which may be accessible for use through
Figure 4: Baseline per-capita water balance by local administrative region (Mm3/person).
The WaterWorld water stress index calculates supply (as water balance) and demand (as population multiplied by a user-defined per-capita domestic and industrial demand, set here as 47 m3/yr) on a monthly basis. Agricultural demand is incorporated in the water
balance since the water balance includes actual evapo-transpiration from the present land use (including the effects of irrigation). The water stress index is the average % of
industrial and domestic (blue water) demand not supplied in months at which
Figure 5: Baseline water stress index by major sub-basin, % of industrial and domestic (blue water) demand not supplied in months at which supply<demand across the year
Baseline water quality
As well as water quantity, water quality is fundamental to water security since it
determines the quantity available for a particular purpose (such as irrigation, domestic use
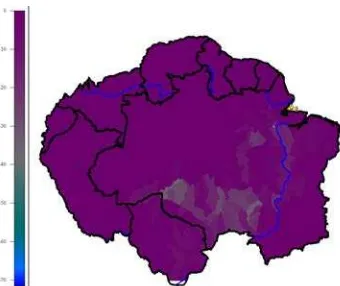
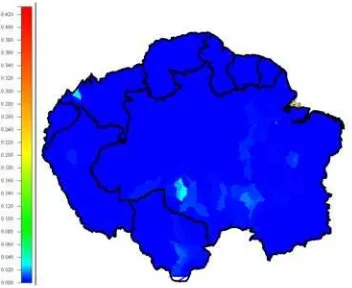
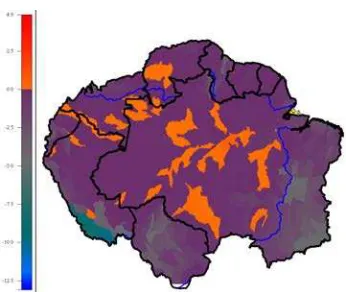
etc.). Poor quality water may be unusable for some purposes and bring with it risks of health insecurity. Water quality is very difficult to measure at policy relevant scales since it cannot be remotely sensed per se. Thus, WaterWorld uses an index of the extent to which water is affected by human activities: the so-called human footprint on water quality index (HF, Mulligan, 2009). The HF essentially assumes that if rainfall falls on land that has low human impact then it will generate clean runoff, whereas if it falls on human land uses that may form point (mines, oil wells, roads, urban) or non-point (unprotected cropland and pasture) contaminant sources then the runoff generated is not clean (i.e. has a human footprint). The HF index (%) at a point is thus the proportion of water at that point that fell as rainfall on upstream human-impacted areas and is an indicator of the potential level of contamination of water. All land covers are assumed to have the same unit impact though users can change this if there is reason to believe that particular areas of cropland for example have a higher or lower pollutant release than others. The impacts on water quality are thus the magnitude and distributions of human land uses upstream in relation to where the rainfall falls.
Colombia, Ecuador, Peru and Bolivia as well as agricultural impacts in S and E Brazil. Rainfall occurring in protected areas is assumed to have no HF and thus the patterns shown also reflect the distribution of protected land. Since most of the rainfall in the N and W Amazon falls on un-impacted land the HF index is very low for these areas.
Figure 6: Baseline water quality (HF) index (%) by local administrative region.
WaterWorld assumes by default that, for withdrawals in all urban areas, 70% of the HF is routinely removed by water treatment (at a cost) and that 70% of the 100% HF of
populations living in urban areas is removed (at a cost) through sanitation. A HF index of >50% is considered to equate to poor quality water. Rural areas are assumed by default to have no effective water treatment and sanitation, such that effluent from rural populations is considered to return to the rivers and domestic water resources are considered to be available at the HF levels provided by the rivers. WaterWorld calculates the number of people affected by post-treatment and post-sanitation, poor quality water by combining its gridded population dataset with the resulting water quality map and the 50% threshold value. Figure 7 shows a number of areas in which significant rural populations are
Figure 7: Baseline number of people with poor quality drinking water by local administrative region
The land cover and use threats
Current pressures vs. future threats
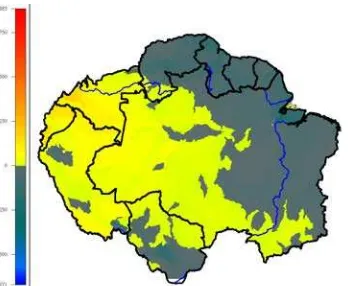
Having understood a little of the hydrological baseline for the Amazon in terms of water supply, demand and quality we will now consider the current pressures and future threats to water security in the region. The Co$ting Nature system
Figure 8: Current pressure index according to Co$ting Nature
Figure 9: Current pressure index according to Co$ting Nature, mean by country
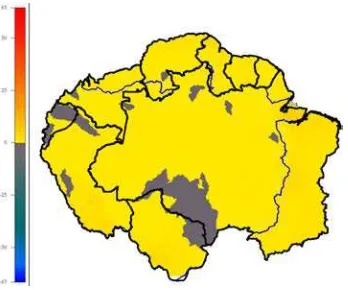
the CN threat index for the Amazon, indicating some areas of very high threat on a global scale (0.6 out of 1.0). Much of the Amazon is under considerable threat associated with proximity to current roads and urban areas, population growth and climate change. Only the Colombia/Brazil border and the countries NE of Brazil have lower threat which results largely from the lower threat of climate change in those areas.
Figure 10: Future threat index according to Co$ting Nature
Globally, as national averages, the threat index is quite different to the pressure index and indicates a threatened shift in pressure compared with the present, towards the rapidly developing countries that are currently under little pressure. In South America we see all countries except Argentina, Chile, Uruguay, Guyana, French Guiana and Suriname with very high pressure on a global scale.
Protected areas
However, the Amazon as defined here includes 35.2% coverage of current nationally and internationally protected areas according to WDPA (2012) and these protected areas occur in many of the areas with emerging threat. Deforestation between January 2004 and May 2012 according to terra-I (Reymondin et al, 2012) was lower (0.7% of land) in protected areas of the Amazon compared with 2.4% outside them. Some whole sub-basins are protected (Figure 12), including large basins in Venezuela and Brazil. If effective, these protected areas could help manage some of the threats to hydrological ecosystem services identified here. Lower coverage of protected areas is seen in densely populated eastern Brazil, Guyana, parts of Peru and Bolivia. Overall, the Amazon countries have a high level of coverage of protected areas on a global scale (Figure 13), though there are few indicators of the effectiveness of these except the deforestation rates given above and the considerable overlap between protected areas and planned roads and oil and mining concessions.
Figure 13: Protected area coverage by country
The impacts of key threats on water security
The mechanisms of land use change impacts on water security
The recycling of local evaporation and precipitation by forest is thought to account for a sizable portion of the regional water budget in the Amazon and thus there is some concern about how large-scale land surface changes may affect the water cycle in the tropics
Land-use practices can also disrupt the supply of fresh water through more localized changes in the surface water balance and the partitioning of precipitation into
evapotranspiration, runoff and groundwater flow (Marengo, 2006). For example, according to Coe et al. (2011), 55% of the Araguaia River in east-central Brazil was deforested and this has significantly altered the hydrological and morphological characteristics of this 82,632 km2 watershed. Observed discharge increased by 25% from the 1970s to the 1990s
and computer simulations suggest that about 66% of the increase is from deforestation with the remaining 33% from climate variability over the period. Changes of this type are likely occurring throughout the 2,000,000 km2 savannah region of central Brazil. Indeed,
large-scale deforestation appears to have significantly affected the Tocantins and Araguaia Rivers, where discharge has increased 25% between the 1970s and the 1990s (a period of significant deforestation in the region) with little change in precipitation over the period (Coe et al., 2009).
Land-use and climate feedback mechanisms
Under gravity, land inevitably loses water to the ocean. This water is replenished by atmospheric ocean-to-land moisture transport. Makarieva and Gorshkov (2007) used data for five terrestrial transects of the International Geosphere Biosphere Program to show that the mean distance over which air fluxes can transport moisture over non-forested areas, is less than several hundred kilometres and that precipitation decreases
exponentially with distance from the ocean. In contrast, precipitation over extensive
natural forests does not depend on the distance from the ocean. This points to the existence of an active ‘biotic pump’ transporting atmospheric moisture inland from the ocean. A novel physical principle is formulated according to which the low-level air moves from areas with weak evaporation to areas with more intensive evaporation. Due to the high leaf area index, natural forests maintain high evaporation fluxes, which support an ascending air motion over the forest and ‘draw in’ moist air from the ocean, which is the essence of the biotic pump. Though compelling, this mechanism has been widely critiqued by for example Meesters, Dolman and Bruijnzeel (2009). However, Spracklen et al. (2012) used TRMM rainfall and MODIS vegetation data combined with simulated atmospheric transport patterns, to assess the pan-tropical effect of forests on tropical rainfall, finding that air that has passed over extensive vegetation in the preceding few days produces at least twice as much rain as air that has passed over little vegetation. Using current trends of Amazon deforestation they estimate reductions of between 12 and 21 per cent in wet-season and dry-season precipitation respectively across the Amazon basin by 2050, due to less-efficient moisture recycling. This is, however, not strictly an observational study since it uses modelling at various stages in the analysis and the debate is thus very much open.
Modelling studies on the impacts of land use change
Numerous modelling studies have been developed to improve our understanding of the impacts of deforestation on the hydrology of the Amazon. These studies have varied from macro-scale (>105 km2) to meso-scale (102-105 km2) as well as one dimensional studies
using single column models (SCMs). Macro-scale models (Atmospheric GCMs) have been applied at the Amazon scale and the comparison between scenarios of baseline (current) forest cover and (usually rather extreme) deforestation scenarios are made in order to understand the role of land cover in regulating the regional and global climate. Findings with these models indicate an overall decrease of water resources in the Amazon resulting from deforestation, due to reduced evapotranspiration and thus lower cloud generation and rainfall. The response seems to be nonlinear with thresholds of deforestation leading to a significant fall in rainfall and runoff because of the significant rainfall recirculation that occurs in the basin (Salati and Nobre 1991; Leopoldo et al., 1995; Laurance and Williamson 2001; D’Almeida et al 2007). In addition, large- scale atmospheric circulations and thus water and energy cycles as well as sensible and latent heat flux could also be affected by deforestation and forest fragmentation due to a decline in surface roughness length and an increase in albedo leading to reductions in surface net radiation (Nobre et al. 1991; Eltahir and Bras,1996; Roy and Avissar 2002; Berbet and Costa 2003; Durieux et al. 2003; Voldoire and Royer, 2004; D’Almeida 2007).
Meso-scale (regional) models have also been used to simulate deforestation impacts upon atmospheric circulations at finer scales (Roy and Avissar 2002; D’Almeida 2007). In the Amazon these models project change of intensity and spatial distribution of precipitation as well as an increase in the seasonality of clouds in areas of high deforestation (Avissar and Liu, 1996; NASA 2004; D’Almeida 2007). These effects are attributed to disruption of
atmospheric circulations due to impacts of land use on the convective boundary layer depth, soil moisture, surface temperatures and sensible and latent heat fluxes (Chen and Avissar, 1994; Roy and Avissar 2002; Durieux et al. 2003). In addition, it has been suggested that significant seasonal and diurnal changes in cloud cover occur in areas of significant forest conversion to pasture (Roy and Avissar 2002; Durieux et al 2003). Over deforested areas, lower level clouds are simulated in early afternoons and less convection occurs at night and in the early morning in the dry season, while convective cloudiness increases at night in the wet season (Roy and Avissar 2002; Durieux et al. 2003). However, these effects are
particularly in the dry season. Results of these model simulations depend on the model and assumptions but indicate that significant deforestation-driven climate change can occur when between 30-60% of the basin is deforested (Costa et al., 2007; Sampaio et al., 2007). These simulations though, rarely include feedback mechanisms such as forest fires, atmospheric aerosols and dynamic vegetation which can cause a negative feedback with regional climate.
The effects of deforestation are likely to vary throughout the basin according to varying climatic and topographic contexts though the mechanisms and patterns are highly uncertain. While Eltahir and Bras (1994) report a weaker impact of deforestation on the water cycle in west-central Amazonia, Chou et al. (2002) reports stronger effects.
Simulations carried out with an RCM by Ramos da Silva et al (2008) show a gradual decrease in rainfall with increase in deforestation although more spatial variability and stronger effects under El Nino conditions are observed. Land use change and climate change are strongly connected through the effect of land use change on land surface albedo and thus rainfall and cloud generation but also through the effect of land use on carbon cycle dynamics influencing global atmospheric sources and sinks for carbon dioxide. Land use and cover are themselves fundamentally dependent upon climate and can thus be expected to respond to changes in climate with obvious feedback cycles between the two.
Results from Single Column Models (SCM) simulate greater precipitation over forested areas in Amazonia due to greater evapotranspiration (Rocha, et al. 1996; D’Almeida et al.
2007). Their results sometimes differ from field observations due to the lack of
consideration of horizontal discontinuities such as thermal instabilities. In the Amazon, the use of SCM to model the Continuous Boundary Layer (CBL) (in Rondonia) differ from in situ observations of the same properties (D’Almeida et al. 2007).
As well as direct energy balance related impacts on the climate, deforestation could
potentially affect many other processes relevant to the provision of ecosystem services and human securities, including: (a) mitigation of global climate change, (b) disruption to the natural flow regimes of the Amazon river and its tributaries, which are fundamental to the wellbeing of riparian communities for transport (navigation), (c) water, agricultural and fisheries security and thus health (Vorösmarty et al., 1989; Salati and Nobre, 1991; Victoria
et al. 1991; Eltahir and Bras, 1994; Bruijnzeel 2004; D’Almeida et al 2007).
Data-based studies on impacts of land use change
peaks at Manaus during the period 1903 – 1955, Gentry and Lopez-Parodi (1980) and Costa
et al. (2003) propose an increase in the duration of floods with deforestation over the period. Gentry and Lopez-Parodi (1980), also attributed higher flood crests of the Amazon river at Iquitos during the 1970s, compared to the 1960s, to greatly enhanced deforestation in the upper parts of the river basin in Peru and Ecuador. Nordin and Meade (1982) attributed the same changes to normal climate variability. Nordin and Meade also indicate that river stage changed due to alterations of the streambed at Iquitos coupled with higher rainfall and inter-annual storage. Sternberg (1987) points out the limitations of analyses based only upon river stage records, because of the confounding arising from inter-annual and longer term climate variability. Nonetheless, he indicated a potential upward trend of river stage of the Amazon river at Manaus due to deforestation over the period 1903 –1985. Chu et al. (1994) highlights the significant uncertainty in the estimate of absolute amounts of rainfall over contributing watersheds. Harden (2006) considered the impacts of reduced storage capacity of Andean landscapes of Ecuador, mainly due to paramo removal, concluding that whilst local scale effects are apparent, extrapolation over regional contexts is fraught with difficulty.
Comparison of runoff ratios at the Amazon basin scale
Perhaps the most comprehensive study looking at the impacts of deforestation on river flows in the Amazon basin at the large scale is that of Costa et al (2003), which used runoff ratios (runoff per unit rainfall) to avoid confounding by changes in rainfall volume over time (though any changes in intensity and seasonal distribution remain confounding). They considered a 50 year time series (1949 - 1998) of river flows at Porto National station of the Tocantins river (drainage area of 175 360 km2 in south-east Amazon), rainfall data from the
New et al (2000) dataset and land cover change from two periods with great contrasts in land use (1949 to 1968 with 30% deforested and 1979 to 1998 with 50% deforested). Costa et al (2003) suggest a statistically significant (but small) increase in the runoff ratio, i.e.
more runoff per unit rainfall (from 0.237 to 0.285 respectively), with negligible rainfall changes between the two periods. This means that historic land cover changes could have affected the long-term and seasonal maximum and mean flows of the Tocantins river. However, the rainfall dataset (New et al., 2000) still remains a source of uncertainty due to its coarse nature and thus important rainfall contributing areas might not be well factored in the analysis (D’Almeida et al. 2007).
Comparison of runoff ratios at the sub-basin scale
At small catchment scales (circa 1ha.) studies have reported changes in runoff ratios due to land use changes in the Amazon basin. Chaves et al (2007) in a paired catchment study in Rancho Grande, Rondonia, studying the impacts on flow regimes of the conversion from forest to pasture, reports an increase in surface stream flow from 0.8% to 17% of rainfall from a forest to a pasture site, which was attributed to changes in soil hydraulic
2006). These results coincide with similar studies reported for the Amazon states of Para (Moraes et al. 2006) and Manaus (Trancoso et al 2007). These studies highlight the
potential impacts of forest conversion to pasture at larger scales in the Amazon, though the extent to which such changes persist at those scales is – as yet – unknown and
extrapolation by modelling suggests that these effects reduce with scale. No studies referring to the change in peak flows, mean and minimum base flows are reported for flow stations in the Amazon tributaries in the countries of Colombia, Ecuador, Venezuela and Bolivia. Work by Buytaert et al (2006) and Buytaert et al (2011) looked specifically at the impacts of land use and climate change on high altitude paramo, though these cover very small areas at the Amazon scale.
Agricultural land management
In addition to changing land cover and use, land management practices can significantly affect the delivery of hydrological ecosystem services (and thus water security) downstream. Examples of such impacts are pesticide and fertilizer use in agriculture. Soybean and non-traditional crops in horticultural production in the Brazilian Amazon are some of the main pesticide consumers in the country and can severely contaminate soil and water in the region (Laabs et al., 2002; Römbke et al., 2008). Furthermore, fertilizer use has been increasing in the last decades leading to increased water pollution (Börner and Wunder, 2012). Intensification of agriculture through the use of mechanization has also been shown to increase deforestation as a result of increased capacity to deforest (Börner et al., 2007, Börner and Wunder, 2012) in contrast to the Borlaug hypothesis. Accidental forest fires, particularly in dry years due to slash-and-burn agriculture can also be a cause of
deforestation (Nepstad, 2001) and can also lead to increased overland flow generation, erosion and soil leaching (Williams et al., 1997).
Extractives - mining and oil and gas
Mining activities and oil and gas production are economically important for the Amazon basin but can also have significant impacts on water security both through their use of water and their contamination of downstream water resources. Small-scale artisanal gold mining is a significant source of mercury pollution to surface waters in the Tapajos river basin (De Sousa, 2010; Berzas Nevado et al., 2010) while oil extraction in the Ecuadorian Amazon is responsible for many oil spills and the release of untreated wastes into the environment (San Sebastian et al., 2002). These extractive activities are also partly
responsible for extensive forest degradation through the development of infrastructure such as access roads. The wave of development and deforestation that follows mining and oil can have a great impact on water quality and quantity. With nearly fifty per cent of the
Peruvian Amazon receiving oil and gas concessions in recent years (Finer and Orta
Hydropower
Hydropower potential is plentiful in the Amazon but little of it has yet been realised (see case study). For instance, Brazil has nearly two times the potential than currently installed with 63% of this potential located in the Amazon basin (Da Silva Soito and Freitas, 2011). This source of energy is economically important for the region but also has significant associated risks for water security downstream with potential impacts on water quality (Fearnside, 2001; Viana, 2002; Finer and Jenkins, 2012) and quantity. For instance, as a result of releases associated with HEP operations at the Samuel dam on the Jamari river, downstream dry season flows have increased and the occurrence of peak flows is now occurring 1-2 months earlier (Viana, 2002). As well as direct impacts on water, the
development of hydropower dams requires significant changes to the environment such as forest clearing for transmission lines and access roads and the flooding of large areas of forest for the creation of reservoirs. In some cases huge landscape destruction has taken place for only small potential hydropower generation, for example the Balbina dam where 2360km2 was flooded for a potential generation of only 250MW (De Sousa, 2010).
Population
Water security is as much about the demand for water as the supply of it. Population growth can significantly affect demand for water (both directly for domestic supply but also indirectly for industrial and agricultural water uses). If demand approaches supply on an average basis or periodically (e.g. seasonally) then the impact on water security can be profound.
Growth and migration
Population in the Amazon is highly concentrated in urban areas (Porro et al., 2008) and this is where population growth is also high and water security risks are most intense. There has been some international emigration from the Amazonian countries, largely within the Americas but also to Europe and elsewhere (Pellegrino, 2000). Internal migration within and between Amazon countries have been also important. In Colombia and Peru, due to population displacement from the Andean region either by armed conflict or lack of job opportunities many people moved to the Amazon area attracted also by oil, mining and coca “bonanzas” (Gomez, 1999; Dominguez, 1999; Puyana, 1999; INEI, 2009). Attracted by the potential of agriculture in the Bolivian floodplains, there have been significant movements from people of Brazil and Argentina, most being self-employed as farmers (Vargas, 2009).
cities such as Rio and Sao Paolo, Brazil or some of the Amazon border cities. The current population in the Amazon is found mostly in urban areas such as Iquitos, Leticia, Manaus, Rio Branco, Porto Velho, Boa Vista and Macapa with the remainder along the river and its main tributaries. However, immigration and settlement into the Amazon has been
accelerated in recent decades with population growth rates of between 5 and 7% which is above the national averages for the individual Amazon countries (Braga et al., 2011). The growing urban population is a driver for deforestation as a result of more infrastructure development (Weinhold and Reis, 2001) and is also a cause of water pollution due to increased domestic sewage that generally leaves the cities in an untreated state (Braga et al., 2011).
Per-capita demand
With economic development per-capita demand for water, especially that water embedded in food commodities (i.e. consumed as transpiration during crop production), increases significantly. Per-capita demand for food-water is increasing both regionally and globally. Whether the demand is within the Andes/Amazon or globally, the increasing trade of embedded water and thus the agriculturalisation of the Amazon could significantly threaten water security for some downstream communities.
Water treatment, supply and sanitation
Water treatment for urban areas in the Amazon countries is well developed. Drinking water sources are considered improved for the following proportions of the urban population at 2010: Brazil (100%), Colombia (99%), Ecuador (96%), Peru (91%), Bolivia (96%),
Venezuela (94% year 2000), Suriname (97%), Guyana (98%), French Guiana (88%). Rural improved drinking water coverage is less at: Brazil (85%), Colombia (72%), Ecuador (89%), Peru (65%), Bolivia (71%), Venezuela (74%, year 2000), Suriname (81%), Guyana (93%), French Guiana (71%) (UNICEF, 2012). The proportion of the population served by improved sanitation in urban areas has also much improved in recent decades in the Amazon countries: for 2010 Brazil (85%), Colombia (82%), Ecuador (96%), Peru (81%), Bolivia (35%), Venezuela (93%, year 2000), Guyana (88%), Suriname (90%) and French Guiana (85%, year 2000) (UNICEF, 2012). In rural areas the improved sanitation figures for 2010 are much lower: Brazil (44%), Colombia (63%), Ecuador (84%), Peru (37%), Bolivia (10%), Venezuela (54%, year 2000), Guyana (82%), Suriname (66%), French Guiana (57%, year 2000). This is good for water security and associated health security. However, in these countries sanitation systems are poorly developed even in urban areas and cannot usually cope with storm flow, so much of this effluent produced may find its way untreated into the river systems, creating hazards for downstream (especially rural, poor and
Dramatic improvements in sanitation have been made in the last 30 years in all Amazon countries except Bolivia. Open defecation is currently estimated at 11-25% in Brazil, Colombia, Ecuador and Suriname, less than 10% in Guyana but 25-50% in Peru and still >50% in Bolivia (UNICEF,2012), though this is predominantly a rural practice. Water pollution as a result of urban sewage in the Amazon has been studied by Coucero et al., (2007) who found high levels of nutrients in 65 urban streams around the city of Manaus.
Water treatment in rural areas is generally absent in the Amazon with most people obtaining water from rivers, springs and wells and consuming it untreated. Sanitation in rural areas is equally poorly developed with pit latrines being commonplace and many communities having even more poorly defined sanitation conditions (UNICEF, 2012).
We have examined the multitude of threats to water security in the Amazon, some of which are coupled with climate security and some of which are fundamentally linked to the drive to increase food and energy security in the region. We will now look at how realistic
scenarios of land use and then climate change may resolve spatially in the region to impact on water.
Modelling the impacts of land use change on the water security future of the Amazon
Here we use WaterWorld to examine the impacts of two scenarios for land use change on elements of water security. In each case the differences between the baseline water security conditions highlighted in the previous section and the conditions created by the scenario are compared to indicate areas in which water security might increase or decrease as a result. Figure 14 shows the land use change baseline (top left) and scenarios (top right and bottom left). In WaterWorld, land use is represented as a cover of trees, herbaceous vegetation and bare ground in each 1km pixel alongside an indication of land use (cropland, pasture, mining, urban, protected etc). The land use change scenarios used were generated by the
WaterWorld land use change model which works on the basis of projecting recent rates of deforestation as a mean per regional administrative boundary (for the last 12 years) into the future, deforesting areas with greatest current accessibility and closest to the existing deforestation fronts first. Two scenarios were run. In the first (called LUCC) we projected recent rates forward by 40 years to 2050 with protected areas ineffective at halting
deforestation in the areas nominally protected. For the second scenario (called ACCEL) we quadrupled the recent rate of observed deforestation (to levels seen in the late 20th Century)
much more extensive in the ACCEL scenario, except in protected areas. Even the ACCEL scenario shows much less deforestation than that proposed by the Soares-Filho (2006) business as usual scenario, though the ACCEL scenario is based on recent rates (last ten years) and is more consistent with the overall rates of change experienced over the last 40 years (Figure 15). The Soares-Filho BAU scenario appears to show a much greater deforestation for the next 40 years than was experienced in the last 40 years. The Soares-Filho scenario could not be used because it does not generate the tree, herb and bare cover required by WaterWorld and also it does not cover the entire ACTO area.
Figure 15: Tree cover (%) for top left: LUC (2050) and bottom right: ACCEL (2050) scenarios for Rondonia in relation to protected areas (WDPA, 2012)
Figure 16 and Figure 17 show the change in tree cover by major sub-basin resulting from the LUCC scenario and the ACCEL scenario respectively. Clearly the decreases in the tree cover are significant at the sub-basin scale in both scenarios but much more extensive in the ACCEL scenario. We now examine the hydrological impacts of these scenarios according to the difference between baseline and scenario outputs for key variables
influencing water security: the water stress index, the HF pollution index and the number of persons with poor quality drinking water. In terms of water stress, deforestation leads to decreases in fog water inputs (through reduced cloud water interception by trees, sensu
Figure 16: Change in tree cover resulting from continued deforestation at current rates for a further 40 years (LUC), by major sub-basin, %
Figure 17: Change in tree cover resulting from continued deforestation at quadrupled current rates for a further 40 years (ACCEL), by major sub-basin,%
Figure 19: Change in water stress index resulting from continued deforestation at quadrupled current rates for a further 40 years (ACCEL), by major sub-basin, % of industrial and domestic (blue water) demand not supplied in months at which supply<demand across the year
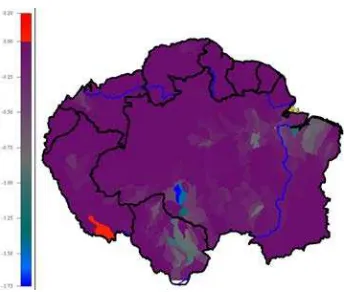
The changes in HF pollution index from the scenarios are much more significant since the differences between non-agricultural and agricultural land in terms of their contaminant inputs to downstream are significant. For the LUCC scenario many of the S and E
Brazilian sub-basins show high levels of HF index. For the ACCEL scenario the extent and intensity of impact on water quality is greater and it pervades further downstream.
Figure 21: Change in HF pollution index resulting from continued deforestation at quadrupled current rates for a further 40 years (ACCEL), by major sub-basin, %.
In terms of impact on water security both of these scenarios see increases in the number of people with poor quality (HF>50%) water, particularly in Caqueta, Colombia and some basins in Rondonia, Brazil and Beni, Bolivia (Figure 22 and Figure 23).
Figure 22: Change in persons per km2 with poor water quality resulting from continued deforestation
at current rates for a further 40 years (LUC), by major sub-basin, persons per km2
Overall, land use change projections that might be expected in the next 50 years lead to only very small effects on water quantity, echoing the impacts of historic deforestation indicated by the literature review. The resulting impacts on water stress are minor though the impacts on water quality are much more significant.
The role of climate change in exacerbating these threats and
generating new threats to water security
The Amazon basin straddles the equator and the basin stretches from 5 degrees N to 20 degrees S and 79 degrees W to 49 degrees W. A complex mosaic of climates exists in this area. Rainfall varies from more than 3000 mm/yr to less than 1500 mm/yr in a NW to SE gradient across the basin and there are also strong elevational gradients in the western Amazon.
The climatic threats
The impact of climate variability
A review of the relevant literature on observed changes in flow resulting from land use change for the Amazon indicates that significant variability in flow exists as a result of climate variation and this makes the assessment of land use impacts difficult, also because flow records are often short and interrupted and few controlled (paired catchment) studies exist. This variability includes decadal and inter-annual climate variability that has affected the discharge of the Amazon river in different parts of the basin. ENSO phenomena have produced severe drought and strong flow and rainfall deficits in the western Amazon with consequent widespread fires (Carneiro, 1957; Sternberg 1987;
Williams et al 2005). Mulligan et al. (2011a) showed an inter-annual variability in rainfall for the nearby Andes of 9% and for the Sao Francisco of 2.4%.
Climate change scenarios for the Amazon
Climate change scenarios for the Amazon can be separated into those that result from global greenhouse-forced climate change (of which the Amazon is only one of many contributors) and those that are a function of regional change in land surface conditions including land use. Generally, climate model projections for the Amazon based on
eastern Amazon and the Sao Francisco basin. For the western Amazon though, more precipitation extremes are projected (Marengo, 2009). Simulations for the Peruvian-Andes basin part (~10%) of the Amazon by Casi et al., (2011) using several GCMs have shown that impacts of climate change on hydrology vary with watershed and scenario with some basins projected to have an increase in runoff and others a decrease. As part of an analysis of 11 large basins globally, Mulligan et al. (2011a) examined climate change in Brazil’s Sao Francisco basin and the Andes using an ensemble mean for 17 GCMs from AR4 A2 to the 2050s. Temperature was projected to increase across the Andes by a mean of 2.7 degrees Celsius with a standard deviation of 0.9, whilst rainfall would increase by 137 mm/yr but with a standard deviation between GCMs of 882 mm/yr. The Sao Francisco shows similar warming and highly uncertain wetting. This level of uncertainty in rainfall projection makes scenario generation challenging.
Gradual change vs. abrupt events
As well as projected continuous and gradual climate change, it is likely that there are tipping points in the Amazon system (Malhi, 2009). An example of such an abrupt possible change is the notion of Amazon rainforest 'die back' which is the replacement of forests by savannah and semi-arid vegetation as a result of climate change. Such a die back of parts of this vast rainforest would mean the Amazon shifts from net absorbing carbon from the atmosphere to net emitting it. Early model simulations suggest this could happen as early as 2050 (Cox et al., 2000) although more recent studies indicate that this may happen later in the future (Huntingford et al., 2004) or not at all (Schaphoff et al., 2006). However, two severe and unusual recent droughts in 2005 and 2010 have demonstrated the mechanism of a shift from the Amazon buffering the anthropogenic increase in atmospheric CO2 to
accelerating it (Lewis et al., 2011). These droughts were caused by a combination of
intensified ENSO events as a result of increased Pacific SST and high Atlantic SST causing a northwest displacement of the inter-tropical convergence zone (Zeng et al., 2008; Lewis et al., 2011). Droughts increase the forests' vulnerability to fire occurrence which acts as a positive feedback that can lead to accelerated forest degradation.
Climate uncertainties
Projections of precipitation in climate models are highly uncertain. This is particularly the case for the deep tropics in South America (Rowell, 2011). Most IPCC AR4 GCM
underestimate rainfall for the Amazon (Malhi et al., 2009) which is mostly due to highly uncertain modelling of sea-surface temperature changes in the oceans. Jupp (2010)
that wet seasons penetrate further south than they actually do, due to cool westerly air over the Andes that dissipate the convective energy of moist Amazonian air masses in reality which are not well represented in the GCMs. This process limits the southern extent of rains and increases actual rainfall over the Amazon (as a latitudinal concentration mechanism). In a study comparing 19 GCM, Malhi et al., (2009) found that 18 of them underestimate current rainfall compared to Tropical Rainfall Monitoring Mission (TRMM) and CRU observed datasets in western Amazonia. A recent study by Torres and Marengo (2012) comparing 24 GCMs from the IPCC AR4 concluded that there is a more than 90% probability that temperature increase in the Amazon will exceed 2 deg. C by 2100 but that projected changes in precipitation have a similar magnitude as the uncertainty range and are comparable to natural variability. Precipitation is fundamental to water security but also essentially unpredictable even on short time scales.
The impacts on water security
Water quantity
The projected drying in southern and eastern Amazonia will likely cause a reduction in river flows in those areas and thus a decrease in water supply. A number of studies have assessed the potential impacts of climate change on water supply in the Amazon with projected changes in Amazon river runoff reflecting the uncertainty in climate change projections, i.e. some studies project increase in runoff (Nijssen et al., 1999) while others project decreases in runoff (Aurora and Boer, 2001; Palmer et al., 2008). Generally though, a reduction in river runoff for eastern and southern Amazonia is expected. Furthermore, greater variability in precipitation is projected which could lead to higher spatial and temporal variability in river discharge (Coe et al., 2002). Studies into changing water demand in the basin are scarce but simulations carried out with the global WaterGap model for the 2050s indicate that despite projected reductions in available water,
withdrawals will remain low enough to prevent water stress on an annual basis (Palmer et al., 2008). Seasonal water stress was not analysed by Palmer et al. but may be important as may local excesses of demand over supply (see below).
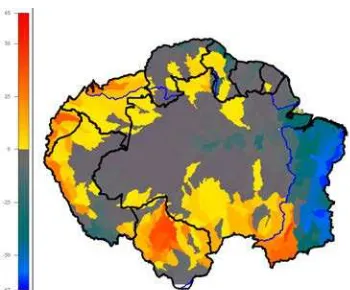
across the basin but the much more hydrologically significant change is the change in rainfall. There is clearly significant uncertainty in the projections with the mean of all GCMs indicating a significant wetting relative to the present day baseline in most of the basins to the W, central and S Amazon, whereas the mean minus 1 SD shows drying throughout the basin. The wetting for the mean of the ensemble appears to increase further towards the 2080s, especially in the W of the basin.
Figure 24: Change in rainfall with AR4 A2 mean of all (20) models 2050s
Figure 25: Change in rainfall with AR4 A2 mean of all (20) models minus one sd 2050s
WaterWorld uses the monthly temperature and precipitation grids from the scenarios (downscaled to 1km spatial resolution) to simulate the hydrology. Processes of snowfall and snowmelt, fog and fog water interception, rainfall and evapo-transpiration respond to these climatic forcings. The outcome in terms of change in the water stress index (mean monthly % of water demand that is not supplied) is shown in Figure 27 to Figure 29 to the same scale. Clearly the mean scenario leads to increases in precipitation but also in evapo-transpiration such that the mean overall water stress increases slightly in some basins and decreases slightly in others. Note that we did not combine the climate scenario with an increased population and agricultural land use which would likely further increase the water stress. If we look at the mean minus 1 sd then the picture changes completely with most of the outer basins of the Amazon to the S and W showing a significant increase in water stress whilst the populous eastern Brazil basins show a significant decrease in stress (though this decrease may be lessened by continued population growth in that area). The results reflect the differences in annual total and especially seasonal precipitation changes between the regions. Whether these impacts result in changes in hydropower potential depend upon the design flows for the dams in question relative to the changes identified here. Both increases and decreases in flows may have impacts on the operation of dams which have been designed for the baseline climate. Areas which dry may have multiplier effects for other threats such as fire events and drought. Areas that wet may have
multiplier effects on flooding. The reality is that such extreme events are impossible to quantify into the future so that their management is difficult.
Figure 28: Change in water stress with AR4 A2 mean of all minus one sd (20) models 2050s, % of industrial and domestic (blue water) demand not supplied in months at which supply<demand across the year
Figure 29: Change in water stress with AR4 A2 mean of all (20) models 2080s, % of industrial and domestic (blue water) demand not supplied in months at which supply<demand across the year
The mean scenario for the 2080s shows a similar pattern of change to that observed for the 2050s. Changes in water quantity as a result of climate change can also impact upon water quality (even in the absence of any land use change) since changes in the distribution of precipitation inputs over areas impacted to a greater or lesser extent by human activity affect the impacts of those activities on water quality.
Water quality
also sediments from enhanced soil erosion following deforestation, particularly in the south-eastern areas of the Amazon Basin in Brazil (UNEP, 2004). Chemical pollution is not as directly perceived by communities compared with sediments and erosion. Mercury used in gold mining and pesticides in agricultural areas are considered some of the most important causes of chemical pollution in Amazon waters. Mercury levels measured in fish and people have already presented alarming levels and some wild fish already exceed the limits for safe consumption (da Silva et al. 2012). The sources of mercury are not only derived from anthropogenic inputs, but also come from natural sources and natural biogeochemical process. However, there is evidence that pollution by mercury coming from gold mining can present a genotoxic effect in fish species and has a cumulative effect in the food chain (Porto et al, 2005). Pesticides may be similarly problematic in the food chain but their
concentration in wild animals is poorly known. Eutrophication sometimes results from the use of agricultural fertilizers in the region but high flows in most of the river system minimize this outcome (UNEP, 2004).
Changes in climate and land-cover can have a direct impact on water quality not least through changes in the distribution of rainfall and the dilution of inputs by runoff volumes. However, Lindell et al., (2010) studied water quality for 48 watersheds in the sub-Andean Amazon and found that deforestation (and replacement with swidden fields, crops, pastures and regenerating vegetation) had no measurable impacts on stream water chemistry – it being dominated by spatial variation in natural controls. Climatically induced increased water temperature can have an impact on ecological quality of water causing a change in habitat for aquatic species or having a direct effect on eggs and larvae (Carpenter, 1992).
Figure 31: Change in human footprint on water with AR4 A2 mean of all minus one standard deviation (20) models 2050s
Figure 32: Change in human footprint on water with AR4 A2 mean of all (20) models 2080s
Figure 30 to Figure 32 indicate the changes in the HF pollution index with the WaterWorld
climate scenarios implemented. With the mean scenario, HF pollution increases in some basins but decreases in most in line with the higher rainfall volumes - these patterns are sustained into the 2080s. With the drier scenario (mean minus 1 SD), HF decreases
significantly in some SW and E sub-basins where rainfall is higher but increases elsewhere.
Flow regulation and seasonality
land use changes since inundation affects available land and hence carbon fluxes. Terra-i (Reymondin et al., 2012) calculates a flood mask using the MODIS MOD35 product in order to separate anthropogenic deforestation from natural flooding. Analysis of pixels flooded in the period January 2004 - May 2012 and multiplication by the estimated populations of those pixels before aggregation to major sub-basins gives the map shown in Figure 33. Clearly there are 3 clusters of flood-affected populations, in the upper Amazon rivers of Peru, Ecuador and Southern Colombia, on the Amazon main stem and in SE Brazil mainly outside the watershed. The economic impact of this flooding can be estimated by the fraction of the population, road infrastructure and urban areas that overlay the flooded areas. The flooded areas directly affected 0.09% of the Amazon population, 0.14% of the road infrastructure and 0.36% of the urban area.
Figure 33: Estimate of flood affected populations summed by major sub-basin
Climate-induced wildcards
Migration
Migration in the Amazon is usually the result of government-driven colonization schemes or economic migration into cities (urbanization). Migration can fundamentally change the water demand elements of water security by creating new demand for agricultural or domestic water and can also change the supply elements of water security by affecting water quality through new agricultural interventions or urban effluent production. In addition to the projected growth in population throughout the Amazon, urbanization and colonization is expected to continue to change the distribution of population within the basin.
Agricultural change
biofuels (Malhi, 2008, 2009) can and have caused an expansion of agricultural areas at the expense of forest regions. Climate change can provide positive feedbacks to this process, accelerating the degradation as a result of increasingly fragmented forests, more droughts and associated forest fires. Nepstad (2006) estimates that if more frequent El Nino episodes and associated droughts continue in the future, 55% of the forests of the Amazon could be cleared, logged, burned or damaged by drought in the next 20 years.
Interactions with other securities
Health
Climate and land cover change can have an impact on human health as a result of
increases in heat waves, droughts, fires and floods that can cause injury, spread disease or damage sanitary or transport infrastructure. Specifically, increased flooding can cause outbreaks of vector-borne diseases such as malaria and dengue and infectious diseases such as cholera and meningitis. Disruption to transport infrastructure can deny access to
existing healthcare. Changes in water supply and water quality can also affect health in many ways. For example, deforestation in the Peruvian Amazon is said to be responsible for increased rates of malaria as a result of the creation of more areas of standing water where mosquitoes can lay eggs (Costello et al., 2009).
Energy
Energy security in the region depends on the interaction of population, industrial and agricultural growth and continued development of oil, hydropower and renewable (e.g. domestic biofuels) sources of energy. Water is fundamental as an input to biofuel and hydropower production but is also affected significantly (in quantity and quality) by some of the primary and secondary impacts of petroleum exploration and production. The centres for hydropower and oil production in the Amazon are the borders of the Andean countries and Brazil with significant potential for boundary disputes and trans-boundary water conflict as intensity of use increases in this zone affecting both quality and quantity of available water. Understanding the impact of climate change on the operation of HEP dams at the Amazon scale is not possible: areas with either (seasonal or annual) increases or decreases in runoff are likely to have impacts if these changes are outside the design tolerances of the dams considered.
Food