Economic Brief
_____________________________________________________________________________________________
A Look into BI’s Tightening Bias
Economic Highlights
•
There’s more than meets the eye concerning last week’smilder than expected BI rate hike.
•
The recently strong increase in average discount rates oncentral bank certificates may help to intensify BI’s tightening bias.
•
This may help counter market (mis-)perceptions that BI is“behind the curve.”
Bond Market Highlights
•
Over the past month, the yield curve has been flattening withthe 3 – 15 year tenors being battered significantly in terms of yield increases.
•
This is consistent with our expectation (see our report dated29/04 “On the Look-out for a Flattening Curve”), which is based on the notion of higher uncertainty on the short-term inflation outlook.
•
We don’t expect a reversal yet: long-end prices appear to besupported by strong demand from foreign investors, while market jitters over June inflation—as well as stubbornly high oil prices—may continue to exert negative sentiment on the short end.
Selected Economic Indicators
Latest 2Q08F* 3Q08F* 4Q08F* 1Q09F* 2Q09F* IDR/USD 9,305 9,200 9,100 9,250 9,375 9,150
BI rate (% p.a.) 8.50 8.50 9.25 9.50 9.50 9.50 CPI (% chg y-o-y) 10.4 13.3 13.1 12.5 12.2 8.2
Source: Bloomberg, *Danamon Estimates
12 June 2008
Helmi Arman
Economist / Bond Strategist [email protected]
A look into BI’s tightening bias
More than meets the eye
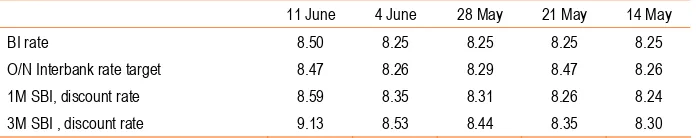
Following the shift in BI’s policy rate target to the O/N interbank rate, the central bank has apparently loosened the link between the BI rate and the average discount rates on SBI certificates.
The 1M SBI is still at around 10bps above the prevailing BI rate; however the 3M SBI is now 63bps above the policy rate from previously just 28bps (Table 1) . BI also set the new 6-month bill at 9.63% or 113bps over the BI rate.
The absorption rates for the bills were relatively high at 84 – 86% of incoming bids (compared to 33% – 59% in the previous week’s auction). This suggests that BI is now more willing to let the market have a larger say on the average discount rates on SBIs.
Tightening effect shouldn’t be overlooked
With the 1, 3 and 6 month SBI rates likely set to increase further, the effect of BI’s policy rate moves now should be stronger than what one would have expected under the previous system.
Let’s not forget also that the average discount rate on 3M SBIs is linked to the coupon rates on VR government bonds. There are currently Rp165.6tn of VR government bonds, of which most are held by banks. That figure is equivalent to an estimated 90% of outstanding 1M and 3M SBIs held by commercial banks as of the first week of May.
In this regard, the pieces are coming together on why BI only hiked its policy rate by 25bps instead of 50bps last week. It is important not overstress the perceived mildness of BI’s recent rate hike.
Would a higher 3M SBI rate further strain the budget deficit?
In the baseline scenario of the state budget, the 3M SBI rate (which is the benchmark for VR coupon bonds) is assumed at 7.5%. Given that the 1-yr bond is already priced at around 11.1% now, the money market yield curve may steepen further and the average 3M SBI rate in 2H07 will probably rise to around 9.50% in our view.
By our count, this may raise the government’s interest burden from its VR bonds this year by around Rp2.2tn from the baseline scenario. Bloating interest payments certainly do not help alleviate ongoing market concerns about deficit financing. However we don’t think the increment represents a grave concern. (The government’s 2008 budgeted deficit is at Rp94.5tn).
Table 1. Selected Interest rates (% p.a.)
Yield curve: How flat can it go?
Offshore demand still existent, for long-dated bonds
As indicated from the results of this week’s bond auction. Market demand for long-end bills was still existent. The longer maturity bills received the more bids in volume terms. Absorption was also higher for the 20-yr bond compared to the 10-yr, while none of the bids for the 5-yr was absorbed at all.
Yield curve has been flattening
In our report dated 29 April 2008 (“On the Look-out for a Flattening Curve”), we had called for a narrowing term spread. This was based on the notion that long-end yields were already comparable to their historical highs, while the short end was prone to a deterioration of the short term inflation outlook (which is triggered by cost-push inflation).
In line with our expectations, the yield curve has flattened considerably with the 5yr – 30yr term spread at just little over 25bps! (See Chart 1). Even though BI is holding down the very left end of the curve (i.e. the O/N interbank rate), we do not rule out further moderate yield increases in the 1 – 3-yr tenors.
What would be the catalysts for a sustained rally?
We think this flat yield curve may persist for some time, given possible upside surprises on June inflation and stubbornly high oil prices. As we have stated before, catalysts for a sustained improvement in bond prices would likely involve 1) a decline in crude oil prices; 2) a credible policy to reduce the linkage between fuel subsidies and crude oil prices.
Chart 1. IDR Sovereign Yield Curve
As expected, the yield curve has flattened noticeably.
Source: CEIC, Danamon Estimates
29/04/08 11/06/08
Long-end bonds still well bid in the auctions
Considerable narrowing of the 5 – 30yr term spread
Selected Economic Indicators
2005 2006 2007 2008E* 2009E*
National Accounts
Real GDP (% yoy) 5.7 5.5 6.3 5.9 6.3 Domestic demand ex. Inventory (% yoy) 5.8 3.7 6.0 6.1 7.3 Real Consumption: Private (% yoy) 4.0 3.2 5.0 5.0 5.2 Real Gross Fixed Capital Formation (% yoy) 10.8 2.9 9.2 8.3 10.0 GDP (USD Bils.) — nominal 287 364 433 502 577 GDP per capita (USD) — nominal 1,308 1,641 1,925 2,205 2,502 Open Unemployment Rate (%) 10.3 10.3 9.8 8.0 7.1
External Sector
Exports (% yoy, US$) 19.7 17.7 13.2 7.0 8.0
Imports (% yoy, US$) 24.0 5.8 22.0 12.0 12.0
Trade balance (US$ Bils.) 28.0 39.7 39.6 38.7 38.4
Current account (% of GDP) 0.1 3.0 2.5 1.6 1.1
External debt (% of GDP) 48 37 30 26 23
International Reserves-IRFCL (US$ Bils) 34.0 42.6 56.9 64.0 70.0
Import cover (months) 4.3 4.5 6.2 6.0 5.6
Currency/US$ (period average) 9,711 9,167 9,139 9,215 9,275
Other
1M SBI (BI policy) Rate (% period average) 9.0 11.9 8.6 8.8 9.3 Consumer prices (% period average) 10.5 13.1 6.4 11.0 9.4 Fiscal balance (% of GDP; FY) -0.5 -1.0 -1.3 -1.9 -1.7
S&P's Rating - FCY B+ BB- BB- BB- BB
Economic and Market Research
Anton H. Gunawan
Chief Economist
+62 21 5799-1466
[email protected]
Helmi Arman
Economist / Bond Strategist
+62 21 5799-1563
[email protected]
Anton Hendranata
Econometrician
+62 21 5799-1563
[email protected]
PT Bank Danamon Indonesia, Tbk.
Menara Bank Danamon, 8th Floor Jalan Prof. Dr. Satrio Kav. E IV #6 Mega Kuningan, Jakarta 12950
INDONESIA
***
Facs: +62 21 5799-1048
ANALYST CERTIFICATION
I, Helmi Arman, hereby certify that all of the views expressed in this research report accurately reflect my personal views about any and all of the subject issuer(s) or securities. I also certify that no part of our compensation was, is, or will be directly or indirectly related to the specific recommendation(s) or views in this report.
DISCLAIMER