Iowa State University
Digital Repository @ Iowa State University
Swine Research Report, 1998
Animal Science Research Reports
1999
Efect of Frequency of Swine Manure Application
on the Yield of Corn and Soybean
Randy Killorn
Iowa State University
Follow this and additional works at:
htp://lib.dr.iastate.edu/swinereports_1998
Part of the
Agriculture Commons
, and the
Animal Sciences Commons
Extension Number: ASL R1593
his Management/Economics is brought to you for free and open access by the Animal Science Research Reports at Digital Repository @ Iowa State University. It has been accepted for inclusion in Swine Research Report, 1998 by an authorized administrator of Digital Repository @ Iowa State University. For more information, please [email protected].
Recommended Citation
Killorn, Randy, "Efect of Frequency of Swine Manure Application on the Yield of Corn and Soybean" (1999).Swine Research Report, 1998.Paper 37.
Iowa State University
Management/Economics
Effect of Frequency of Swine Manure Application on the Yield of
Corn and Soybean
Randy Killorn, professor of soil fertility,
Department of Agronomy
ASL-R1593
Summary and Implications
This study was conducted to find the effect of the frequency of liquid swine manure application on the yield of corn and soybean grown in rotation. The results suggest that all the nitrogen (N) in the swine manure is available for plant uptake the year that it is applied. This is new information that will be incorporated into new
recommendations for animal manure management. Soybean yields responded to manure application even though the field tested high in both phosphorus (P) and potassium (K). The reason for the response cannot be determined from these data. Further research is warranted into this question. These data strongly suggest that soybean is a good crop to receive animal manure applications.
Introduction
The nutrients contained in animal manure can be used to produce crops. Efficient use of these nutrients, however, is difficult because part of the total nutrient content of animal manure is in organic compounds. The nutrients in these compounds must be converted to inorganic forms before they can be used by crops. The rate that this occurs has never been established precisely. The purpose of this study was to find the effect of the frequency of liquid swine manure application to a corn-soybean rotation on the availability of nitrogen (N).
Materials and Methods
The experiment is located in north central Iowa and is a split-plot in a randomized, complete-block design with three replications. The main-plots are frequency of liquid swine manure application: every year, every other year to
corn, every fourth year to corn, and no manure. Manure is applied at one rate estimated to supply 150 lb of total N per acre.
The subplots are rates of N fertilizer (0, 50, 100, and 150 lb/acre) when corn is the crop planted. The treatments are applied to a corn-soybean rotation with only one crop planted each year. The manure and the liquid N fertilizer are injected to a depth of 4-6 inches.
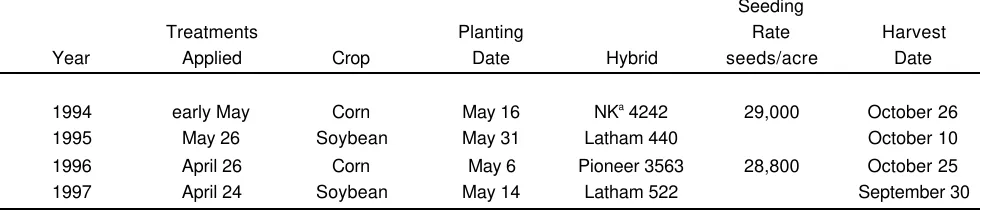
Table 1 lists planting dates and rates, crop hybrid or variety, and harvest dates for 1994-1997. These cultural practices have been timely and typical for north central Iowa. Pesticides were applied as required.
Results and Discussion
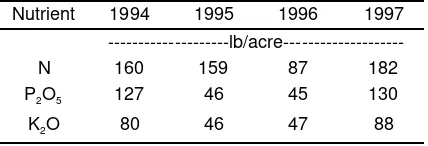
Initial soil tests showed that pH (6.3), P (24 ppm), and K (162 ppm) were all adequate for crop production. Table 2 illustrates the variability in the nutrient content in the manure among years. Table 3 shows the actual amounts of nutrients applied. The amount of N, P, and K applied varied considerably over the 4 years. In fact, the N rate applied with the manure in 1996 was half what was intended.
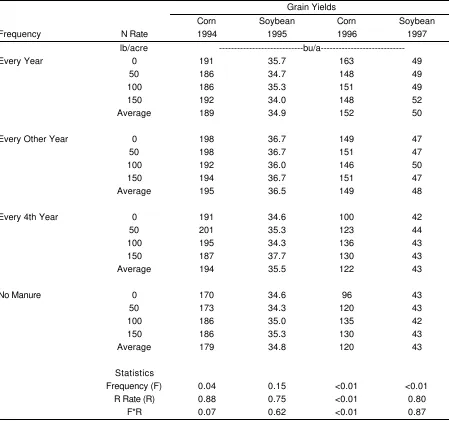
Average grain yields for 1994 -1997 are shown in Table 4. Corn yields in 1994 were high but were not affected by rates of N fertilizer. The main-plots that received manure yielded more than 10 bu/acre more than the main-plot that received N fertilizer only (P=0.04). This observation is interesting because the area tested high in both P and K and there was not a response to N.
Soybean yields in 1995 averaged about 35 bu/acre. The yields were not affected by direct application of liquid swine manure nor residual effects from the application made in 1994. However, the experiment was only in its second year so it was not possible to evaluate the entire range of manure treatments.
Corn yields in 1996 were lower than in 1994 but were typical of north central Iowa. Plots that received manure (every year and every other year) did not respond to
Table 1. Cultural practices by year for the frequency of manure application study at Kanawha, Iowa. Seeding
Treatments Planting Rate Harvest
Year Applied Crop Date Hybrid seeds/acre Date
1994 early May Corn May 16 NKa
4242 29,000 October 26 1995 May 26 Soybean May 31 Latham 440 October 10 1996 April 26 Corn May 6 Pioneer 3563 28,800 October 25 1997 April 24 Soybean May 14 Latham 522 September 30
Iowa State University
Management/Economics
application of N fertilizer and averaged about 150 bu/a. The plots that receive manure every fourth year (no application in 1996) and the no manure plots responded to N fertilizer (P<0.01). Yields were maximized at the 100 lb N/acre rate at about 135 bu./acre.
As in 1994, the yield of corn in manure treated plots was higher than in plots that received only N fertilizer. The magnitude of the difference is, in part, an artifact of the experimental design. The plots that received manure had high yields in both the 0 and 50 lb N/acre treatments. In the fertilizer only plots the 0 and 50 lb N/acre
treatments did not maximize yields leading to a higher average yield in the manure treated plots when averaging over N fertilizer rates. The average yield of the manure treated plots is about 130 bu/a if the average yield for the fertilizer only plots for the 0 and 50 lb N/acre plots is substituted for the high yields. Still, the manure treated plots averaged about 10 bu/a higher yields than the fertilizer only plots.
Soybean yields averaged about 45 bu/a in 1997. Yields were five to seven bu/a higher in plots to which manure had been applied in 1997 and 1996 (P<0.01). The response of the soybean was not expected because N fertilization is not considered to be necessary for legumes. This deserves more study because if soybean yields can be increased by applying animal manure then farmers have more acres for profitable manure application.
Table 2. Concentration of N, P, K, and percentage of solids in liquid swine manure used in the experiment.
Year Total N Total P Total K Solids ---ppm--- % 1994 7,095 2,523 2,950 7.98 1995 8,250 1,050 2,040 3.04 1996 5,970 1,430 2,860 6.30 1997 6,822 2,213 2,720 6.21
Table 3. Amount of N, P2O5, and K2O applied
to the experiment, 1994-1997.
Nutrient 1994 1995 1996 1997
---lb/acre---N 160 159 87 182
P2O5 127 46 45 130
K2O 80 46 47 88
There is no evidence of residual N due to prior manure application in the corn yields of the plots treated every 4th year with manure. The yields are no different from the fertilizer only plots suggesting that we need to reevaluate the assumption of slow mineralization of
organic N. It may be that, at least for liquid swine manure stored in pits, it is possible to take credit for the total N concentration.
Acknowledgments
Iowa State University
Management/Economics
Table 4. Effect of the frequency of animal manure application and N fertilizer rate on the
yield ofcorn and soybean, 1994-1997.
Grain Yields
Corn Soybean Corn Soybean
Frequency N Rate 1994 1995 1996 1997
lb/acre
---bu/a---Every Year 0 191 35.7 163 49
50 186 34.7 148 49
100 186 35.3 151 49
150 192 34.0 148 52
Average 189 34.9 152 50
Every Other Year 0 198 36.7 149 47
50 198 36.7 151 47
100 192 36.0 146 50
150 194 36.7 151 47
Average 195 36.5 149 48
Every 4th Year 0 191 34.6 100 42
50 201 35.3 123 44
100 195 34.3 136 43
150 187 37.7 130 43
Average 194 35.5 122 43
No Manure 0 170 34.6 96 43
50 173 34.3 120 43
100 186 35.0 135 42
150 186 35.3 130 43
Average 179 34.8 120 43
Statistics
Frequency (F) 0.04 0.15 <0.01 <0.01 R Rate (R) 0.88 0.75 <0.01 0.80