BIAS ASPECT IN DECISION MAKING FOR BUYING LIFE
INSURANCE IN INDONESIA
Benny Kurniawan
Faculty of Business & Economics, University of Surabaya
Werner R. Murhadi
Faculty of Business & Economics, University of Surabaya
ABSTRACT
This research aims to learn about the irrationality in Indonesian society when making purchase decision related to life insurance. This irrationality caused by the multiple aspects such as excessive optimism, representativeness bias, overconfidence, herding effect, availability, confirmation bias and framing effects. This study will describe how the life insurance purchase decisions are seen from seven aspects of bias. This research is positivism basic research in quantitative and descriptive. This research data obtained by survey method where this method using questionnaires. The number of samples in this study was 160 people. The results of this description will be used to address the main problem of this research. Aspects of representativeness bias are not used in this study because the respondent data reliability is very low. Descriptive statistical test results from this study indicate that only availability bias and framing effects contained in life insurance purchase decision. Aspects of availability bias are a dominant aspect of life insurance purchase decision. In addition, this study also indicates that there are differences between men and women. The aspect of availability bias and framing effect occurred on men, but for women only framing bias effect occurred. This study also indicates that there is difference bias result in terms of different age of respondent and the duration of life insurance ownership. Overall, this study shows that there is no bias aspect in the life insurance purchase decision. Keywords: irrationality, excessive optimism, representativeness bias, overconfidence, herding effect, availability, confirmation bias, framing effect
1. Introduction
The human effort in fulfilling the necessities of life does not always work well because every business or action someone always has a risk. The risk is the uncertainty that may give rise to a loss that will impact on the quality of life. Kertonegoro (1991) explains that in order to protect themselves from the risk of uncertain living, humans will look for methods that can overcome economic uncertainty and seek an economic certainty. Such methods include the regular saving of income, investing, and taking protection to overcome the problem of economic uncertainty in the future. Insurance is a willingness to establish certain
small losses in lieu of major uncertain losses (Salim, 1989). Many insurance companies have offered various types of insurance. One insurance company that is often chosen and followed by people in Indonesia is life insurance. Life insurance is an insurance that aims to bear people for unexpected financial losses where this loss is a result of the risk of living too short or living too long (Salim, 1989).
Neumann and Morgenstern (1944) in Ackert and Deaves (2010) developed a theory of utility in which individuals always act in a certain way when they are faced with choices and are required to make decisions in uncertainty. If decision making uses a normative approach, then one will resort to rational ways based on mathematical or statistical calculations (Suharnan, 2005). Based on these two opinions already described, then each individual has the ability to manage information perfectly as a rational individual. A rational individual is able to determine the best choice as a decision maker in life insurance.
Kunreuther and Pauly (2015) explain that consumers have difficulty in choosing whether to buy insurance or not. This difficulty is based on the irrational behavior of decision makers. This statement is supported by Tversky and Kahneman (1981) who explain that not everyone thinks rationally. This irrationality is influenced by individual behavior. Therefore, individual behavior studies on finance are increasingly in demand. This statement is reinforced by Ackert and Deaves (2010) which explains that there is a rapid development in psychology related to financial behavior.
One example of financial behavior research that has been done by Tversky and Kahneman (1981) about framing. In this study, respondents were given a problem that in the United States would be hit by a disease that can kill 600 people. From these problems, two kinds of surveys were produced that had the same pair of statements in a different but meaningful way in the delivery (framing). In the survey, the information was delivered in favorable conditions in which program A surely saved 200 people. Therefore, people tend not to take risks or become risk averse so that more people choose program A (72% of respondents) than program B (28% of respondents) where B program there are risks. In the second survey, information was delivered in an unfavorable condition where program A caused 400 deaths. Therefore, people tend to take risks or become risk-taking so that people prefer B program (78% of respondents) compared to program A (22%) where B program there is a chance to save 600 people.
Loewenstein et al (2013) conducted a study that could explain the overconfidence of understanding of insurance. The results show that overconfidence occurs because 97% of the respondents feel understood about the concept of a deductible, but only 78% of the respondents gave the correct answer to the concept. Overconfidence also appears in the other three insurance concepts of copy (100%: 72%), coinsurance (57%: 34%), and maximum out-of-pocket (93%: 55%).
Bashir et al (2013) conducted a study to determine the aspect of any bias that gives a direct influence on financial decision making. Aspects of the bias studied are overconfidence, confirmation bias, an illusion of control, loss aversion, mental accounting, status quo, and excessive optimism. This research uses linear regression method and correlation method with the aim to know whether there is bias effect to decision making. The results obtained from this study can explain that confirmation bias, an illusion of control, excessive optimism, and overconfidence have a direct impact on decision making, while other aspects of bias do not have a direct impact on decision making.
The influence of overconfidence and illusion of control on investor decision making is also examined by Qadri and Shabbir (2014). This study uses a sample of investors in Islamabad Stock Exchange (ISE). The results of the study found that these two aspects of bias have a major effect on investors' decisions at ISE. In addition, the study also found that men tend to have greater overconfidence than women.
Research conducted Onsomu (2014) also observed the availability of bias, bias representativeness, confirmation bias, and disposition effect. This research turned out to provide a different explanation with previous research. Overconfidence has no significant effect because less than 50% of investors affected by this aspect of decision making and for other aspects of bias still, has a significant effect. In addition, the study also found that there is no correlation between availability of bias, bias representativeness, confirmation bias, disposition effect, and gender overconfidence.
Raut and Das (2015) in Mallick (2015) attempted to analyze the bias aspects related to social factors such as representativeness, availability, and anchoring. The results explain that these three aspects of bias are the main factors that can determine individual decisions. These results can show clearly that individual decision-making is strongly influenced by representativeness, availability, and anchoring. Researchers also suggest conducting further studies on financial behavior that resulted in a decision error, especially on mistakes that are often made by investors.
Based on the research that has been done and described before, the researcher wanted to know the description of bias aspect in the decision making of someone in purchasing of insurance in Indonesia especially life insurance. This research will use 7 of 14 aspects of bias that have been used by Baumann (2012) that is excessive optimism, representativeness, overconfidence, herding effect, availability, confirmation, and framing. Researchers did not include anchoring, conjunction fallacy, and an illusion of control, intertemporal choice, loss aversion, mental accounting, and the status quo in this study. This study will use a wider population compared to previous research in Indonesia. Seven aspects of bias are excessive optimism, representativeness, overconfidence, herding effect, availability, confirmation, and framing in making life insurance purchasing decisions. Based on this, then in this study, there is one main problem is how to purchase insurance decisions when viewed from the seven aspects of bias?
2. Research Methods
This study will use primary data as a data source. To obtain information directly, one of the methods that will be used by researcher is survey method by using questionnaire instrument in taking this primary data. This questionnaire filling is targeted at people who are in Indonesia and who already have life insurance. The variables to be considered and measured in this study are divided into seven sections. These seven sections are excessive optimism, representativeness, overconfidence, herding effect, availability, confirmation, and framing. The seven parts of this variable will be used to describe the bias aspect of insurance purchasing decisions.
In excessive optimism, a person's decisions will be based on optimism on the profitable and underestimate the less favorable (Malin, 2015). Excessive optimism can also be a person's optimism about the positives of life insurance choices. This indicator can be measured by several statements, namely the time of purchase of life insurance, the proportion of protection with investment, the belief of the benefits of protection owned, and the belief of investment benefits.
Representativeness is a biased aspect that arises when a person perceives a thing can be represented from another. This indicator can be measured by the number of statements, namely the views of people about insurance associated with an investment, the views of people about critical illness protection given life insurance, and the views of people on insurance products are often heard.
Overconfidence is a biased aspect that arises when a person exaggerates his ability. Indicators of this bias aspect can be measured from several statements, namely the need for an explanation of the benefits of insurance products from insurance agents, the ability of a person to understand the benefits of insurance products, the needs of other people's opinions in the selection of life insurance, and understanding of insurance regulations.
when there are friends who become life insurance agents offer, and the desire to keep the comfort of agents insurance.
Availability is a biased aspect that affects how people make risk estimates (Yudkowsky, 2008). In insurance, this aspect can be measured by several statements, namely purchasing protection benefits for frequent risks, not purchasing protection benefits for rare risks, not purchasing protection benefits for unheard risk, reluctance to buy life insurance products that are not never heard-even though the product is better, and buy insurance products that are often heard. In life insurance, a person exposed to a confirmation bias will seek information that only supports his view subjectively. This indicator can be viewed on the basis of a desire to seek positive information about insurance products and trusted insurance companies, neglect negative information about trusted products and insurance companies, desire to seek negative information about products and insurance companies that are not trusted, ignoring positive information about products and insurance companies which is not trusted.
Framing is a process whereby people develop certain concepts or direct the way of thinking about a thing (Chong and Druckman, 2007). Based on this, the framing effect bias indicator can be measured based on several statements regarding investment, namely the accuracy of insurance as an investment vehicle, investment confidence in insurance as well as other investments, and confidence in the benefits of investment in insurance.
The number of samples to be used is as many as 168 respondents consisting of 34 respondents obtained from the results of manual questionnaires and 134 respondents through online.
3. Results & Discussion
Based on the data that has been obtained, it appears that the majority of respondents came from the city of Surabaya 47%, followed by the city of Jakarta 8%, and Malang 4%. Respondents from Samarinda, Semarang and Sidoarjo cities each represented 3%. Respondents from Banjarmasin, Makassar, Tolitoli, and Medan were each at 2%. For respondents coming from other cities each 1%.
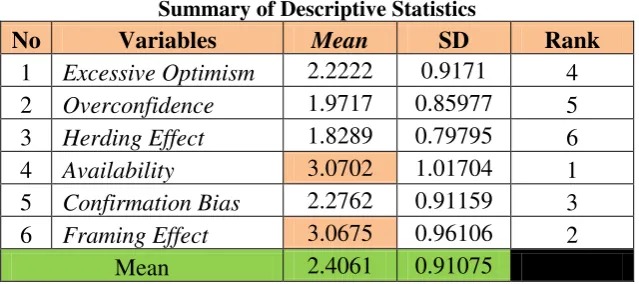
Based on the description of the respondent's answer, the entire description can be summarized in table 1
Table 1
Summary of Descriptive Statistics
No Variables Mean SD Rank
1 Excessive Optimism 2.2222 0.9171 4 2 Overconfidence 1.9717 0.85977 5 3 Herding Effect 1.8289 0.79795 6 4 Availability 3.0702 1.01704 1 5 Confirmation Bias 2.2762 0.91159 3 6 Framing Effect 3.0675 0.96106 2
The mean value can meet the standards if it is above 3 because the interval scale used is the scale of intervals 1 through 5. Based on table 1, the variables that have met the standards are availability and framing effect variables. For other variables do not meet the standards because it has a mean value below 3. Of these six variables, most have a standard deviation below 1. When viewed from the mean value of each variable, the dominant bias aspect is found in the purchase decision making insurance the soul is availability and followed by the framing effect bias aspect. Aspects of excessive optimism bias, overconfidence, herding effect, and confirmation bias are not included in life insurance decision making.
3.1. Excessive Optimism
The first relates to the mean value of the indicator "You do not need life insurance at a young age because you are optimistic about your health". The second relates to the mean value of the indicator "You only buy life insurance with a small premium because you are optimistic about your health". The third relates to the meaning of the mean value of the indicator "You do not need the benefit of accident protection because you believe it will not be affected by accident". The fourth is an overall explanation of this aspect of bias. In the first indicator of the excessive optimism variable, the mean value is less than 3. This indicator indicates that respondents need life insurance at a young age. This is because respondents are not optimistic about their health even when they are young. Respondents are not optimistic about their health because no one can predict a person's health in the future. Based on this, of course, many respondents who buy life insurance even when still young. In the second indicator of the excessive optimism variable, the mean value of is also smaller than 3. This indicator can be attributed to the benefits received by respondents where an increasingly large premium can provide greater protection benefits. In this indicator, respondents prefer to buy life insurance with a large premium because respondents are not optimistic about their health in the future. The benefits of large health protection can provide better protection for respondents from health risks. The third indicator of the excessive optimism variable, the mean value of is also smaller than 3. This indicator indicates that the respondent is not optimistic will always avoid an accident. No one can predict that he will be free from an accident at any time. Therefore, respondents choose to have the benefit of accident protection to reduce the risk received when having an accident.
3.2. Overconfidence
The first relates to the meaning of the mean value of the indicator "You do not need any explanation from others about the full benefits of life insurance products". The second relates to the meaning of the mean value of the indicator "You are confident in your ability to understand life insurance products". The third relates to the meaning of the mean value of the indicator "You do not need the opinions of others about life insurance". The fourth relates to the mean value of the indicator "You do not need an understanding of insurance regulations". The fifth is an overall explanation of this aspect of bias. In the first indicator of the overconfidence variable, the mean value is less than 3. This indicator shows that respondents do not overestimate the knowledge they have and do not underestimate the information surrounding them. Respondents also did not overestimate their ability to understand life insurance products that vary widely. Therefore, respondents need help from others to get an explanation about the benefits of a life insurance product so that they can understand well about life insurance products. In the second indicator of the overconfidence variable, the mean value is less than 3. This indicates that respondents do not overestimate their ability to understand a life insurance product. Therefore, respondents need the help of others in understanding life insurance products as described previously. With the help of others, respondents can understand better life insurance products. In the third indicator of the overconfidence variable, the mean value is less than 3. This indicator shows that respondents do not overestimate the accuracy of the information they have. Therefore, respondents need the opinions of others about life insurance. Respondents do not underestimate the information around it so will consider all the opinions they receive. In the fourth indicator of the overconfidence variable, the mean value is less than 3. This indicates that respondents also do not exaggerate the knowledge and accuracy of the information they have. Therefore, respondents do not underestimate information about insurance regulations. Respondents need an understanding of the existing insurance regulation so that the respondent can follow the regulation well. One example of an insurance regulation is the rules in the policy book. In addition, procedures to make life insurance claims also need to be considered in order to avoid mistakes or misunderstandings when making claims.
Overall, the average value for overconfidence variables reaches 1.9717 where this value is less than 3. This indicates that the overconfidence bias aspect is not found in the life insurance decision-making process. This is seen in respondents who do not exaggerate the knowledge and accuracy of the information they have about life insurance products so that respondents do not underestimate the information that is around the respondents. In addition, respondents also do not exaggerate their ability in the process of understanding life insurance products. Based on this, respondents will tend to seek information that is around to understand life insurance better. Respondents will also seek the help of others to obtain as much information as possible.
The first relates to the mean value of the indicator "You have life insurance because you are only following your friends who are buying life insurance". The second relates to the mean value of the indicator "You have life insurance because you only follow friends who already have life insurance". The third thing relates to the mean value of the indicator "You are reluctant if you do not buy life insurance on a friend who is a life insurance agent". The fourth relates to the mean value of the indicator "You buy life insurance because life insurance agents continue to offer you products". The fifth is an overall explanation of this aspect of bias. In the first indicator of the herding effect variable, the mean value is less than 3. This indicator indicates that the respondent did not follow many people for easy and safe reason to make a decision. Respondents think critically of decisions taken by many people. Therefore, respondents will seek information as much as possible despite the lack of information. Respondents consider any decisions to be taken based on the information already received. In the second, third and fourth indicators of the herding effect variable, the mean value are less than 3. These three indicators indicate that the respondent did not make a decision just to maintain a sense of security and sex from social pressure. The respondents did not directly follow the social pressure because the respondent remained critical thinking before making a decision. If the decision taken is indeed the best decision for the respondent, then the respondent will certainly follow the social pressure. Respondents certainly will not follow social pressure if the decision is detrimental to the respondent.
Respondents think critically of decisions taken by many people. Therefore, respondents will seek information as much as possible despite the lack of information. Respondents consider any decisions to be taken based on the information already received. In the second, third and fourth indicators of the herding effect variable, the mean value are less than 3. These three indicators indicate that the respondent did not make a decision just to maintain a sense of security and sex from social pressure. The respondents did not directly follow the social pressure because the respondent remained critical thinking before making a decision. If the decision taken is indeed the best decision for the respondent, then the respondent will certainly follow the social pressure. Respondents certainly will not follow social pressure if the decision is detrimental to the respondent.
3.4. Availability
value is 3. This indicator indicates that some respondents are still sufficient to have the benefit of protection that the risks often occur and some still choose to have other additional protection benefits even though the risks are not frequent. Based on this, there are some respondents who keep making risk estimates and some are not. Respondents who do not make risk estimates have the idea that the risk will come unexpectedly. Therefore there is a need for protection before the risk comes. In the second and third indicators of the availability variable, the mean value is less than 3. This indicator indicates that the respondent also did not estimate the risk. Respondents thought that risk could come at any time. It is this thinking that makes respondents unsure not to buy certain protection benefits that are rare and unheard of. Respondents are still thinking that the risks are rare and that never happens is a risk that may still occur in the future. In the fourth and fifth indicators of the availability variable, the mean value is greater than 3. This indicator indicates that the respondent still pays attention to the intensity of the emergence of information about insurance products. The less information heard about a life insurance product causes the respondent to be reluctant and hesitant to buy the life insurance product even if the product is good. Therefore, respondents prefer to purchase life insurance products that are often heard. In addition, respondents also opted to purchase life insurance products whose information is easily accessible.
Overall, the mean value for the availability variable reaches 3,0702 where this value is greater than 3. This value indicates that the aspect of availability bias is in the life insurance decision making. This is seen in the reluctance of respondents to buy life insurance that has never been heard and prefer life insurance products that are often heard. In addition, respondents also chose certain protection benefits that often occur. Based on this it can be concluded that the more often a thing happens to cause people to believe it will be easy to happen and the more often a thing is heard then the person more remember it.
3.5. Confirmation Bias
information about a product they do not trust. This is shown in the mean values of the third and fourth indicators of confirmation variables where the value is less than 3. The same is true when respondents are confronted with good information about life insurance companies they do not trust. Respondents still pay attention to the information as a consideration. This is shown in the fifth indicator where the mean is less than 3. Based on this, it can be mentioned that respondents do not have a tendency to pay attention to information that supports their opinions.
Overall, the mean value for the confirmation variable bias reaches 2.2762 where this value is smaller than 3. This value indicates that the bias confirmation bias is not found in the life insurance decision making. This is seen in respondents who are not only looking for information that supports their opinions. Respondents will seek information that is both supportive and non-supportive. Thus the respondents will obtain information very much and can determine the best decision making in the purchase of life insurance.
3.6. Framing Effect
The first relates to the meaning of the mean value of the indicator "You assume that life insurance is the right investment vehicle". The second relates to the mean value of the indicator "You assume that the investment benefits received on life insurance are the same as in other investments". The third point relates to the meaning of the mean value of the indicator "You assume that you will benefit great investment in life insurance". The fourth is an overall explanation of this aspect of bias. In the first and third indicators of the framing effect variable, the mean value is greater than 3. This indicates that the respondent considers life insurance to be an investment vehicle and will benefit greatly. This is what causes respondents to misinterpret the principle of insurance itself. This insurance principle has been directed from the principle of risk management to the principle of investment. The effect of this directive is called framing effect. In the second indicator of the framing effect variable, the mean value is less than 3. This indicates that the respondent does not have the assumption that the investment benefits are the same as other investments. This assumption appears from their experience when they see the value of the investment they receive. Although the respondents considered the investment returns not the same as other investments, but the decision to purchase this insurance already has the framing effect bias aspect where the respondents consider that life insurance can be a means of investment.
Overall, the mean value for the framing effect variables reached 3.0675 where this value is greater than 3. This value indicates that the framing effect bias aspect is found in the life insurance decision making. This is seen in the way the respondent's thinking has been directed. Respondents consider that life insurance is an appropriate investment tool. Life insurance is not really a means of investment but is one means to avoid unexpected risks.
3.7. Descriptive Statistics based on Respondent's Characteristics
3.7.1. Descriptive Statistics by gender
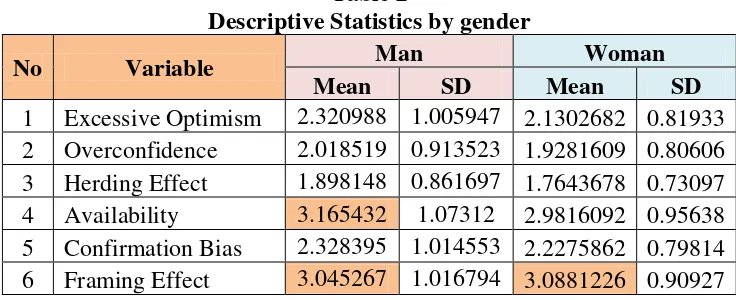
Table 2 shows that there is no excessive optimism, overconfidence, herding effect, and confirmation bias in making life insurance decisions for both male and female respondents. This is the same as the previous discussion. In the decision to purchase life insurance there are aspects of framing effect bias both male and female respondents. However, the aspect of availability bias is only found in male respondents. If taken by sex, then the main bias aspect that dominates the decision of purchasing life insurance for men is availability, while for women is framing effect.
Table 2
Descriptive Statistics by gender
No Variable Man Woman
Mean SD Mean SD
1 Excessive Optimism 2.320988 1.005947 2.1302682 0.81933 2 Overconfidence 2.018519 0.913523 1.9281609 0.80606 3 Herding Effect 1.898148 0.861697 1.7643678 0.73097 4 Availability 3.165432 1.07312 2.9816092 0.95638 5 Confirmation Bias 2.328395 1.014553 2.2275862 0.79814 6 Framing Effect 3.045267 1.016794 3.0881226 0.90927
Based on table 2 for the aspect of availability bias, male respondents are more biased than women. This appears in men having 4 indicators of bias while women have 2 indicators of bias. Male respondents have the idea that only sufficient protection benefits are certain where the risks are rare and frequent. Female respondents have different ideas in which they prefer to have all the benefits of protection even though the risks have never occurred to date. Two similar things to male and female respondents regarding the bias availability are that they are reluctant to buy life insurance that has never been heard even though the product is better and prefers to buy life insurance products that are often heard. Ease of access to information and the high intensity of receiving information about an insurance product to be the best choice, not from the product. This becomes biased because the best products for the respondents are not the best because of the difficult access to information and the low intensity of information received. But women are better in this aspect because women have more information than men. Langenhoff and van Acker (2008) stated that "women visit a doctor and pharmacy more often than men and that the relationship between gender and visits is significant". This statement explains that women visit doctors and pharmacies more often than men, which causes women to receive more information about the risks that occur in the future even though this has never happened to date.
effects, where life insurance has risk management principles, not investment. Therefore, male and female respondents alike have a biased framing effect on life insurance.
3.8. Descriptive Statistics by Age
Table 3 has shown that excessive optimism bias, overconfidence, herding effect, and confirmation bias are not present in respondents aged 18 to 38. This is the same as the previous discussion.
For the aspect of availability and framing effect bias is found in the respondents aged 18-31 years while for the age of 32-38 years of respondents there is no aspect of this. This is because respondents increasingly understand that all insurance products are often heard not necessarily well. In addition, respondents age 32-38 also understand that risks can happen anytime so they are not sure that having the protection that the risk often happens is enough for them. This causes respondents with age 32-38 years will benefit certain protection even though the risk is very rare. In addition, respondents with the age of 32-38 years are also not easy to be directed way thinking because respondents think more critical and not easy to be directed. Based on table 3 can also be concluded that for respondents aged 18-24 years there are aspects of bias availability as the most dominant aspect, while for the age of 25-31 years is framing effect.
Table 3
Descriptive Statistics by Age
No Variable 18-24 25-31 32-38
Mean SD Mean SD Mean SD
1 Excessive Optimism 2.216374 0.819133 2.222222 0.970076 2.055556 0.830566 2 Overconfidence 1.877193 0.851387 2.036111 0.870407 1.770833 0.888094 3 Herding Effect 1.776316 0.809075 1.861111 0.806303 1.812500 0.834229 4 Availability 3.150877 0.963041 3.026667 1.048252 2.950000 1.093598 5 Confirmation Bias 2.207018 0.752537 2.300000 0.946757 2.216667 1.008394 6 Framing Effect 3.052632 0.946802 3.122222 0.951888 2.888889 1.090538
3.9. Descriptive Statistics by Length of Life Insurance Ownership
Table 4 shows that excessive optimism, overconfidence, herding effect, and confirmation biases are not available to respondents. This is the same as the previous discussion. For respondents with long life insurance ownership less than 1 year to 3 years there are aspects of bias availability and framing effect. For respondents with long life insurance between 4 years to 6 years there is no aspect of any bias. For respondents who have 7-9 years life insurance, there are aspects of availability bias.
still prefer insurance products that are often heard because of the ease of access to information and the intensity of receiving high information. For respondents aged 7-9 years also still have the same view because 60% of respondents 7-9 years life insurance owners are young respondents (ages 18-31 years). Respondents who have life insurance less than 1 year and 1-3 years also have a wrong view of the principle of life insurance due to the framing effect. However, for respondents who already have life insurance for 4-6 years and 7-9 years is not there this bias due to experience during life insurance. This experience resulted in a change in the way of thinking about life insurance.
Table 4
\Descriptive Statistics by Length of Life Insurance Ownership
No Variable <1 year 1-3 year
Mean SD Mean SD
1 Excessive Optimism 2.648649 0.938733 2.263158 0.924906 2 Overconfidence 1.972973 0.868967 2.013158 0.878129 3 Herding Effect 1.932432 0.764433 1.811404 0.811261 4 Availability 3.205405 0.994789 3.143860 0.969120 5 Confirmation Bias 2.421622 0.899981 2.266667 0.877853 6 Framing Effect 3.153153 0.903044 3.228070 0.908309
No Variable 4-6 year 7-9 year
Mean SD Mean SD
1 Excessive Optimism 1.993333 0.793758 1.850000 0.838591 2 Overconfidence 1.915000 0.761846 2.037500 1.025867 3 Herding Effect 1.715000 0.786234 1.887500 0.827508 4 Availability 2.940000 1.061241 3.030000 1.078998 5 Confirmation Bias 2.140000 0.899496 2.440000 1.038732 6 Framing Effect 2.880000 0.921383 2.983333 1.239180
4. Conclusion
Suggestions that can be given by researchers for the development of further research are Conduct research development that also pays attention to the diversity of types of work faced by the people of Indonesia. Conducting research on bias aspect analysis based on the characteristics of Indonesian society so as to know in detail which aspects of bias are dominant in each characteristic of Indonesian society.
References
Ackert L.F., and R. Deaves. 2010. Behavioral Finance: Psychology, Decision Making, and Markets. South-Western Cengage Learning: Mason, USA. Alaydroes, L. 1996. Perbedaan Persepsi Terhadap Produk Asuransi Jiwa Ditinjau
dari Keikutsertaan Sebagai Pemegang Polis Asuransi pada Asuransi Jiwa Bersama Bumiputera Rayon Madya Manyar Kertoajo pada Warga Usia Dewasa Awal di Kelurahan Nginden Jangkungan Surabaya. Skripsi. Fakultas Psikologi Universitas Surabaya.
Bashir, T., A. Javed, U. Ali, U. I. Meer, and M. M. Naseem. 2013. Empirical Testing of Heuristics Interrupting The Investor’s Rational Decision Making. European Scientific Journal,Vol 9 (28): 432-444.
Bathia, S. 2015. The Power of the Representativeness Heuristic. Working Paper. University of Warwick Coventry.
Baumann, S. 2012. How to Amend Biased Risk Perception in Enterprice Risk Management. Bachelor Thesis.Berlin School of Economics and Law.
Bogan, V. and D. Just. 2009. What Drives Merger Decision Making Behavior? Don’t Seek, Don’t Find, and Don’t Change Your Mind. Journal of Economic Behavior & Organization, Vol 72: 930-943.
Campbell, S.D. and S.A. Sharpe. 2007. Anchoring Bias in Consensus Forecasts and its Effect on Market Prices. Working Paper. Federal Reserve Board. Charness, G., E. Karni, and D. Levin. 2010. On The Conjunction Fallacy in
Probability Judgment: New Experimental Evidence Regarding Linda. Journal of Games and Economic Behavior, Vol 68: 551-556.
Chong, D. and J. M. Druckman. 2007. Framing Theory. Annual Rev. Polit Science,Vol 10: 103-126.
Djojosoedarso, S. 1999. Prinsip-prinsip Manajemen Risiko and Asuransi. Salemba Empat: Jakarta.
Friedman, M. and L.J. Savage. 1948. The Utility Analysis of Choices Involving Risk. The Journal of Political Economy, Vol 56 (4): 279-304.
Hair, J. F., W. C. Black, B. J. Babin, and R. E. Andersion. 2009. Multivariate Data Analysis (7th Edition). New Jersey: Prentice Hall.
Indriatno, I. and R. Irwinsyah. 1998. Aplikasi Analisis Tabulasi Silang (Crosstab) dalam Perencanaan Wilayah and Kota. Jurnal PWK, Vol 9 (2): 48-59.
Jonas, E., S.S. Hardt, D. Frey, and N. Thelen. 2001. Confirmation Bias in Sequential Information Search After Preliminary Decisions: An Expansion of Dissonance Theoretical Research on Selective Exposure to Information. Journal of Personality and Social Psychology, Vol 80 (4): 557-571.
Kertonegoro, S. 1991. Asuransi Jiwa and Pensiun. Agung’s: Jakarta.
Kontan. 2015. Jumlah Nasabah Asuransi Jiwa Berkurang Hingga 39%.
http://keuangan.kontan.co.id/news/jumlah-nasabah-asuransi-jiwa-berkurang-hingga-39 (diunduh tanggal 23 Oktober 2015).
Kunreuther, H. and M. Pauly. 2015. Insurance Decision-Making for Rare Events: The Role of Emotions. Working Paper. The Warton School, University of Pennsylvania.
Loewenstein, G., J.Y. Friedman, B. McGill, S.Ahmad, S. Linck, S. Sinkula, J. Beshears, J.J. Choi, J. Kolstad, D. Laibson, B.C. Madrian, J.A. List, K.G. Volpp. 2013. Consumers Misunderstanding of Health Insurance. Journal of Health Economics,Vol 32: 850-862.
Loewenstein, G. and R.H. Thaler. 1989. Anomalies Intertemporal Choice. Journal of Economic Perspectives, Vol 3 (4): 181-193.
Malin, M. 2015. Psychological Biases and Decision Making in Finance – Pitfalls to Avoid. MBA White Paper. Griffith University.
Mallick, L.R. 2015. Biases in Behavioural Finance: A Review of Literature. Journal of Advances in Business Management, Vol 1 (3): 100-104.
Marbun, L.R. 2010. Aspek Bias Psikologis dalam Pengambilan Keputusan Hutang Studi pada Industri Tempe and Kripik Tempe di Desa Karangtengah Prandon Kabupaten Ngawi Provinsi Jawa Timur. Skripsi. Fakultas Ekonomika dam Bisnis Universitas Kristen Satya Wacana.
Neumann, J.V., and O. Morgenstern. 1944. Theory of Games and Economic Behavior. Princeton University Press: Princeton, New Jersey.
Novia, A. and M.R. Rita. 2014. Aspek Bias Dalam Pengambilan Keputusan Pembelian Produk Asuransi Jiwa. Skripsi. Fakultas Ekonomika and Bisnis Universitas Kristen Satya Wacana.
Nofsinger, J.R. 2005. The Psychology of Investing,2nd ed. Pearson Prentice Hall: New Jersey.
Onsomu, Z.N. 2014. The Impact of Behavioral Biases on Investor Decisions in Kenya: Male Vs Female. International Journal of Research in Humanities, Arts and Literature,Vol 2 (6): 87-92.
Puri, M. and D.T. Robinson. 2007. Optimism and Economic Choice. Journal of Financial Economic, Vol 86: 71-99.
Qadri, S.S. and M. Shabbir. 2014. An Empirical Study of Overconfidence and Illusion of Control Biases, Impact on Investor’s Decision Making: An Evidence from ISE. European Journal of Business and Management, Vol 6 (14): 38-45.
Rabin, M. and J.L. Schrag. 1999. First Impressions Matter: A Model of Confirmatory Bias. The Quarterly Journal of Economics, Vol 1: 37-82. Riddel, M. and D. Hales. 2013. Risk Misperceptions, Advantageous, and Demand
for Cancer Insurance. Working Paper.University of Nevada.
Salim, A.A. 1989. Dasar-Dasar Asuransi (Principles of Insurance). CV Rajawali: Jakarta.
Shefrin, H. 2007. Behavioral Corporate Finance: Decisions that Create Value. McGrwall-Hill/Irwin: New York.
Soekarto. 1987. Materi Pokok Dasar-Dasar Asuransi Modul 1-3. Karunia: Jakarta.
Stroe, M.A. 2014. Insurances and Consumer Perception in The Romanian Insurance Market. Procedia Economics and Finance, Vol 15: 1717-1723. Sugiyono. 2006. Statistika untuk Peneltian. Alfabeta: Bandung.
Suharnan. 2005. Psikologi Kognitif Edisi Revisi. Srikandi: Surabaya.
Tversky A., and D. Kahneman. 1981. The Framing of Decisions and The Psychology of Choice. Science, Vol 211 (4481): 453–458.
Tversky A., and D. Kahneman. 1983. Extensional Versus Intuitive Reasoning: The Conjunction Fallacy in Probability Judgment. Psychological Review, Vol 90 (4): 293-315.
Van Acker, J. and W. Langenhoff. 2008. Analysis and Implications of The Consumer Decision Process for Choosing a Health Insurance. Bachelor Thesis.Erasmus School of Economics.
Veeraraghavan, K., and M. Anbalgan. 2011. Heuristic Behavior on The Investors. International Journal of Enterprise Innovation Management Studies, Vol 2 (2): 142-149.