PROCEDIA
Social and Behavioral Science – 10
thInternational Strategic
Management Conference
Adopting mission and vision statements by employees: The case
of TAV Airports,Gamze Orhan, 2014
Nama Mahasiswa
: Joel Kaherson Sembiring
NIM
: 7143220020
Dosen Pengampu
: Dr. Arfan Ikhsan, SE., M.Si
Mata Kuliah
: Manajemen Strategik
PROGRAM STUDI S1 AKUNTANSI
FAKULTAS EKONOMI-UNIVERSITAS NEGERI MEDAN
MEDAN
AGUSTUS 2017
CRITICAL JOURNAL REVIEW
MK. MANAJEMEN STRATEGIK
PRODI S1 AK-FE
1
Judul Jurnal
:
Adopting mission and vision statements by employees:
The case of TAV Airports
Penulis
:
Gamze Orhan
Institusi Penulis
:
Anadolu University, Turkey
Nama Jurnal/Tahun Penerbitan :
Procedia – Social and Behavioral Science 150 / 2014
Materi Review :
1.
Latar Belakang
Visi dan Misi adalah alat manajemen yang sangat penting yang tidak dapat dipisahkan
dari strategi perusahaan dan hal itu mempersiapkan perusahaan untuk mencapai
kinerja yang tinggi dan untuk bertahan dalam jangka waktu yang lama. Sejumlah studi
menunjukkan bahwa memiliki visi dan misi mempengaruhi aspek terpenting dari kinerja
perusahaan. Business Week melaporkan bahwa perusahaan dengan pernyataan misi
yang baik memiliki pengembalian 30% lebih tinggi pada langkah-langkah keuangan
tertentu daripada perusahaan yang tidak memiliki dokumen seperti itu. (David dan
David, 2003). Tapi , bagaimanapun juga, beberapa studi telah menemukan bahwa
memiliki visi dan misi tidak langsung berkontribusi positif terhadap kinerja keuangan
(Sufi dan Lyons, 2003; Benligiray et al, 2010.), Sejumlah studi akademis menunjukkan
bahwa ada hubungan positif antara visi, misi dan kinerja organisasi (Bart dan Baetz,
1998; Bart dan Baetz, 1995; Bart, 1997; Dogan dan Hatipoglu, 2009). Diperkirakan
bahwa, untuk ekspresi dari misi dan visi untuk menciptakan efek positif pada kinerja
organisasi, pertama-tama, misi dan visi organisasi harus diketahui dan diterima oleh
karyawan. Dalam hal ini, penelitian kami berfokus pada mencari tahu tingkat
pengetahuan, persepsi dan opini karyawan tentang organisasi mereka sendiri.
2.
Tujuan
Penelitian ini mempunyai tujuan sebagai berikut :
1. Mencari tahu tingkat pengetahuan, persepsi dan opini karyawan tentang organisasi
mereka sendiri.
3.
Isi Jurnal
Jurnal ini terdiri dari 4 bagian dan disusun dengan sistematika sebagai berikut :
(1)
Introduction
2
(2)
Literature Review
Pada bagian ini dibahas bahwa yang terbaik adalah membagikan visi-misi
perusahaan kepada seluruh karyawan dan dibahas juga apa saja yang tercakup
dalam hal membagikan visi-misi kepada karyawan. Penulis juga menyampaikan
bahwa sudah ada banyak penelitian yang mencari tahu hubungan antara Visi-Misi
terhadap kinerja organisasi, namun masih sedikit penelitian yang bertujuan untuk
mengetahui apakah karyawan sudah benar-benar memahami dan mengadopsi
Visi-Misi perusahaan. Dan diberitahu juga penelitian terdahulu yang sejenis.
1. Membagikan Visi-Misi Kepada Karyawan
Berbagi visi dan misi tidak berarti hanya memberitahukannya kepada
karyawan, tetapi lebih jauh juga mencakup membuat hal itu dipelajari,
diadopsi dan dilatih/diparktekkan oleh karyawan. Pemimpin bertanggung
jawab untuk menciptakan dan memelihara visi dan misi, tetapi hal itu dapat
terlaksana dengan dukungan seluruh karyawan dalam suatu organisasi.
(Stovel dan Bontis, 2002)
2. Pentingnya karyawan Mengadopsi Visi-Misi dan Penelitian Terdahulu
Aydemir (2000) menyoroti pentingnya berbagi visi dalam organisasi
untuk mengembangkan organisasi yang bisa belajar. Dogan (2008)
membandingkan
persepsi
dan sikap
antara
personil
akademik dan
administrasi (non-akademik) di universitas. Ia menemukan bahwa tenaga
akademik dan administrasi percaya perlunya visi dan misi untuk universitas
mereka tetapi, mereka percaya bahwa visi dan misi universitas tidak perlu
asli, meyakinkan dan memotivasi. Dia juga menyoroti ada perbedaan tingkat
pengetahuan tentang visi dan misi organisasi antara personel akademis dan
administrasi.
3
dalam mempertahankan mereka dalam organisasi. Kim dan Lee (2007)
menemukan bahwa keterikatan misi masih merupakan faktor penting dalam
retensi karyawan di sebuah organisasi non-profit meskipun ketidakpuasan
dengan gaji, peluang operator dan kondisi kerja lainnya.
(3)
Metodologi
Penelitian ini dilakukan dengan melakukan survey terhadap karyawan bandara TAV.
Kuesioner diberikan kepada total 9530 karyawan TAV Bandara, yang beroperasi di
bidang manajemen bandara domestik dan internasional. Karyawan ini, 2724
dipekerjakan di Istanbul Ataturk Airport, 686 di Izmir, 921 di Ankara Bandara
Esenboga, 29 di Alanya Gazipaşa Airport, dan sisanya 5170 berada di perusahaan
jasa (ATU, BTA, TAV Management Services, TAV Informatika , TAV Keamanan
Swasta) di Turki. Perusahaan TAV Bandara internasional, manajemen bandara dan
Havas, yang merupakan pemangku kepentingan, dikeluarkan dari ruang lingkup
penelitian ini. Kuesioner berbasis web dikirim ke karyawan melalui e-mail. Dalam
waktu sekitar satu bulan, total 453 karyawan Bandara TAV menanggapi.
(4)
Analisa dan hasil
Untuk mengukur tingkat penggunaan perangkat manajemen strategi, tingkat
kepuasaan penggunaan perangkat manajemen strategi dan prioritas penggunaan,
skala perangkat manajemen strategis yang dibuat oleh Rigby (2009) digunakan.
Hasil dan analisa dari penelitian ini adalah sebagai berikut :
a. Dari survey yang dilakukan, rerata penggunaan perangkat manajemen strategis
berdasarkan klasifikasi hotel, diperoleh bahwa CRM merupakan perangkat yang
sering digunakan oleh semua hotel berbintang. Vision / Mission Statement,
merupakan perangkat kedua yang sering digunakan oleh hotel bintang empat
dan lima, sedangkan hotel bintang tiga lebih fokus pada
outsourcing
. Perangkat
ketiga yang sering digunakan adalah Total Quality Manajemen. Sedangkan
Balanced Scorecard dan BCG Growth-Share matriks banyak tidak diketahui
jelas oleh para manager hotel.
4
c. Dari hasil analis menunjukkan bahwa urutan pertama, kedua dan ketiga faktor
penting dalam membentuk preferensi perangkat manajemen strategi hotel
adalah
innovative Activities, organizational culture, considering possible
changes do Mae decisions,
dan
Customs demands Ana espectations.
d. Berdasarkan hasil analisa ANOVA, terdapat perbedaan antara prioritas
preferensi perangkat manajemen dengan klasifikasi hotel, diantaranya sebagai
berikut :
-
Hotel bintang empat lebih mempertimbangan budaya organisasi, kebutuhan
pelanggan, dan ekspektasi yang kuat daripada hotel bintang lima dan
bintang tiga.
-
Sustainability initiatives
merupakan faktor penting bagi hotel bintang lima dan
empat, namun tidak bagi hotel bintang tiga.
-
Sebuah struktur yang kuat untuk mengoperasikan semua jenis kegiatan
dengan sendirinya, memberikan kualitas layanan bagi pelanggan dan
kesadaran kemampuannya adalah faktor yang sangat penting untuk hotel
bintang empat.
-
Outsourcing juga dianggap sebagai faktor penting untuk hotel bintang tiga
dibandingkan dengan hotel bintang empat.
4.
Kesimpulan
Dari hasil penelitian ini dapat disimpulkan bahwa :
a.
Penelitian ini menunjukkan bahwa hotel, yang berusaha untuk meningkatkan
profitabilitas mereka dan potensi pelanggan di masa lalu, menggunakan alat yang
didasarkan pada kepuasan pelanggan seperti CRM,
Vision / Mission Statement
dan
TQM.
Procedia - Social and Behavioral Sciences 150 ( 2014 ) 251 – 262 Available online at www.sciencedirect.com
ScienceDirect
1877-0428 © 2014 The Authors. Published by Elsevier Ltd. This is an open access article under the CC BY-NC-ND license (http://creativecommons.org/licenses/by-nc-nd/3.0/).
Peer-review under responsibility of the International Strategic Management Conference. doi: 10.1016/j.sbspro.2014.09.051
10
thInternational Strategic Management Conference
Adopting mission and vision statements by employees: The
case of TAV Airports
Gamze Orhan
*, Dilek Erdo
ğ
an, Vildan Durmaz
Anadolu University, Eskişehir, 26555, Turkey
Abstract
Mission and vision statements are popular both in the extant literature and the practice for the companies’ strategic management. While many studies have been realized about relationship between vision-mission statements and firm performance, there is very little studies which ask the answer if vision and mission is adopted by employees in an organization. Our study focus on the perspectives of employees about the vision and mission statements of their firms in which they work. Based on a survey of employees in TAV Airports, this paper aimed to explore the employees’ state of awareness, perceptions and attitudes towards the firm’s vision and mission statements.
© 2014 Published by Elsevier Ltd. Selection and/or peer-review under responsibility of the 10th International Strategic Management Conference
Keywords: Mission and vision; Employee knowledge and opinions; Level of education; Working position
1.Introduction
Mission and vision are very important management tools which cannot be separated from a corporate strategy and they provide firms to achieve high performance and to survive in a long time period. Developing a vision statement is often considered the first step in strategic planning, preceding even development of a mission statement. Many organizations generally have both a vision and mission statement (Ülgen and Mirze, 2007). The vision is the statement of the desired future state of the
*
Corresponding author. Tel. + 90-222-321-3550 / 6833 fax. +90-222-322-1619 Email address: [email protected]
© 2014 The Authors. Published by Elsevier Ltd. This is an open access article under the CC BY-NC-ND license (http://creativecommons.org/licenses/by-nc-nd/3.0/).
252 Gamze Orhan et al. / Procedia - Social and Behavioral Sciences 150 ( 2014 ) 251 – 262
organization within the arena of competition. It is a future orientated term (Raynor, 1998). The mission statement is a declaration of an organization’s “reason for being”. It answers the vitally important questions “What is our business?Why do we exist? What are we trying to accomplish?”(Bart, 1997). A good mission statement describes an organization’s purpose, products and services, markets, philosophy, and basic technology (Kemp and Dwyer, 2003). A vision statement describes what the firm wants to be in the future while a mission statement describes what the firm does and mission is a special task which is given to the firm to reach the desired future of the firm defined in the vision.
A number of studies show that having a vision and a mission affects a firm’s most aspects of organizational performance. Business Week reports that firms with well-crafted mission statements have a 30% higher return on certain financial measures than firms that lack such documents (David and David, 2003). In addition, however, some studies have found that having vision and mission statements does not directly contribute positively to financial performance (Sufi and Lyons, 2003; Benligiray et al., 2010), a number of academic studies suggest that there is a positive relationship between vision, mission statements and organizational performance (Bart and Baetz, 1998; Bart and Baetz, 1995; Bart, 1997; Doğan and Hatipoğlu, 2009). It is thought that, for the expressions of mission and vision to create a positive effect on the organizational performance, first of all, the organization’s mission and vision must be known and accepted by the employees. In this regard, our study focuses on finding out the employees’ knowledge levels, perceptions and opinions about their own organization.
2.Literature Review
Firms create their vision and mission statements in written form and announce to their employees and external shareholders. However, just getting vision and mission statements on the walls and web sites of the company is not sufficient (Benligiray et al., 2013). To have an efficient vision and mission, it is necessary to share them with the employees. Sharing vision and missions mean not to just tell, also make the statements being learning, adopting and exercising by the employees. Leaders are responsible for creating and maintaining vision and mission statements, but it can be achieved through whole employees in an organization. (Stovel and Bontis, 2002). After the employees adopt the vision and mission of the firm, they can make over into their own missions to achieve the overall goals of the organization. Several works suggest that vision and mission of an organization can impact positively on employee performance providing a high levels of commitment of the employees and shaping their behaviors in line with organization’s objectives (Bart et al., 2001; Campbell, 1997; Collins and Poras, 1996; Ireland and Hitt, 1992; Klemm et al., 1991). A vision and mission statement for the organization can serve as powerful vehicles to help achieve shared understanding and support from employees for the firm’s strategic plan road map. Employees want to believe that their efforts are important in supporting the organization to achieve exciting, satisfying and worthy goals (Stokely, 2004).
253
Gamze Orhan et al. / Procedia - Social and Behavioral Sciences 150 ( 2014 ) 251 – 262
highlights the importance of examining the views of staff both in senior management and different groups of employees in other positions in not-for-profit hospitals. They found that there is a variance between the views of senior management staff and the others. Darbi (2012) provides the knowledge and perceptions of employees of a public but profit oriented institution about the vision and mission statements of the organization. Brown and Yoshioka (2003), with a work in a non-profit organization, investigates the relationship between employee attitudes toward the mission and their intention to remain with the organization. They suggest that mission might be more effective in attracting employees but less effective in retaining them in the organization. Kim and Lee (2007) found that mission attachment is still an important factor in employee retention in a non-profit organization despite dissatisfaction with pay, carrier opportunities and other working conditions.
The-above mentioned studies mainly focused on the non-profit organizations. Because it is claimed that “Providing a common purpose” is the main driver of fulfilling the organization’s activities (Bart, 1998). Hence, these organizations focus more on mission than strategy (Rangan, 2004). Whereas, we know relatively little about profit oriented organizations. Our study especially emphasizes the knowledge level and attitudes toward the vision and mission statements for a private and profit-oriented organization, TAV Airports Terminal Operating Company.
3.Methodology
3.1. Research Goal
In this study, we aimed to define the level of knowledge and opinions of TAV Airports employees about the vision and mission of their company and vision and mission concepts generally according to their work positions and level of education. In the scope of this research aim, we propose the 12 hypotheses following:
H1: According to employees’ work positions their opinions about the quality of the vision and mission
of the company differ.
H2: According to employees’ level of education their opinions about the quality of the vision and mission of the company differ.
H3: According to employees’ work positions their level of knowledge about the vision and mission
components of the company differ.
H4: According to employees’ level of education their level of knowledge about the vision and mission components of the company differ.
H5: According to employees’ work positions their level of knowledge about the vision and mission of
the company differ.
H6: According to employees’ level of education their level of knowledge about the vision and mission of the company differ.
H7: According to employees’ work positions their perception of the need and conditions for success
for vision and mission differ.
H8: According to employees’ level of education their perception of the need and conditions for success for vision and mission differ.
H9: According to employees’ work positions their level of knowledge about the concepts of vision and
254 Gamze Orhan et al. / Procedia - Social and Behavioral Sciences 150 ( 2014 ) 251 – 262
H10: According to employees’ level of education their level of knowledge about the concepts of vision and mission differ.
H11: According to employees’ work positions their opinions about the renewal the vision and mission
of the company differ.
H12: According to employees’ level of education their opinions about the renewal the vision and mission of the company differ.
3.2. Sample and Data Collection
The questionnaire was administered to a total of 9530 employees of TAV Airports, which operates in the domestic and international airport management field. Of these employees, 2724 were employed at
İstanbul Atatürk Airport, 686 at İzmir Adnan Menderes Airport, 921 at Ankara Esenboğa Airport, 29 at Alanya Gazipaşa Airport, and the remaining 5170 were at service companies (ATÜ, BTA, TAV Management Services, TAV Informatics, TAV Private Security) in Turkey. TAV Airports’ international airport management companies and HAVAŞ, of which it is a stakeholder, were excluded from the scope of this study. The web-based questionnaires were sent to the employees through e-mails. Within about a month, a total of 453 TAV Airports employees responded.
The questionnaire items were adapted from Doğan’s (2008) questionnaire that he used for the employees of Adnan Menderes University. In addition to Doğan’s (2008) items, our questionnaire include items that address the components that make up TAV’s vision and mission. Covering a total of 37 items and 4 sections, our questionnaire’s first section is composed of 6 items that aim to find out the demographics of the participants. In the second section, there are 13 items that aim to elicit the general knowledge of the participants about mission and vision concepts and their specific knowledge level of the mission and vision of their organization. In the third section, first, participants are presented with the mission and vision statements of their organization for their perusal and then given 12 questions aiming to find out participants’ opinions about the nature of the mission and vision statements of their own organization. The fourth section comprises 6 items asking about their opinions of the need and conditions of success for vision and mission.
Questionnaire items are in a 7-point Likert Scale (1: none, 7: very much / 1: I don’t agree at all, 7: I completely agree/ 1: none, 7: very high / 1: very complex, 7: very simple / 1: very far, 7: very close / 1: very low, 7: very high).
3.3. Analyses and Results
Data obtained from 465 respondents were analyzed through the SPSS statistical program. Firstly, to ensure the structural validity and reliability of the scale, and to identify the factor loading of the items, a factor analysis was carried out. Kass and Tinsley (1979) state that if the number of participants exceed 300, regardless of the ratio of participant number and item number, test results will be reliable. Field (2009), Tabachnick and Fidell (1966) also asserted that to be able to run a factor analysis, the minimum required number of participants is 300. Accordingly, it can be said that 465 participants in our study is a good number for factor analysis.
255
Gamze Orhan et al. / Procedia - Social and Behavioral Sciences 150 ( 2014 ) 251 – 262
to Field, 2009), which is well above the acceptable limit of .5 (Field, 2009). Bartlett’s test of sphericity = 7744,509, p < .001, indicated that correlations between items were sufficiently large for PCA. An initial
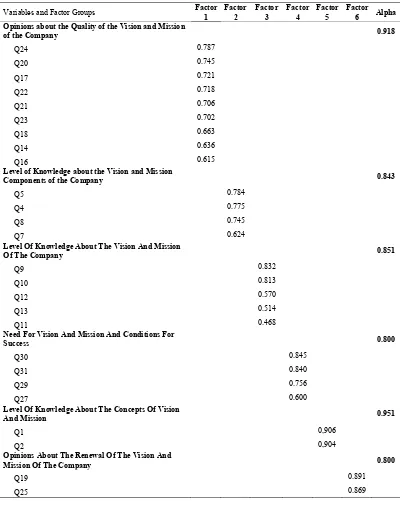
Table 1. Factor Analysis Results
Variables and Factor Groups Factor
1
Opinions about the Quality of the Vision and Mission
of the Company 0.918
Level of Knowledge about the Vision and Mission
Components of the Company 0.843
Q5 0.784
Q4 0.775
Q8 0.745
Q7 0.624
Level Of Knowledge About The Vision And Mission
Of The Company 0.851
Need For Vision And Mission And Conditions For
Success 0.800
Q30 0.845
Q31 0.840
Q29 0.756
Q27 0.600
Level Of Knowledge About The Concepts Of Vision
And Mission 0.951
Q1 0,906
Q2 0,904
Opinions About The Renewal Of The Vision And
Mission Of The Company 0.800
Q19 0.891
256 Gamze Orhan et al. / Procedia - Social and Behavioral Sciences 150 ( 2014 ) 251 – 262
analysis was run to obtain eigenvalues for each component in the data. Six components had eigenvalues over Kaiser’s criterion of 1 and in combination explained 69,189% of the variance. Table 1 shows the factor loadings after rotation and Cronbach’s alpha value of each component. The items that cluster on the same components suggest that component 1 represents “opinions about the quality of the vision and mission of the institution”, component 2 “level of knowledge about the vision and mission components of the institution” , component 3 “level of knowledge about the vision and mission of the ınstitution”,
component 4 “need for vision and mission and conditions for success”, component 5 “level of knowledge about the concepts of vision and mission”, component 6 “opinions about the renewal of the vision and
mission of the ınstitution”.
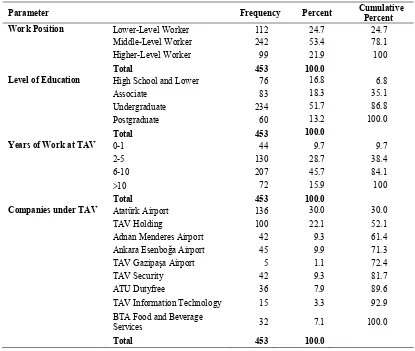
Table 2 gives the demographic characteristics of TAV Airports employees which participated to the survey.
Table 2. Demographic Characteristics of Respondents
Parameter Frequency Percent Cumulative
Percent
Work Position Lower-Level Worker 112 24.7 24.7
Middle-Level Worker 242 53.4 78.1
Higher-Level Worker 99 21.9 100
Total 453 100.0
Level of Education High School and Lower 76 16.8 6.8
Associate 83 18.3 35.1
Undergraduate 234 51.7 86.8
Postgraduate 60 13.2 100.0
Total 453 100.0
Years of Work at TAV 0-1 44 9.7 9.7
2-5 130 28.7 38.4
6-10 207 45.7 84.1
!10 72 15.9 100
Total 453 100.0
Companies under TAV Atatürk Airport 136 30.0 30.0
TAV Holding 100 22.1 52.1
Adnan Menderes Airport 42 9.3 61.4
Ankara Esenboğa Airport 45 9.9 71.3
TAV Gazipaşa Airport 5 1.1 72.4
TAV Security 42 9.3 81.7
ATU Dutyfree 36 7.9 89.6
TAV Information Technology 15 3.3 92.9
BTA Food and Beverage
Services 32 7.1 100.0
Total 453 100.0
257
Gamze Orhan et al. / Procedia - Social and Behavioral Sciences 150 ( 2014 ) 251 – 262
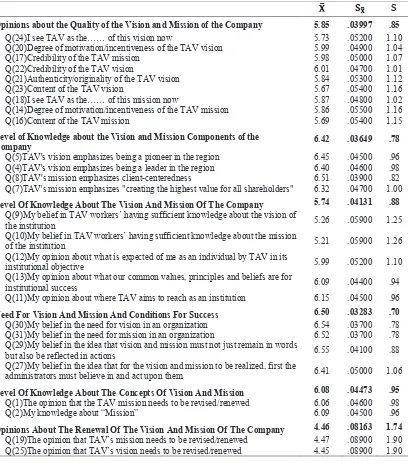
The descriptive statistics regarding sub-factors in the scale are analyzed and the results are presented in Table 3.
Table 3. Factorial Descriptive Statistics
S
Opinions about the Quality of the Vision and Mission of the Company 5.85 .03997 .85
Q(24)I see TAV as the…… of this vision now 5.73 .05200 1.10
Q(20)Degree of motivation/incentiveness of the TAV vision 5.99 .04900 1.04 Q(17)Credibility of the TAV mission 5.98 .05000 1.07
Q(22)Credibility of the TAV vision 6.01 .04700 1.01
Q(21)Authenticity/originality of the TAV vision 5.84 .05300 1.12
Q(23)Content of the TAV vision 5.67 .05400 1.16
Q(18)I see TAV as the…… of this mission now 5.87 .04800 1.02 Q(14)Degree of motivation/incentiveness of the TAV mission 5.86 .05500 1.16
Q(16)Content of the TAV mission 5.69 .05400 1.15
Level of Knowledge about the Vision and Mission Components of the
Company 6.42 .03649 .78
Q(5)TAV's vision emphasizes being a pioneer in the region 6.45 .04500 .96 Q(4)TAV's vision emphasizes being a leader in the region 6.40 .04600 .98 Q(8)TAV's mission emphasizes client-centeredness 6.51 .03900 .82 Q(7)TAV's mission emphasizes "creating the highest value for all shareholders" 6.32 .04700 1.00
Level Of Knowledge About The Vision And Mission Of The Company 5.74 .04131 .88 Q(9)My belief in TAV workers’ having sufficient knowledge about the vision of
the institution 5.26 .05900 1.25
Q(10)My belief in TAV workers’ having sufficient knowledge about the mission
of the institution 5.21 .05900 1.26
Q(12)My opinion about what is expected of me as an individual by TAV in its
institutional objective 5.99 .05200 1.10
Q(13)My opinion about what our common values, principles and beliefs are for
institutional success 6.09 .04400 .94
Q(11)My opinion about where TAV aims to reach as an institution 6.15 .04500 .96
Need For Vision And Mission And Conditions For Success 6.50 .03283 .70 Q(30)My belief in the need for vision in an organization 6.54 .03700 .78 Q(31)My belief in the need for mission in an organization 6.52 .03700 .78 Q(29)My belief in the idea that vision and mission must not just remain in words
but also be reflected in actions 6.55 .04100 .88
Q(27)My belief in the idea that for the vision and mission to be realized, first the
administrators must believe in and act upon them 6.41 .05000 1.06
Level Of Knowledge About The Concepts Of Vision And Mission 6.08 .04473 .95 Q(1)The opinion that the TAV mission needs to be revised/renewed 6.06 .04600 .98
Q(2)My knowledge about “Mission” 6.09 .04500 .96
Opinions About The Renewal Of The Vision And Mission Of The Company 4.46 .08163 1.74 Q(19)The opinion that TAV’s mission needs to be revised/renewed 4.47 .08900 1.90 Q(25)The opinion that TAV’s vision needs to be revised/renewed 4.45 .08900 1.90
258 Gamze Orhan et al. / Procedia - Social and Behavioral Sciences 150 ( 2014 ) 251 – 262
without excessive deviation is not met, a non-parametric test, Kruskal Wallis H, which aims the same thing with one-way ANOVA, is utilized. Whether the distribution meets the normalcy hypothesis or not is decided based on Skewness and Kurtosis values (Field, 2009).
As a result of one-way ANOVA, for the cases with significant difference, Post Hoc tests are used to see between which groups there is a difference. When a significant difference is found as a result of Kruskal Wallis H test, Mann Whitney U test is used for paired comparisons to see between which groups there is a difference. In these cases, for paired comparisons, Bonferronni adjustment is done and adjusted alpha level (alpha level = .05/comparison number) is taken as the base.
Whether the overall mean scores from the first factor of the scale “Opinions about the Quality of the Vision and Mission of the Company” showed a significant difference according to position and education level is analyzed through one-way ANOVA and the results are given in Table 4.
Table 4. Opinions about the Quality of the Vision and Mission of the Company Factor ANOVA Results
Sum of Squares df Mean Square F Sig. Sig.Diff.
According to ANOVA results, “Opinions about the Quality of the Vision and Mission of the
Company” factor mean scores do not indicate a significant difference according to position (F2,452 =
2.559; p > .05). However, according to education level, “Opinions about the Quality of the Vision and Mission of the Company” factor mean scores show difference for at least two education levels (F3, 452 = 3.892; p < .05). In order to determine between which education levels this difference exist, a Post Hoc test, Scheffe test is carried out, and the mean score of the participants with high school or lower ( = 6.06) is found to be significantly higher (p < .05) than the mean score of the participants with post graduate education ( = 5.61). (H1: rejected, H2:accepted).
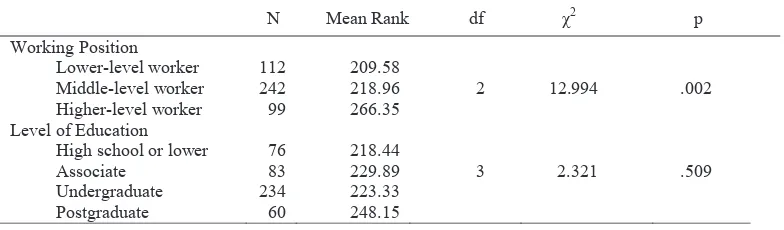
Whether the “Level of Knowledge about the Vision and Mission Components of the Company” factor mean scores differed according to participants’ position and education level is analyzed by using Kruskal Wallis H test and the results are given in Table 5.
Table 5. Level of Knowledge about the Vision and Mission Components of the Company Factor Kruskal Wallis H Test Result
N Mean Rank df χ2 p
Working Position
Lower-level worker 112 209.58
2 12.994
Middle-level worker 242 218.96 .002
Higher-level worker 99 266.35 Level of Education
High school or lower 76 218.44
Associate 83 229.89 3 2.321 .509
259
Gamze Orhan et al. / Procedia - Social and Behavioral Sciences 150 ( 2014 ) 251 – 262
According to Kruskal Wallis H test result, “Level of Knowledge about the Vision and Mission Components of the Company” factor mean scores indicate a significant difference according to
participants’ position (χ2 = 12.994; p < .05). In order to determine between which groups is this
difference, paired comparisons are made by using Mann Whitney U test, and this revealed that, one difference (Z = -3.311; p < .025) was between lower-level position employees ( = 6.30) and higher-level position employees ( = 6.61), and another difference (Z = -3.212; p < .025) was between middle-level position employees ( = 6.40) and higher-middle-level position employees ( = 6.61). (H3:accepted).
In the comparison based on education level, mean scores regarding this factor are found not to differ significantly according to education level (χ2 = 2.321; p > .05). (H4: rejected)
Whether the participants’ “Level of Knowledge about the Vision and Mission of The Company” factor mean scores differed according to position and education level variables is analyzed by Kruskal Wallis H test and the findings are given in Table 6.
Table 6. Level of Knowledge about the Vision and Mission of the Company Factor Kruskal Wallis H Test Result
N Mean Rank df χ2 p
Working Position
Lower-level worker 112 232.99
2 4.583
Middle-level worker 242 215.69 .101
Higher-level worker 99 247.86 Level of Education
High school or lower 76 250.31
Associate 83 238.55 3 5.999 .112
Undergraduate 234 222.33 Postgraduate 60 199.71
“Level of Knowledge About The Vision And Mission of The Company” factor mean scores are found not to show a significant difference according to participants’ position (χ2 = 4.583; p > .05) and education level (χ2 = 5.999; p > .05). (H5:rejected, H6:rejected).
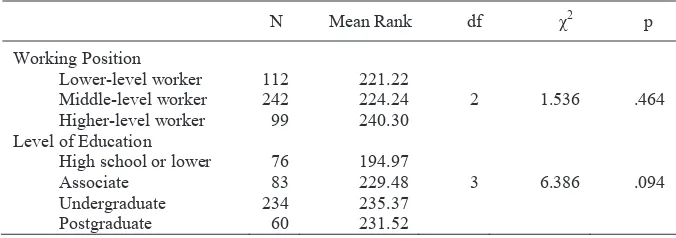
Whether the “Need for Vision and Mission and Conditions for Success” factor mean scores show a significant difference according to position and education level is analyzed by using Kruskal Wallis H test and the results are given in Table 7.
Table 7. Need For Vision and Mission and Conditions for Success Factor Kruskal Wallis H Test Result
N Mean Rank df χ2 p
Working Position
Lower-level worker 112 221.22
2 1.536
Middle-level worker 242 224.24 .464
Higher-level worker 99 240.30 Level of Education
High school or lower 76 194.97
Associate 83 229.48 3 6.386 .094
260 Gamze Orhan et al. / Procedia - Social and Behavioral Sciences 150 ( 2014 ) 251 – 262
According to Kruskal Wallis H test results, the “Need For Vision And Mission And Conditions For Success” factor mean scores do not show a significant difference according to participants’ position (χ2 = 1.536; p > .05) and education level (χ2 = 6.386; p > .05). (H7: rejected, H8: rejected).
Whether the participants’ “Level of Knowledge about the Concepts of Vision and Mission” factor mean scores show a significant difference according to position and education level variables is analyzed by using Kruskal Wallis H test and the results are given in Table 8.
Table 8. Level of Knowledge about the Concepts of Vision and Mission Factor Kruskal Wallis H Test Result
N Mean Rank df χ2 p
Working Position
Lower-level worker 112 189.77
2 18.696
Middle-level worker 242 229.18 .000
Higher-level worker 99 263.79 Level of Education
High school or lower 76 200.81
Associate 83 210.41 3 8.759 .033
Undergraduate 234 234.02 Postgraduate 60 255.73
Kruskal Wallis H test results reveal that, according to position, “Level of Knowledge About The Concepts of Vision And Mission” factor mean scores show significant difference (χ2 = 18.696; p < .05). In order to determine between which groups this difference exists, paired comparisons are made by using Mann Whitney U test and a significant difference (p < .025) is found between lower-level position employees ( = 5.80) and middle-level position ( = 6.11) and higher level position employees ( = 6.31) and between higher-level position employees ( = 6.31) and middle-level position employees ( = 6.11). (H9: accepted)
According to education level comparison results, this factor mean scores are found to show significant
difference (χ2 = 8.759; p < .05) and to determine between which groups is this difference, paired
comparisons are made by using Mann Whitney U test. According to this, there is a significant difference (p < .017) between the mean scores of participants with high school or lower education ( = 5.86) and the mean scores of participants with post-graduate education ( = 6.30). (H10: accepted)
Whether the participants’ “Opinions About The Renewal of The Vision And Mission of The
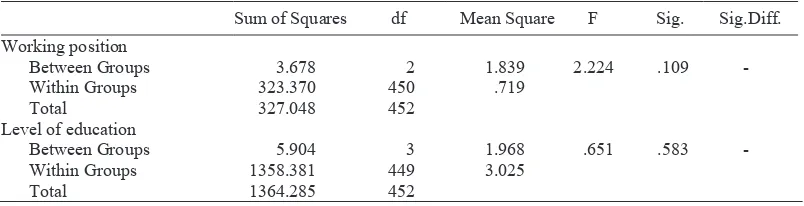
Company” factor mean scores show a significant difference according to position and education level variables is analyzed by using one-way ANOVA and the results are given in Table 9.
Table 9. Opinions about the Renewal of the Vision and Mission of the Company” Factor ANOVA Results
261
Gamze Orhan et al. / Procedia - Social and Behavioral Sciences 150 ( 2014 ) 251 – 262
According to one-way ANOVA Results, “Opinions About The Renewal of The Vision And Mission of The Company” factor mean scores do not indicate significant difference both for position (F2,452 =
2.224; p > .05) and education level (F3,452 = .651; p > .05). (H11: rejected, H12: rejected)
4.Conclusion
This study found that employees’ opinions about TAV’s mission and vision differ based on their education level. Thus, the employees with high school or lower level education view the quality of the mission and vision statements of their company more adequate than those who have a post graduate degree. It might be safe to attribute this result to employees’ knowledge level about vision and mission concepts. Hence, when the tests about the knowledge of vision and mission concepts are analysed, it is clear that employees with high school and lower level degrees think that they are less informed about these concepts than the employees with post graduate degrees. This leads us to think that the fact that employees with high school and lower level education are less knowledgeable about vision and mission influences their evaluation of their own company’s mission and vision statements, which results in their being less critical of those statements. On the other hand, employees with post graduate degrees may be viewing their own vision and mission statements qualitatively less adequate due to the effect of their general conceptual knowledge. In addition, when the possibility that post graduate level employees can work in higher-level positions and thus can better see the overall structure of their company is considered, it can be concluded that this might be leading them to think more critically.
Different from Doğan’s (2008) study, adding an extra factor to our study resulted in another finding. This new factor regarding employees’ knowledge level about the vision and mission components of their company revealed that lower, middle, and higher level employees’ knowledge levels are different. Lower -level employees think that they are better informed than the higher--level employees about the vision and mission components of their company. Likewise, the higher-level employees think that they know the components better than the middle-level employees. Another point that must be stressed is that when the factorial mean scores from all the employees are compared, it becomes apparent that while they have less knowledge of the vision and mission of their company, they have more knowledge of the components. This shows that, although the employees do not thoroughly know the vision and mission statements by heart, they indeed know what actually is emphasized in those statements.
Some limitations of this study can be mentioned. First, the data were collected from only single company. Thus, it is not claimed that the findings can be generalized to all profit-oriented companies. Second, in this study we investigated only two dependent variables effect, working position and education level of employees. In future works, more important variables can be investigated.
This study wouldn’t have been possible without support of TAV Airport Holding. We sincerely thank to
the CEO of TAV, Dr. Eng. M. Sani SENER.
References
Aydemir, N. (2000). Öğrenen organizasyonların oluşturulmasında vizyon paylaşımı. İktisat, İşletme ve Finans, 15(168), 27-34. Bart, C.K. (1998). Mission statement rationales and organizational alignment in the not-for-profit health care sector. Health Care
Management Review, 23, 54-69.
262 Gamze Orhan et al. / Procedia - Social and Behavioral Sciences 150 ( 2014 ) 251 – 262
Bart, C. K. & Baetz, M. C. (1998). The relationship between mission statements and firm performance: An exploratory study.
Journal of Management Studies, 35(6), 823-853.
Bart, C. K. & Baetz, M. C. (1995). Do mission statements matter? Working Paper 345, School of Business, McMaster University, Hamilton, Ontario, Canada, 1995.
Bart, C. K., Bontis N. & Tagger , S. (2001). A model of the impact of mission statements on firm performance. Management Decision, 39(1), 9-18.
Bartkus, B. & Glassman, M. and Mcafee, B. (2005). Mission statement quality and financial performance. European Management Journal, 24(1), 86–94.
Benligiray, S., Geylan, A. & Duman, E. (2010). İnsan kaynakları yönetiminin stratejik olarak yönlendirilmesinin finansal performansı etkileyip etkilemediğinin analizi. Anadolu University Journal of Social Sciences, 10(1), 61-84.
Benligiray, S., Ozsoy, G. & Bukec, C. M. (2013). An exploratory research regarding the visibility of the mission statements on the airline company websites. Journal of Management Research, 5(1), 41-63.
Brown, W. A. & Yoshioka, C. F. (2003). Mission attachment and satisfaction as factors in employee retention. Nonprofit Management & Leadership, 14 (1), 5-18.
Campbell, A. (1997). Mission statements. Long Range Planning, 30(6), 931-932.
Collins, J. C. & Porras, J. I. (1996). Building your company’s vision. Harvard Business Review, September-October, 65-77. David, F. R. & David, F. R. (2003). It’s time to redraft your mission statement. Journal of Business Strategy, January/February,
11-14.
Darbi, W. P. K. (2012). Of mission and vision statements and their potential impact on employee behaviour and attitudes: The case of a public but profit-oriented tertiary institution. International Journal of Business and Social Science, 3(14), 95–109. Doğan, S. & Hatipoğlu, C. (2009). Küçük ve orta boy işletmelerde vizyon açıklamasının işletmenin performansına etkisine ilişkin
bir araştırma. Atatürk Üniversitesi İktisadi ve İdari Bilimler Dergisi, 23(2), 81-99.
Doğan, H. (2008). Örgütlerde vizyon ve misyonların çalışanlarca kabulü ve Adnan Menderes Üniversitesi Örneği. Gazi Üniversitesi İktisadi ve İdari Bilimler Fakültesi Dergisi, 10 (3), 93-110.
Field, A. (2009). Discovering statistics using SPSS for windows. London: Sage Publications.
Forbes, D. J. & Seena, S. (2006). The value of a mission statement in an association of not-for-profit hospitals. International Journal of Health Care Quality Assurance, 19 (5), 409-419.
Ireland, R. D. & Hitt, M. A. (1992). Mission statements: importance, challenge and recommendations for development. Business Horizons, 33 (3), 34-42.
Kass, R.A. & Tinsley, H. E. A. (1979). Factor analysis. Journal of Leisure Research, 11, 120-138.
Kemp, S. & Dwyer, L. (2003). Mission statements of international airlines: a content analysis. Tourism Management, 24(6), 635-653.
Kim, S. E. & Lee, J. W. (2007). Is mission attachment an effective management tool for employee retention? An empirical analysis of a nonprofit human services agency. Review of Public Personnel Administration, 27(3), 227-248.
Klemm, M. , Sanderson, S. & Luffman, G. (1991). Mission statements: selling corporate values to employees. Long Range Planning, 24(3), 73-78.
Rangan, V.K. (2004). Lofty missions, down-to-earth plans. Harvard Business Review, 82(3), 112-9. Raynor, M. E. (1998). That vision thing: Do we need it? Long Range Planning, 31(3), 368-376. Stokely, C. R. (2004). Getting everybody on the same page. Handbook of Business Strategy, 171-172.
Stovel, M. & Bontis, N. (2002). Voluntary turnover: knowledge management friend or foe?. Journal of Intellectual Capital, 3(3), 303-22.
Sufi, T. & Lyons, H. (2003). Mission statements exposed. International Journal of Contemporary Hospitality Management, 15(5), 255-262.