R
E S E A R C H
P
A P E R
S
E R I E S
http://ssrn.com/abstract=1029382
Research Paper No. 1976
International Accounting Standards and Accounting Quality
Mary E. Barth Wayne R. Landsman
Mark H. Lang
International Accounting Standards and Accounting Quality
Mary E. Barth* Graduate School of Business
Stanford University
Wayne R. Landsman and Mark H. Lang Kenan-Flagler Business School
University of North Carolina
September 2007
Forthcoming, Journal of Accounting Research
* Corresponding author: Graduate School of Business, Stanford University, 94305-5015,
[email protected]. We appreciate helpful comments from Bill Beaver, Utpal Bhattacharya,
International Accounting Standards and Accounting Quality
Abstract
We examine whether application of International Accounting Standards is associated with higher accounting quality. The application of IAS reflects the combined effects of features of the financial reporting system, including standards, their interpretation, enforcement, and litigation. We find that firms applying IAS from 21 countries generally evidence less earnings
management, more timely loss recognition, and more value relevance of accounting amounts than do a matched sample of firms applying non-US domestic standards. Differences in
1.
Introduction
The question we address is whether application of International Accounting Standards
(IAS) is associated with higher accounting quality than application of non-US domestic
standards.1 In particular, we investigate whether accounting amounts of firms that apply IAS
exhibit less earnings management, more timely loss recognition, and higher value relevance than
accounting amounts of firms that apply domestic standards. The accounting amounts that we
compare result from the interaction of features of the financial reporting system, which include
accounting standards, their interpretation, enforcement, and litigation. Because our interest is in
the quality of the accounting amounts that result from the financial reporting system, we make no
attempt to determine the relative contribution of each of its features. We refer to the combined
effect of the features of the financial reporting system as the effect of application of IAS. Our
results indicate that firms applying IAS have higher accounting quality than firms that do not and
that accounting quality improves after firms adopt IAS.
A goal of the International Accounting Standards Committee (IASC), and its successor
body the International Accounting Standards Board (IASB), is to develop an internationally
acceptable set of high quality financial reporting standards. To achieve this goal, the IASC and
IASB have issued principles-based standards, and taken steps to remove allowable accounting
alternatives and to require accounting measurements that better reflect a firm’s economic
position and performance. Accounting quality could increase if these actions by standard setters
1
limit management’s opportunistic discretion in determining accounting amounts, e.g., managing
earnings. Accounting quality also could increase because of changes in the financial reporting
system contemporaneous with firms’ adoption of IAS, e.g., more rigorous enforcement. Thus,
we predict that accounting amounts based on IAS are of higher quality than those based on
domestic standards.
However, there are at least two reasons why our predictions may not be borne out. First,
IAS may be of lower quality than domestic standards. For example, limiting managerial
discretion relating to accounting alternatives could eliminate the firm’s ability to report
accounting measurements that are more reflective of the firm’s economic position and
performance. In addition, the inherent flexibility in principles-based standards could provide
greater opportunity for firms to manage earnings, thereby decreasing accounting quality.
Second, the effects of features of the financial reporting system other than the standards
themselves could eliminate any improvement in accounting quality arising from higher quality
accounting standards. This could occur, for example, if enforcement of accounting standards is
lax.
We interpret earnings that exhibit less earnings management as being of higher quality.
Our metrics for earnings management are based on the variance of the change in net income, the
ratio of the variance of the change in net income to the variance of the change in cash flows, the
correlation between accruals and cash flows, and the frequency of small positive net income.
We interpret a higher variance of the change in net income, higher ratio of the variances of the
change in net income and change in cash flows, less negative correlation between accruals and
cash flows, and lower frequency of small positive net income as evidence of less earnings
higher quality. Our metric for timely loss recognition is the frequency of large negative net
income. We interpret a higher frequency as evidence of more timely loss recognition. Finally,
we interpret accounting amounts that are more value relevant as being of higher quality. Our
metrics for value relevance are the explanatory powers of net income and equity book value for
prices, and stock return for earnings. We interpret higher explanatory power as evidence of more
value relevance. All of our accounting quality metrics are based on those used in prior research.
We base our inferences on a sample of firms in 21 countries that adopted IAS between
1994 and 2003. Ideally, we would base on our inferences on a sample of firms that were
randomly assigned to apply IAS. However, our sample period preceded the mandatory
application of IAS for most sample firms, and thus firms may have adopted IAS in response to
changed incentives. Thus, we could detect an improvement in accounting quality for firms that
apply IAS that is attributable to changes in incentives and not to changes in the financial
reporting system. To mitigate the effects of changes in incentives, when constructing our
accounting quality metrics relating to earnings management and timely loss recognition, we
include controls for factors that prior research identifies as associated with firms’ voluntary
accounting decisions, e.g., growth, leverage, and the need to access the capital markets. Our
metrics of accounting quality also reflect the effects of the economic environment that are not
attributable to the financial reporting system. The economic environment includes volatility of
economic activity and information environment. To mitigate these effects, we use a matched
sample design by selecting a firm that applies domestic standards in the same country as, and of
similar size to, each sample firm that applies IAS. We compare accounting quality metrics for
the two groups of firms. In addition, some of the controls we include when constructing our
features, we cannot be sure that our findings are attributable to the change in the financial
reporting system rather than to changes in firms’ incentives and the economic environment.
We begin by comparing accounting quality metrics for firms applying IAS to those
applying non-US domestic standards in the period after the firms applying IAS adopt IAS, i.e.,
the post-adoption period. This permits us to test whether firms applying IAS have higher
accounting quality than firms that do not. We find that in the post-adoption period firms
applying IAS generally evidence less earnings management, more timely loss recognition, and
more value relevance of accounting amounts than do firms not applying IAS. In particular, firms
applying IAS have a higher variance of the change in net income, less negative correlation
between accruals and cash flows, higher frequency of large negative net income, and higher
value relevance of net income and equity book value for share prices, with each of these
differences being significant. In addition, they have a higher ratio of the variances of change in
net income and change in cash flow, lower frequency of small positive net income, and higher
value relevance of net income for good news stock returns, although these differences are not
significant.
Firms applying IAS and domestic standards could exhibit differences in accounting
quality in the post-adoption period because they differed in the period before the firms applying
IAS adopted IAS, i.e., the pre-adoption period. To determine whether this is the case, we
compare accounting quality of the two groups of firms in the pre-adoption period. We find that
differences in our accounting quality metrics in the pre-adoption period do not explain the
differences in the post-adoption period. In the pre-adoption period, all but one of the quality
metrics for firms that later apply IAS differ insignificantly from those for firms that do not apply
environment. Thus, we also compare accounting quality metrics for firms applying IAS in the
pre- and post-adoption periods, thereby effectively using each firm as its own control for these
differences. We find that firms applying IAS exhibit higher accounting quality in the
post-adoption period than they do in the pre-post-adoption period, with four of the eight differences being
significant. Because the economic environment can change over time, we also test whether the
increase in accounting quality for firms that apply IAS is greater than that for firms that do not.
We find that generally the increase in accounting quality is greater for firms applying IAS,
although almost all of the differences in changes in accounting quality metrics are not
significant.
We contribute to the literature examining the quality of IAS-based accounting amounts in
two ways. First, we use a broad sample of firms in many countries adopting IAS over several
years. In contrast, prior research typically focuses on individual countries using data from
limited time periods. Second, we use an array of quality metrics drawn from a common time
period and use a common set of control variables. Findings from prior research comparing the
quality of accounting amounts based on applying IAS and domestic standards are mixed, which
could be attributable to using different metrics, drawing data from somewhat different time
periods, and using different control variables.
The remainder of the paper is organized as follows. The next section develops the
hypotheses and section three explains the research design. Section four describes the sample and
data, and section five presents the results. Section six offers a summary and concluding remarks.
2.
Hypothesis Development
The first IAS was published in 1975 by the IASC, which was formed in 1973. Since
then, the process for setting international accounting standards has undergone substantial
evolution, culminating in the 2001 restructuring of the IASC into the IASB. In recognition of the
quality of the core set of IAS, in 2000 the International Organization of Securities Commissions
recommended that the world’s securities regulators permit foreign issuers to use IAS for
cross-border offerings (IOSCO, 2000). As of 2005, almost all publicly listed companies in Europe and
many other countries are required to prepare financial statements in accordance with
International Financial Reporting Standards (IFRS). In addition, the Financial Accounting
Standards Board has embarked on a comprehensive project aimed at convergence between IFRS
and US standards.
A goal of the IASC and IASB is to develop an internationally acceptable set of high
quality financial reporting standards. To achieve this goal, the IASC and IASB have issued
principles-based standards, and taken steps to remove allowable accounting alternatives and to
require accounting measurements that better reflect a firm’s economic position and performance
(IASC, 1989). Limiting alternatives can increase accounting quality because doing so limits
management’s opportunistic discretion in determining accounting amounts (Ashbaugh and
Pincus, 2001). Accounting amounts that better reflect a firm’s underlying economics, either
resulting from principles-based standards or required accounting measurements, can increase
accounting quality because doing so provides investors with information to aid them in making
investment decisions. These two sources of higher accounting quality are related in that, all else
equal, limiting opportunistic discretion by managers increases the extent to which the accounting
amounts reflect a firm’s underlying economics. Consistent with this line of reasoning, Ewert and
limit opportunistic discretion result in accounting earnings that are more reflective of a firm’s
underlying economics and, therefore, are of higher quality. Accounting quality could also
increase because of changes in the financial reporting system contemporaneous with firms’
adoption of IAS, e.g., more rigorous enforcement. Thus, we predict that accounting amounts
resulting from application of IAS are of higher quality than those resulting from application of
domestic standards.2
Although we predict that application of IAS is associated with higher accounting quality,
there are at least two reasons why this may not be true. First, IAS may be of lower quality than
domestic standards. For example, limiting managerial discretion relating to accounting
alternatives could eliminate the firm’s ability to report accounting measurements that are more
reflective of its economic position and performance. In addition, the inherent flexibility in
principles-based standards could provide greater opportunity for firms to manage earnings,
thereby decreasing accounting quality. This flexibility has long been a concern of securities
markets regulators, especially in international contexts (e.g., Breeden, 1994).3
Second, even if IAS are higher quality standards, the effects of features of the financial
reporting system other than the standards themselves could eliminate any improvement in
accounting quality arising from adopting IAS. Cairns (1999), Street and Gray (2001), Ball,
Robin, and Wu (2003), and Burgstahler, Hail, and Leuz (2006) suggest that lax enforcement can
result in limited compliance with the standards, thereby limiting their effectiveness. Cairns
2 Findings in Ashbaugh and Pincus (2001) also suggest that IAS are of higher quality by showing that firms applying
IAS exhibit smaller analyst forecast errors. In particular, the study finds that the greater the difference between domestic standards and IAS, the greater are the forecast errors and that forecast errors tend to be smaller after firms adopt IAS. However, forecastable earnings are not necessarily of higher quality because, for example, smoothed earnings are typically more forecastable.
3
(1999) and Street and Gray (2001) find substantial noncompliance with IAS among firms
purportedly applying IAS. In particular, for the 279 firms that refer to application of IAS in their
1998 financial statements, Street and Gray (2001) examines disclosed accounting policies for
consistency with major IAS pronouncements. The study finds that, in many cases, disclosed
accounting policies are inconsistent with IAS. Ball, Robin, and Wu (2003) examines timely loss
recognition for firms in Hong Kong, Malaysia, Singapore, and Thailand. In these countries,
accounting standards are largely derived from common law and, therefore, likely are similar to
IAS. Ball, Robin, and Wu (2003) finds that timely loss recognition for firms in these countries is
no better than it is for firms in code law countries. Ball, Robin, and Wu (2003) attributes this
finding to differing incentives of managers and auditors. Burgstahler, Hail, and Leuz (2006)
finds that strong legal systems are associated with less earnings management. The study
attributes this finding to different incentives created by market pressures and institutional factors
to report earnings that reflect economic performance.
Findings in Bradshaw and Miller (2005) suggest that the regulatory and litigation
environment also is important to the application of accounting standards. In particular,
Bradshaw and Miller (2005) studies non-US firms that assert that their domestic standards-based
financial statements are in accordance with US standards, and finds that firms claiming to
comply with US standards report accounting amounts that are more similar to US firms than are
those of other non-US firms. However, the characteristics of the domestic standards-based
accounting amounts that non-US firms assert comply with US standards often differ from those
of US firms. Consistent with Bradshaw and Miller (2005), findings in Lang, Raedy, and Wilson
(2006) suggest that a similar litigation and regulation environment does not ensure accounting
standards-based earnings of firms that cross-list on US markets exhibit significantly more
earnings management than do earnings of US firms, despite the fact that cross-listed firms are
required to use US standards and in principle face a regulatoryand litigation environment similar
to US firms.
We could observe differences in accounting quality for firms applying IAS for reasons
other than those relating to the financial reporting system, such as firms’ incentives and
economic environments. Regarding incentives, because application of IAS was largely
voluntary during our sample period, incentives for firms that adopted IAS could have changed
between the pre- and post-adoption periods, which resulted in their decision to adopt IAS.4 The
fact that firms might have adopted IAS as part of their response to changes in incentives could
indicate that either their domestic standards did not permit them to reveal their higher accounting
quality, or they adopted IAS to signal their higher accounting quality because they believe the
market perceives IAS are higher quality than domestic standards. Both of these explanations are
consistent with IAS being associated with higher accounting quality.5
Regarding economic environment, firms may have adopted IAS because they anticipated
IAS would become mandatory in the near future. If this were the case but application of IAS is
not associated with an improvement in accounting quality, then our tests will be biased against
finding that IAS-based accounting amounts are of higher quality. Also, Land and Lang (2002)
4
Daske et al. (2007) provides evidence that changing incentives could affect not only the decision to adopt IAS, but also the degree to which firms comply with IAS. In particular, Daske et al. (2007) examines the economic
consequences of adopting international accounting standards, including liquidity and equity cost of capital. The study’s findings indicate that economic benefits obtain only for those firms that can credibly signal a commitment to higher financial statement transparency.
5
shows that accounting quality is improving worldwide. Therefore, any improvement in
accounting quality we observe after firms adopt IAS could have obtained even if firms had not
adopted IAS. Section 3 discusses the research design features we incorporate to mitigate the
effects on our accounting quality comparisons arising from changing incentives and other
temporal economic changes.
2.2 IAS AND DOMESTIC STANDARDS COMPARISONS
Several studies compare accounting amounts based on, and the economic implications of,
applying IAS and domestic standards in Germany. Most of these studies find no significant
differences. Van Tendeloo and Vanstraelen (2005) finds that German firms applying IAS do not
exhibit differences in earnings management when compared to those applying German standards.
Daske (2006) finds no evidence of a reduction in cost of capital for German firms that apply IAS.
Hung and Subramanyam (2007) finds that accounting amounts based on German standards and
those based on IAS that are disclosed in accordance with requirements for first-time adopters of
IAS do not differ in value relevance.6 In contrast, Bartov, Goldberg, and Kim (2005) provides
evidence that earnings based on IAS is more value relevant than earnings based on German
standards.
6
Eccher and Healy (2003) compares accounting amounts based on IAS and Chinese
standards and finds that those based on IAS are not more value relevant than those based on
Chinese standards for firms that can be owned by foreign investors. However, the study finds
that accounting amounts based on IAS are less value relevant than those based on Chinese
standards for firms that can only be owned by domestic investors.
One explanation for the mixed findings in this individual country research is that firms
preparing to adopt IAS likely transition gradually, changing accounting amounts based on
domestic standards to be closer to those based on IAS. For example, Hung and Subramanyam
(2007) finds few reconciling items related to earnings management, such as hidden reserves,
which is surprising because the existence of such earnings management items is a common
concern with application of German standards.7 Another explanation is that developing
economies lack the infrastructure to enforce the application of IAS. Eccher and Healy (2003)
posits this as one reason for not finding IAS-based accounting amounts have higher value
relevance. A third explanation is that the studies differ in the effectiveness of controls for
incentives associated with a firm’s use of a particular set of accounting standards and effects of
the economic environment. A fourth explanation is that the studies use different metrics, draw
data from somewhat different time periods, and use different control variables.
Our study differs from this individual country research in the following ways. First, our
sample includes firms from 21 countries. There are advantages and disadvantages associated
with focusing on individual countries relative to using a sample from many countries. For
example, focusing on a particular country removes the need to control for potentially
7
confounding effects of country-specific factors unrelated to the financial reporting system.
However, doing so makes it difficult to extrapolate to other countries inferences from such
studies. Second, we use an array of metrics consistently derived over a single time period.
Third, we develop empirical procedures, including use of a matched sample and multiple
regression, to mitigate the effects on our inferences of factors unrelated to the financial reporting
system, i.e., incentives and economic environment.
2.3 MEASURES OF ACCOUNTING QUALITY
Following prior research, we operationalize accounting quality using earnings
management, timely loss recognition, and value relevance metrics. Consistent with the
predictions in this prior research, we predict that firms with higher quality earnings exhibit less
earnings management, more timely loss recognition, and higher value relevance of earnings and
equity book value. However, as noted below, there are plausible reasons for making the opposite
prediction for several of our metrics. This is because accounting quality can be affected by
opportunistic discretion exercised by managers and non-opportunistic error in estimating
accruals, and our metrics reflect these effects.
We examine two manifestations of earnings management, earnings smoothing and
managing towards positive earnings. We expect IAS-based earnings to be less managed than
domestic standards-based earnings because IAS limit management’s discretion to report earnings
that are less reflective of the firm’s economic performance.8 Regarding earnings smoothing,
following prior research, we assume that firms with less earnings smoothing exhibit more
earnings variability (Lang, Raedy, and Yetman, 2003; Leuz, Nanda, and Wysocki, 2003; Ball
8
and Shivakumar, 2005, 2006; Lang, Raedy, and Wilson, 2006). Thus, we predict that firms
applying IAS exhibit more variable earnings than those applying domestic standards. Our
prediction is supported by several studies. Ewert and Wagenhofer (2005) shows that applying
accounting standards that limit management’s discretion should result in higher variability in
accounting earnings. Leuz, Nanda, and Wysocki (2003) finds that earnings smoothing is less
pronounced in common law countries; IAS are based on a conceptual framework similar to those
of common law countries. Ball and Shivakumar (2005, 2006) suggest that timely recognition of
gains and losses, which is consistent with higher earnings quality, tends to increase the volatility
of earnings relative to cash flows. To test our prediction, we use two metrics of earnings
variability, variability of change in net income and variability of change in net income relative to
variability of change in cash flow.
Although we predict that firms applying IAS have less earnings management and, thus,
higher earnings variability, some studies (e.g., Healy, 1985) suggest that, in the case of “big
baths,” managers may use discretion in ways that result in higher earnings variability. Thus,
firms applying domestic standards could have more discretion for this form of earnings
management and thus could exhibit higher earnings variability. Also, higher earnings variability
could be indicative of lower earnings quality because of error in estimating accruals. Thus,
higher quality accounting can result in lower earnings variability.
We also assume that firms with more earnings smoothing exhibit a more negative
correlation between accruals and cash flows (Lang, Raedy, and Yetman, 2003; Leuz, Nanda, and
Wysocki, 2003; Ball and Shivakumar, 2005, 2006; Lang, Raedy, and Wilson, 2006). Land and
Lang (2002) and Myers, Myers, and Skinner (2006), among others, interpret a more negative
outcomes by increasing accruals. Ball and Shivakumar (2005, 2006) show that timely gain and
loss recognition, which is consistent with higher earnings quality, attenuates the negative
correlation between accruals and current period cash flow. Thus, we predict that firms applying
IAS exhibit a less negative correlation between accruals and cash flows than those applying
domestic standards.
Although we predict higher quality accounting results in a less negative correlation
between accruals and cash flows, the opposite could be true. In particular, Dechow (1994)
suggests that the proper role of accruals in income measurement is to smooth variability in cash
flows and, because accruals reverse over time, accruals and cash flows are expected to be
negatively correlated. Thus, firms applying domestic standards could manage earnings to exhibit
a less negative correlation between accruals and cash flows. Also, a less negative correlation
between accruals and cash flows could be indicative of lower accounting quality because of error
in estimating accruals. Thus, higher quality accounting can result in a more negative correlation
between accruals and cash flows.
Regarding our second manifestation of earnings management, prior research identifies
positive earnings as a common target of earnings management. Prior research uses the frequency
of small positive net income as a metric to provide evidence of managing towards positive
earnings (Burgstahler and Dichev, 1997; Leuz, Nanda, and Wysocki, 2003). The notion
underlying this metric is that management prefers to report small positive net income rather than
negative net income. Thus, we predict that firms applying IAS report small positive net income
with lower frequency than those applying domestic standards.
Turning to timely loss recognition, we expect higher quality earnings exhibit a higher
and Yetman (2003), Leuz, Nanda, and Wysocki (2003), Ball and Shivakumar (2005, 2006), and
Lang, Raedy, and Wilson (2006) that suggest that one characteristic of higher quality earnings is
that large losses are recognized as they occur rather than being deferred to future periods. This
characteristic is closely related to earnings smoothing in that if earnings are smoothed, large
losses should be relatively rare. Thus, we predict that firms applying IAS report large losses
with higher frequency than those applying domestic standards.
Although we predict higher quality accounting results in a higher frequency of larger
losses, the opposite could be true. In particular, a higher frequency of large losses could be
indicative of big bath earnings management. Also, a higher frequency of large losses could
result from error in estimating accruals. Thus, higher quality accounting can result in a lower
frequency of large losses.
Turning lastly to value relevance, we expect firms with higher quality accounting have a
higher association between stock prices and earnings and equity book value because higher
quality earnings better reflect a firm’s underlying economics (Barth, Beaver, and Landsman,
2001). First, higher quality accounting results from applying accounting standards that require
recognition of amounts that are intended to faithfully represent a firm’s underlying economics.
Second, higher quality accounting is less subject to opportunistic managerial discretion. These
two features of higher quality accounting are linked together by Ewert and Wagenhofer (2005),
which shows that accounting standards that limit opportunistic discretion result in accounting
earnings that have higher value relevance. Third, higher quality accounting has less
non-opportunistic error in estimating accruals. Consistent with these three features of higher quality
accounting, prior empirical research suggests that higher quality earnings are more value relevant
2006). Accordingly, we predict that firms applying IAS exhibit higher value relevance of net
income and equity book value than firms applying domestic standards.9
We test whether accounting quality for firms applying IAS is higher than that for firms
applying domestic standards using several metrics relating to earnings management, timely loss
recognition, and value relevance. One advantage of using several metrics is that, in principle,
doing so permits us to determine the source of any accounting quality differences between firms
that apply IAS and those that do not. Another advantage is that because there are plausible
alternative predictions for some of our metrics, it is possible to rule these out for some of our
metrics based on findings from other metrics. For example, suppose we find that firms applying
IAS have higher earnings variability and a higher frequency of large losses. These two findings
are consistent with our predictions indicating higher accounting quality. However, they also are
consistent lower quality accounting resulting from error in estimating accruals and big bath
earnings management. If we also find that firms applying IAS firms have higher value relevance
than firms that do not, the error in estimating accruals and big bath earnings management
explanations are ruled out.
3.
Research Design
3.1 OVERVIEW
Our empirical metrics of accounting quality reflect the effects of the financial reporting
system as well as those unattributable to the financial reporting system, including the economic
9
environment and incentives for firms to adopt IAS. Following prior research, we use two
approaches to mitigate these effects. First, when comparing metrics for firms applying IAS, IAS
firms, and firms applying non-US domestic standards, NIAS firms, we use a matching procedure
to select our sample of NIAS firms. In particular, we match on country as a control for
country-level differences in economic activity, and size as a control for size-related differences, such as
information environment. Second, when constructing our accounting quality metrics relating to
earnings management and timely loss recognition, we include controls for factors that prior
research identifies as associated with firms’ voluntary accounting decisions and controls for
economic environment.
As is the case in prior research (e.g., Ashbaugh, 2001; Ashbaugh and Pincus, 2001; Lang,
Raedy, and Yetman, 2003; Leuz, Nanda, and Wysocki, 2003; Lang, Raedy, and Wilson, 2006),
there is no definitive way to determine the degree to which these research design features
mitigate the effects of economic environment and incentives on our metrics. In addition, even
though we intend for our matching procedure to control for economic differences and our control
variables to capture firms’ incentives to adopt IAS, each design feature can control for both of
these confounding effects. Moreover, these two design features could also control for some
effects attributable to the financial reporting system, such as enforcement and litigation. That is,
matching IAS and NIAS firms and using control variables when constructing our metrics could
mask differences in accounting quality attributable to the financial reporting system.
To construct the matched sample, consistent with Lang, Raedy, and Yetman (2003) and
Lang, Raedy, and Wilson (2006) but modified to our context, we first identify each IAS firm’s
country and adoption year. We then identify all firms that do not apply IAS in any sample year
non-applying firm from the IAS firm’s country whose equity market value is closest to the IAS
firm’s at the end of its adoption year. Once a non-applying firm is selected as a match, it is not
considered as a potential match for other IAS firms. In a few cases, potential matching firms do
not have market value of equity available in the adoption year. In those cases, we consider
market value of equity for the two years before and after the adoption year.10 Our analyses
include all firm-years for which the IAS firm and its matched NIAS firm both have data. For
example, if the IAS firm has data from 1994 through 2000, and its matched NIAS firm has data
from 1995 through 2002, then our analysis includes data from 1995 through 2000 for the IAS
firm and its matched NIAS firm.
As the primary test of our predictions, we compare accounting quality metrics for IAS
firms and NIAS firms in the period after the IAS firms adopt IAS, i.e., the post-adoption period.
This permits us to determine whether firms that apply IAS have higher accounting quality than
firms that do not.
One potential problem with comparing IAS and NIAS firms in the post-adoption period
is that the two groups of firms could exhibit differences in accounting quality in the
post-adoption period because their economic characteristics differ. To determine whether this is the
case, we compare IAS and NIAS firms’ accounting quality before the IAS firms adopted IAS,
i.e., the pre-adoption period. Finding IAS and NIAS firms exhibit similar differences in
accounting quality in the pre- and adoption periods would make it difficult to attribute
post-adoption differences in accounting quality to the change in financial reporting for IAS firms.
Conversely, finding that accounting quality for IAS and NIAS firms is similar in the
10
adoption period but is different in the post-adoption period would make it less likely that
differences in accounting quality in the post-adoption period are attributable to differences in
economic characteristics between the two groups of firms.
Next we compare accounting quality for IAS firms in the pre- and post-adoption periods
to determine whether application of IAS is associated with higher accounting quality for IAS
firms. We do this for two reasons. First, this comparison is an alternative approach to
determining whether differences in accounting quality between IAS and NIAS firms in the
post-adoption period are attributable to differences in economic characteristics between the two
groups of firms. This is because comparing accounting quality for IAS firms in the pre- and
post-adoption periods uses each IAS firm as its own control. Second, this comparison provides
direct evidence on whether accounting quality for IAS firms improved between the pre- and
adoption periods. Finding that accounting quality for IAS firms is higher in the
post-adoption period would make it more likely that the improvement in accounting quality is
attributable to the change in the financial reporting system.
A limitation of a comparing accounting quality of IAS firms in the pre- and post-adoption
periods is that we could detect an improvement in accounting quality because of changes in the
economic environment of IAS firms unattributable to the financial reporting system. The fact
that IAS firms do not adopt IAS in the same calendar year mitigates the potential effect of
changes in economic environment. Nonetheless, we examine whether NIAS firms exhibit
similar changes in accounting quality between the two periods to provide additional evidence on
whether changes in the economic environment result in a general change in accounting quality.
In particular, we examine whether the change in accounting quality for IAS firms between the
the event that we find accounting quality for IAS firms improves from the pre- to post-adoption
periods, and is greater than that for NIAS firms in both the pre- and post-adoption periods. In
contrast, assume we find that accounting quality for IAS firms improves from the pre- to
post-adoption periods, is greater than that for NIAS firms in post-post-adoption period, but is not different
from that for NIAS firms in the pre-adoption period. This set of findings would make a
comparison of changes in accounting quality differences logically redundant, and such a
comparison potentially could suffer from a loss power arising from differencing metrics that
have estimation error (Landsman and Magliolo, 1988).11
Failure to control for a firm’s incentives to adopt IAS when making comparisons of
accounting quality between IAS and NIAS firms in the post-adoption period and changes in
accounting quality for IAS firms between the pre- and post-adoption periods can lead to us to
infer that observed differences in accounting quality are attributable to differences in the
financial reporting system when the quality differences are attributable to the effect of firms
incentives. Although we include research design features to mitigate the effects of incentives,
we cannot be sure that our findings are attributable to differences in the financial reporting
system rather than to differences in firms’ incentives.
Following prior research (Lang, Raedy, Yetman, 2003; Leuz, 2003; Lang, Raedy,
Wilson, 2006), we construct our accounting quality metrics based on cross-sectional data. As
with prior research, we interpret differences in various summary statistics (e.g., variances,
correlations, and regression R2s) relating to the metrics between two samples of firms being
compared as evidence of differences in accounting quality. This approach to comparing
11
accounting quality metrics for two groups of firms assumes that the metrics for the firms within
each group are drawn from the same distribution, and that the metrics for firms in different
groups are potentially drawn from different distributions. To the extent that firms within each
group differ in accounting quality as measured by each metric, the variance of the metric’s
distribution will be larger, thereby making it difficult to detect significant differences in
summary statistics between the groups.12
With the exception of the tests for the frequency of small positive and large negative net
income, for which we test for significance of regression coefficients, we test for differences in
each metric using a t-test based on the empirical distribution of the differences. Specifically, for
each test, we first randomly select, with replacement, firm observations that we assign to one or
the other type of firm, depending on the test. For example, when comparing IAS firms and
NIAS firms, we assign firm observations as either IAS or NIAS firms. We then calculate the
difference between the two types of firms in the metric that is the subject of the particular test.
We obtain the empirical distribution of this difference by repeating this procedure 1,000 times.
An advantage of this approach to testing significance of the differences is that it requires no
assumptions about the distribution of each metric. Another advantage is that it can be used for
all of our metrics, even those with unknown distributions (e.g., the ratio of variability of change
in net income to variability of change in cash flow).13
3.2 ACCOUNTING QUALITY METRICS
12
An alternative approach, used in some prior research (Dechow, 1994; Leuz, Nanda, and Wysocki, 2003), is to base comparisons on alternative metrics constructed using a time series of firm-specific data. Data limitations preclude this approach because it would require a time series of observations for each firm that is not overlapping for the pre- and post-adoption periods. Even if this approach were feasible, it is unclear whether this approach would result in more reliable inferences because firm-specific metrics would likely be based on a small number of observations, limiting power and introducing estimation error. The approach also requires assuming intertemporal stationarity of each metric.
13
3.2.1. Earnings Management. We use four earnings management metrics – three for
earnings smoothing and one for managing earnings towards a target. Our first earnings
smoothing metric is based on the variability of the change in net income scaled by total assets,
NI
(Lang, Raedy, and Wilson, 2006).14 We interpret a smaller variance of the change in net
income as evidence of earnings smoothing. However, change in net income is likely to be
sensitive to a variety of factors unattributable to the financial reporting system, i.e., economic
environment and incentives to adopt IAS. Although our matching procedure mitigates the
confounding effects of some of these factors, other effects likely remain. Thus, following Lang,
Raedy and Yetman (2003) and Lang, Raedy and Wilson (2006), our earnings variability metric is
the variance of the residuals from the regression of change in net income on variables identified
in prior research as controls for these factors (Ashbaugh, 2001; Pagano, Röell, and Zechner,
2002; Lang, Raedy, and Yetman, 2003; Tarca, 2005; Lang, Raedy, and Wilson, 2006), NI*:15
.
SIZE is the natural logarithm of end of year market value of equity, GROWTH is percentage
change in sales, EISSUE is percentage change in common stock, LEV is end of year total
liabilities divided by end of year equity book value, DISSUE is percentage change in total
14
DataStream provides several definitions of operating income. The one we use does not include extraordinary items and other non-operating income. However, because the criterion for extraordinary items differs across countries and excluding extraordinary items could result in differences based on the location on the income
statement of one-time items, we replicate the analysis including extraordinary and non-operating items. Using these alternative income measures has no effect on our inferences.
15
liabilities, TURN is sales divided by end of year total assets, CF is annual net cash flow from
operating activities, AUD is an indicator variable that equals one if the firm’s auditor is PwC,
KPMG, Arthur Andersen, E&Y, or D&T, and zero otherwise, NUMEX is the number of
exchanges on which a firm’s stock is listed, XLIST is an indicator variable that equals one if the
firm is listed on any US stock exchange and WorldScope indicates that the US exchange is not
the firm’s primary exchange, and CLOSE is the percentage of closely held shares of the firm as
reported by WorldScope.16 Equation (1) also includes country and industry fixed effects, as do
equations (2) through (8).17
We estimate equation (1) pooling observations that are relevant to the particular
comparison we test. For example, when comparing IAS and NIAS firms in the post-adoption
period, we pool all sample years in the post-adoption period. For this comparison, the variability
of NI* is the variance of IAS and NIAS firms’ respective residuals from equation (1) in the
post-adoption period. When comparing IAS firms in the post- and pre-adoption periods, we pool
all sample years for IAS firms. For this comparison, the variability of NI* is the respective
variance of residuals for IAS firms in the post- and pre-adoption periods. We compare the
difference in the variability of NI* between the post- and pre-adoption periods for IAS and
NIAS firms as the difference between the resulting metrics for IAS and NIAS firms.
Our second earnings smoothing metric is based on the mean ratio of the variability of the
change in net income, NI , to the variability of the change in operating cash flows, CF.
16
Excluding these controls from our tests has no effect on our inferences. 17
Our design will detect differences between groups of firms in earnings smoothing, as measured by residual earnings variability, provided that the mean level of the residuals from equation (1) does not differ significantly between the two groups of firms. For all relevant comparisons of earnings variability, untabulated statistics reveal no significant differences in mean residuals for each group. In addition, the frequency with which the test
Firms with more volatile cash flows typically have more volatile net income, and our second
metric attempts to control for this. If firms use accruals to manage earnings, the variability of the
change in net income should be lower than that of operating cash flows. As with NI , CF is
likely to be sensitive to a variety of factors unattributable to the financial reporting system.
Therefore, we also estimate an equation similar to equation (1), but with CF as the dependent
variable:
As with equation (1), we pool observations appropriate for the particular comparison.18 The
variability of CF* is the variance of groups of residuals from equation (2), where the
composition of the groups depends on the particular comparison we test. Our resulting second
metric is the ratio of the variability of NI* to variability of CF*.
Our third earnings smoothing metric is based on the Spearman correlation between
accruals and cash flows. As with the two variability metrics based on equations (1) and (2), we
compare correlations of residuals from equations (3) and (4), CF* and ACC*, rather than
correlations between CF and ACC directly. As with the equations (1) and (2), both CF and ACC
are regressed on the control variables, but excluding CF:
it
it
Our metric for managing towards positive earnings is the coefficient on small positive net
income, SPOS, in the regressions given by equations (5) and (6). When comparing IAS firms
and NIAS firms in the post-adoption (pre-adoption) period, we estimate equation (5) pooling
observations from the post-adoption (pre-adoption) period.
IAS(0,1)
IAS is an indicator variable that equals one for IAS firms and zero for NIAS firms, and
SPOS is an indicator variable that equals one if net income scaled by total assets is between 0
and 0.01 (Lang, Raedy, and Yetman, 2003). A negative coefficient on SPOS indicates that
NIAS firms manage earnings toward small positive amounts more frequently than do IAS firms.
We base our inferences on the coefficient on SPOS from equation (5) rather than directly
comparing the IAS and NIAS firms’ percentages of small positive income because the SPOS
coefficient reflects the effects of controls for factors unattributable to the financial reporting
system.
When comparing IAS firms in the post-adoption and pre-adoption periods, we estimate
equation (6) pooling IAS firm observations from all sample years.
POST(0,1)it =0+1SPOSit +2SIZEit +3GROWTHit +4EISSUEit+
POST(0,1) is an indicator variable that equals one for observations in the post-adoption period
toward small positive amounts more frequently in the pre-adoption period than they do in the
post-adoption period.19
3.2.2. Timely Loss Recognition. We measure timely loss recognition as the coefficient on
large negative net income, LNEG, in the regressions given by equations (7) and (8) (Lang,
Raedy, and Yetman, 2003; Lang, Raedy, and Wilson, 2006). When comparing IAS firms and
NIAS firms in the post-adoption (pre-adoption) period, we estimate equation (7) pooling
observations from the post-adoption (pre-adoption) period.
IAS(0,1)it =0+1LNEGit+2SIZEit+3GROWTHit+4EISSUEit+
5LEVit+6DISSUEit+7TURNit+8CFit+9AUDit+
10NUMEXit+11XLISTit+12CLOSEit+it
(7)
LNEG is an indicator variable that equals one for observations for which annual net income
scaled by total assets is less than 0.20, and zero otherwise. A positive coefficient on LNEG
indicates that IAS firms recognize large losses more frequently than NIAS firms. As with
equation (5), we use the coefficient on LNEG from equation (7) rather than directly comparing
IAS and NIAS firms’ frequencies of large losses to assess whether IAS firms are less likely to
manage earnings.
When comparing IAS firms in the post-adoption and pre-adoption periods, we estimate
equation (8) pooling IAS firm observations from all sample years.
POST(0,1)it =
0+
1LNEGit +2SIZEit +3GROWTHit +4EISSUEit +
5LEVit +
6DISSUEit +7TURNit+8CFit +9AUDit +
10NUMEXit+
12XLISTit +12CLOSEit+it(8)
19
A positive coefficient on LNEG indicates that IAS firms recognize large losses more frequently
in the post-adoption period than they do in the pre-adoption period.
3.2.3. Value Relevance. The first value relevance metric is based on the explanatory
power from a regression of stock price on net income and equity book value. To obtain a
measure of price that is unaffected by mean differences across countries and industries, which
could affect our comparisons of explanatory power, we first regress stock price, P, on country
and industry fixed effects.20 We regress the residuals from this regression, P*, on equity book
value per share, BVEPS, and net income per share, NIPS, separately for IAS and NIAS firms in
both the post- and pre-adoption periods, i.e., we estimate four regressions.
Following prior research, to ensure accounting information is in the public domain, we
measure P six months after fiscal year-end (Lang, Raedy, and Yetman, 2003; Lang, Raedy, and
Wilson, 2006). Our first value relevance metric is the adjusted R2 from the regression given by
equation (9).
it it it
it BVEPS NIPS
P* =0+1 +2 + (9)
Our second and third value relevance metrics are based on the explanatory power from
regressions of net income per share on annual stock return. Ball, Kothari, and Robin (2000)
predicts that accounting quality differences will be most pronounced for “bad news” because
when firms have “good news” they have less incentive to manage earnings. Thus, we estimate
the earnings-returns relation separately for positive and negative return subsamples. Because we
partition firms based on the sign of the return, we estimate two “reverse” regressions with net
income as the dependent variable, where one is for good news firms and the other is for bad
20
news firms. As with the first value relevance metric, to obtain good and bad news value
relevance metrics that are unaffected by mean differences across countries and industries, we
first regress net income per share, NI/P, on country and industry fixed effects. We regress the
residuals from this regression, NI/P*, on annual stock return, RETURN, the twelve-month stock
return commencing nine months before fiscal year end and ending three months after fiscal year
end (Lang, Raedy, and Wilson, 2006). Our second and third value relevance metrics are the R2s
from the regression given by equation (10) estimated for good news and bad news firms.
it it it RETURN P
NI/ ]* =0+1 +
[ (10)
As with equation (9), we estimate equation (10) separately for IAS and NIAS firms in both the
post- and pre-adoption periods.
4. Data
Our sample comprises1,896firm year observations for 327 firms that adopted IAS
between 1994 and 2003 for which DataStream data are available from 1990 through 2003.
Obtaining data beginning in 1990 provides us with a minimum of four years of pre-adoption
period data. We obtain our sample of IAS firms from Worldscope, which identifies the set of
accounting standards a firm uses to prepare its financial statements.21 We gather financial and
accounting data from DataStream. The sample size reflects our having winsorized at the 5%
level all variables used to construct our metrics to mitigate the effects of outliers on our
inferences.
21
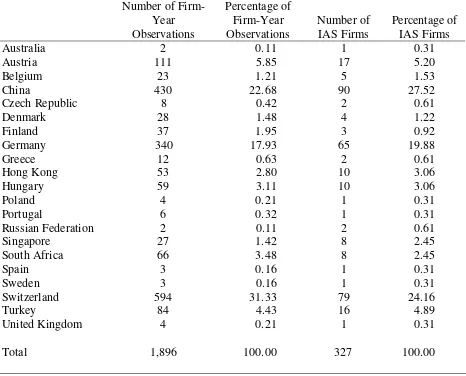
Table 1, panel A, presents the country breakdown of our sample. In general, the sample
is from many countries, with greatest representation from Switzerland, China, and Germany.22
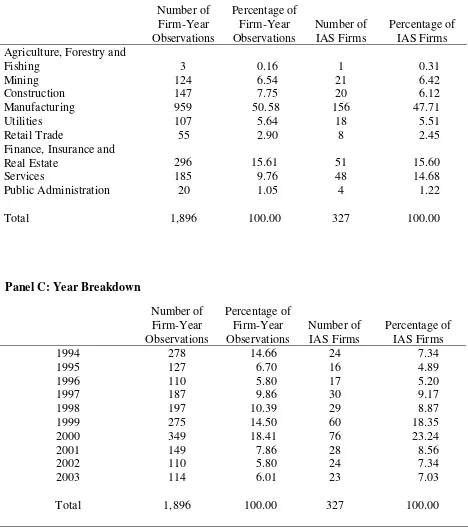
Panel B of table 1 presents the sample industry breakdown. The sample comprises a range of
industries, with most in manufacturing, finance, insurance and real estate, or services. Panel C of
table 1 presents a sample breakdown by IAS adoption year, and reveals variation across years.
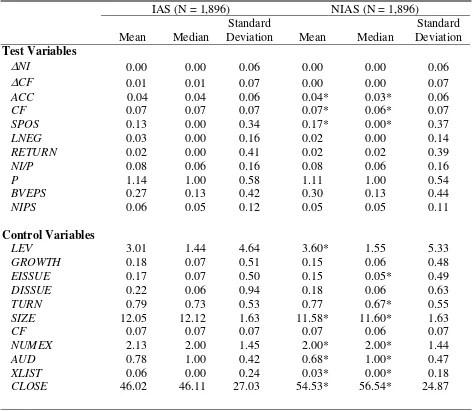
Table 2 presents descriptive statistics relating to variables used in our analyses. Table 2
reveals that IAS firms have significantly fewer incidents of small positive earnings and
insignificantly more incidents of large negative earnings than do NIAS firms.23 Although these
descriptive statistics do not control for other factors, they suggest that IAS firms are less likely
than NIAS firms to manage earnings towards a target and more likely to recognize losses in a
timely manner. In terms of control variables, although IAS firms have higher growth than do
NIAS firms, the difference is not significant. Despite the size match, IAS firms are significantly
larger than NIAS firms. Further, there is some evidence that IAS firms are more likely to issue
debt (mean but not median difference is significant), more likely to issue equity (median but not
mean difference is significant), and are less highly levered (mean but not median difference is
significant). Relating to the last four control variables, on average, IAS firms trade on more
exchanges than NIAS firms, are more likely to be audited by one of the large auditing firms, are
more likely to list on a US stock exchange, and have a smaller percentage of closely held shares.
All of these differences are significant.
22 Our sample of Chinese and German firms includes some firms that are required to apply IAS. These include
Chinese B share firms and German New Market firms. We perform all of our comparisons omitting these firms. None of the inferences differs from those obtained from the tabulated results. The table 1, panel A, country classification includes firms from the listed country that are incorporated off-shore, e.g., in Bermuda. The off-shore incorporation permits these firms to use IAS rather than domestic standards. For example, four UK firms are headquartered and operate in the UK, but are incorporated in Bermuda.
23
5.
Results
5.1POST-ADOPTION ERIOD
Table 3 presents results comparing quality of accounting amounts for IAS and NIAS
firms in the post-adoption period. It reveals that firms applying IAS generally evidence less
earnings management, more timely loss recognition, and more value relevance of accounting
amounts than do firms not applying IAS.
The first finding relating to earnings management indicates that IAS firms exhibit a
significantly higher variability of change in net income, NI*, 0.0026 versus 0.0021. This
difference of residual variances of 0.0005 represents 14 percent of the total variance of the
change in net income, NI (0.0005/0.062), and approximately 21 percent of the residual variance
(0.0005/0.00235), using the midpoint between the two residual variances.24 The second finding
is consistent with the first in that it indicates that the ratio of the variance of change in net
income, NI*, to the variance of change in cash flow, CF*, is higher for IAS firms than for
NIAS firms, although the difference is not significant. In particular, the ratios are 1.1084 and
1.0367 for IAS and NIAS firms, suggesting that the difference in net income variability is not
solely a result of a difference in cash flow variability. Consistent with the first two metrics, the
third finding indicates that the correlation between accruals, ACC*, and cash flow, CF*, for IAS
firms, –0.5437, is significantly less negative than for NIAS firms, –0.5618. This finding
indicates that IAS firms smooth earnings less than NIAS firms. Finally, the coefficient on SPOS,
0.0438, is negative, although not significantly so, which suggests that NIAS firms more
24
frequently report small positive earnings, consistent with managing earnings towards an earnings
target.
The next finding in table 3 relates to timely loss recognition. The significantly positive
coefficient on LNEG, 0.1323, indicates that, incremental to effects associated with our control
variables, IAS firms recognize large losses more frequently than NIAS firms. This finding
suggests that relative to IAS firms, NIAS firms smooth earnings by delaying the effects of large
negative outcomes. In particular, one interpretation of the results relating to SPOS and LNEG
taken together is that managers of NIAS firms smooth away from large negative earnings and
toward small positive net income, resulting in less timely recognition of losses.
The final set of findings in table 3 relates to value relevance of accounting amounts.
First, regressions of price on net income and equity book value for IAS and NIAS firms reveal
that the R2 for IAS firms is significantly greater than that for NIAS firms, 40.10% versus
30.16%. Untabulated regression summary statistics indicate that, as expected, the coefficients on
net income and equity book value are significantly positive for both IAS and NIAS firms, and
that both coefficients are smaller for NIAS firms. Consistent with predictions, the R2 for good
news IAS firms is greater than that for good news NIAS firms (3.88% versus 0.01%). Contrary
to predictions, the R2 for bad news IAS firms is lower than that for bad news NIAS firms (6.21%
versus 7.39%). However, for both comparisons, the difference is not significant.25 Thus,
although the price regression findings indicate that accounting amounts are more value relevant
for IAS than NIAS firms, the returns regression findings do not.
5.2 PRE-ADOPTION PERIOD
25
Table 4 presents findings for earnings management, timely loss recognition, and value
relevance for IAS and NIAS firms in the pre-adoption period. It reveals that with the exception
timely loss recognition, IAS and NIAS firms exhibit no significant differences in accounting
quality in the pre-adoption period. Thus, differences in accounting quality between IAS and
NIAS firms in the pre-adoption period generally do not explain post-adoption period differences.
The first finding relating to earnings management suggests that in the pre-adoption period
IAS firms exhibit a lower variance of the change in net income, NI*, than do NIAS firms,
0.0016 versus 0.0018. Although this difference is not significant, this finding contrasts with that
from the post-adoption period in which IAS firms have a significantly higher variance of NI*.
These results indicate that the higher NI* variance for IAS firms in table 3 in the post-adoption
period is not a result of higher NI* variance for IAS firms in the pre-adoption period. The
second finding indicates that the ratio of the variance of change in net income, NI*, to the
variance of the change in cash flow, CF*, is insignificantly higher for NIAS firms than for IAS
firms, 0.6661 versus 0.6194. This result suggests that IAS firms evidence more earnings
smoothing than NIAS firms in the pre-adoption period. This finding also contrasts with the
finding for the post-adoption period, in which NIAS firms have an insignificantly lower ratio of
the two variances. The third finding indicates that the correlation between accruals, ACC*, and
cash flow, CF*, is insignificantly more negative for IAS firms than for NIAS firms, –0.6073
versus 0.5726. This finding also contrasts with the finding for the post-adoption period, in
which IAS firms have a significantly less negative correlation between accruals and cash flows.
Finally, the coefficient on SPOS, 0.0713, is insignificantly different from zero in the
pre-adoption period, which suggests that NIAS and IAS firms report small positive net income
the first three metrics in which there is suggestive evidence that IAS firms have lower accounting
quality in the pre-adoption period and higher quality in the post-adoption period, there is no such
reversal for the SPOS coefficient between the two periods.
The next finding in table 4 relates to timely loss recognition. It indicates that the LNEG
coefficient, 0.3094, is significantly larger for IAS firms than for NIAS firms. This result
indicates that IAS firms recognize losses more frequently even in the pre-adoption period. Thus,
differences in accounting quality as reflected in our timely loss recognition metric in the
post-adoption period could be attributable to differences in economic characteristics between the two
groups of firms.
The final set of findings in table 4 relates to value relevance. Regressions of price on net
income and equity book value for IAS and NIAS firms reveal that the R2 for IAS firms is
insignificantly larger than that for NIAS firms, 28.03% versus 27.18%, in the pre-adoption
period. In the post-adoption period, this R2 is significantly larger for IAS firms. These findings
indicate that the higher value relevance for IAS firms as evidenced by the price regressions in the
post-adoption period is not attributable to higher value relevance in the pre-adoption period. The
R2 from a regression of net income on returns for good (bad) news IAS firms, 2.24% (4.64%), is
insignificantly smaller (larger) than that for good (bad) news NIAS firms, 2.99% (1.84%). As in
the post-adoption period, these findings suggest that there are no value relevance differences
between IAS and NIAS firms in the pre-adoption period as evidenced by the good and bad news
regressions.
5.3 COMPARISON OF POST- AND PRE-ADOPTION PERIODS FOR IAS FIRMS
Overall, results for the pre-adoption period provide little evidence that differences in
characteristics between IAS and NIAS firms. Table 5 presents a comparison of our quality
metrics for IAS firms before and after they adopt IAS.26 Tests for all metrics are consistent with
improvements in accounting quality with application of IAS, with four of the eight differences
being significant.
Table 5 reveals that variability of change in net income increases significantly from
0.0017 to 0.0024, and variability of change in net income relative to that of cash flow also
increases significantly from 0.7442 to 0.9900. The correlation between accruals and cash flows
after adoption, 0.5445, is less negative than before adoption, 0.5726, but insignificantly so.
Similarly, as indicated by the SPOS coefficient of 0.0640, the frequency of small positive net
income decreases after adoption, although this decrease is insignificant. Regarding timely loss
recognition, as indicated by the significant LNEG coefficient of 0.1536, the frequency of large
negative net income is significantly higher post-adoption than pre-adoption. The R2s from the
price regressions and from the good and bad news returns regressions also increase from 28.20%,
2.24%, and 4.64% in the pre-adoption period to 40.10%, 3.88%, and 6.21% in the post-adoption
period, although the increase is significant only for the price regression.
5.4 DIFFERENCE IN CHANGES FOR IAS AND NIAS FIRMS
Our final analysis examines whether change in accounting quality for IAS firms between
the pre- and post-adoption periods is greater than that for NIAS firms. However as section 3.1
explains, the tables 3, 4, and 5 findings make comparison of changes in accounting quality
differences logically redundant. This is because the findings indicate that accounting quality for
26 Although this analysis has the advantage of using each firm as its own control, three caveats apply. First, because
IAS firms improves from the pre- to post-adoption periods, is greater than that for NIAS firms in
post-adoption period, but is not different from that for NIAS firms in the pre-adoption period.
The results in table 6 generally suggest that IAS firms experience a greater improvement
in accounting quality than do NIAS firms between the pre- and post-adoption periods.
Differences in changes for three of the four earnings management metrics and two of the three R2
metrics are in the predicted direction, although only the difference in changes for the variability
of NI* is significant. Managing to a target, timely loss recognition, and bad news R2
differences in changes results are contrary to predictions, although none of these differences is
significant. Also as explained in section 3.1, given the findings in tables 3, 4, and 5, the general
lack of significance in table 6 stems from a loss of power arising from differencing metrics that
have estimation error (Landsman and Magliolo, 1988).
6.
Summary and Concluding Remarks
Our results indicate accounting amounts of firms that apply International Accounting
Standards are of higher quality than those of non-US firms that do not. The accounting amounts
we compare result from the interaction of features of the financial reporting system, which
include accounting standards, their interpretation, enforcement, and litigation. Generally, we
find that firms applying IAS exhibit less earnings smoothing, less managing of earnings towards
a target, more timely recognition of losses, and a higher association of accounting amounts with
share prices and returns. Although we include research design features to mitigate the effects of
incentives and the economic environment, we cannot be sure that our findings are attributable to
the change in the financial reporting system rather than to changes in firms’ incentives and the
Our inferences are based on comparisons of accounting quality metrics for a broad
sample of firms in 21 countries that adopted IAS between 1994 and 2003. In particular, we
compare accounting quality metrics for firms that apply IAS to those for a matched sample of
non-US firms that do not in the period after the IAS firms adopt IAS. We generally find that IAS
firms have higher accounting quality than firms that do not apply IAS. Differences in accounting
quality between the two groups of firms in the period before the IAS firms adopt IAS do not
account for the post-adoption differences. We also compare accounting quality metrics for IAS
firms in the periods before and after they adopt IAS. We generally find that IAS firms evidence