HUMAN RESPONSE TO
VIBRATION
Neil J.Mansfield
CRC PRESS
This edition published in the Taylor & Francis e-Library, 2005.
“To purchase your own copy of this or any of Taylor & Francis or Routledge’s collection of thousands of eBooks please go to http://www.ebookstore.tandf.co.uk/.”
Library of Congress Cataloging-in-Publication Data
Mansfield, Neil J.
Human response to vibration/Neil J.Mansfield. p. cm. Includes bibliographical references and index. ISBN 0-415-28239-X 1. Vibration—Physiological effect. I. Title.
QP82.2. V5M36 2004 612′.01445–dc22 2004054491
This book contains information obtained from authentic and highly regarded sources. Reprinted material is quoted with permission, and sources are indicated. A wide variety of references are listed. Reasonable efforts have been made to publish reliable data and information, but the author
and the publisher cannot assume responsibility for the validity of all materials or for the consequences of their use.
Neither this book nor any part may be reproduced or transmitted in any form or by any means, electronic or mechanical, including photocopying, microfilming, and recording, or by any information storage or retrieval system, without prior permission in writing from the publisher. The consent of CRC Press LLC does not extend to copying for general distribution, for promotion,
for creating new works, or for resale. Specific permission must be obtained in writing from CRC Press LLC for such copying.
Permission to reproduce BS EN ISO 5349–2:2002, BS EN ISO 8662-(4 & 6): 1995, and BS EN ISO 10819:1997 is granted by BSI. British Standards can be obtained from BSI Customer
Services, 389 Chiswick High Road, London W4 4AL. Tel. +44 (0)20 8996 9001. E-mail: [email protected].
Direct all inquiries to CRC Press LLC, 2000 N.W. Corporate Blvd., Boca Raton, Florida 33431.
Trademark Notice: Product or corporate names may be trademarks or registered trademarks, and
are used only for identification and explanation, without intent to infringe.
Visit the CRC Press Web site at www.crcpress.com
© 2005 by CRC Press LLC
No claim to original U.S. Government works
ISBN 0-203-48722-2 Master e-book ISBN
ISBN 0-203-57102-9 (Adobe e-Reader Format)
Preface
I feel fortunate to work in the field of environmental ergonomics, with a particular interest in human response to vibration. Those working in this discipline have proved, over many years, to be a welcoming group of people, and many of my former colleagues and collaborators I now regard as friends. Through continued collaboration and sharing of ideas, data, and results, this international community of researchers and practitioners has developed an understanding of the many facets of human response to vibration; however, we still have a long way to go, and there are still many unknowns.
This book has been written with the consultant, practitioner, and student in mind, although it is also hoped that the research community will find it helpful. It is designed to educate, to be used for reference and, hopefully, to stimulate new ideas for the next generation of specialists. In many areas of human response to vibration we have confidence in our understanding; in many other areas there is conflicting opinion and data. Thus, one must approach the topic with caution. It is hoped, and expected, that some of the ideas presented in this book will develop as time passes, and therefore this publication can only represent a snapshot of understanding, rather than a definition of fact. This is the nature of scientific research and one of the attractive aspects of the profession.
Unfortunately, no book can osmotically transfer experience, and so readers must be prepared to get on site and to gain their own experiences. Fortunately, in many cases, time on site can be spent working on interesting projects, in interesting places, and with interesting people. These experiences can be quite enjoyable.
Usually, human vibration specialists aim to reduce the exposure to, and the effects of, the mechanical stimulus. Indeed, the concept of excessive vibration being unpleasant is well established in the vernacular and has been for centuries. Although the Beach Boys might have been pleased to experience their “Good Vibrations,” my own foundation is well summarized by the Psalmist King David:
My soul finds rest in God alone; my salvation comes from him. He alone is my rock and my salvation; he is my fortress, I will never be shaken.
Acknowledgments
I would like to thank several groups of people who have made this book possible.
First, I must thank Gurmail Paddan, Rupert Kipping, and Sharon Holmes for their helpful comments on the first drafts of the manuscript. Their technical, medical, and literary advice was valuable.
I am grateful to former colleagues for providing inspiration in the field, especially Lage Burström, Mike Griffin, Patrik Holmlund, Chris Lewis, Ronnie Lundström, and Setsuo Maeda, in addition to all of the members of the “UK Group.” Colleagues within the Environmental Ergonomics Research Cluster of the Department of Human Sciences, Loughborough University, make my research a pleasure to undertake, and I would like to acknowledge Ken Parsons, George Havenith, Peter Howarth, Andrew Rimell, Simon Hodder, Sarah Atkinson, Stacy Clemes, Aili Haasnoot, Gerry Newell, and Luca Notini for their contributions.
Contents
Chapter 1
Introduction to Vibration 1 Chapter 2 Whole-Body Vibration 14 Chapter 3
Motion Sickness 60 Chapter 4
Hand-Transmitted Vibration 87 Chapter 5
Vibration Measurement 109 Chapter 6
Whole-Body Vibration Standards 156 Chapter 7
Hand-Transmitted Vibration Standards 189 Chapter 8
European Directives 211
References 228
1
Introduction to Vibration
1.1HUMAN RESPONSE TO VIBRATION IN CONTEXT
Humankind has always had the desire to build, create, and explore. Each of these activities has involved exposure to vibration, whether the source comes from primitive axes, handsaws or riding in carts, from using power tools, industrial machines, or riding in planes, trains, and automobiles. As modern man has harnessed power sources in more efficient ways, the apparatus used to build, create, and explore have used more energy and, as a result, increased quantities of energy have been dissipated in the form of vibration, some of which has been transmitted to people.
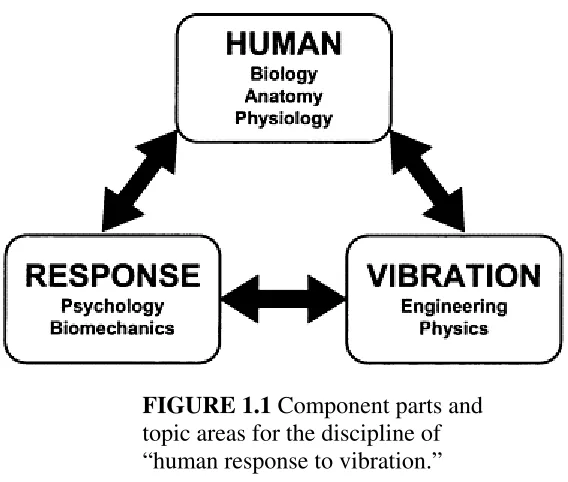
One of the most rewarding aspects of studying human response to vibration is its truly multidisciplinary nature (Figure 1.1). For example, the authors listed in the references have varied backgrounds that include engineering, psychology, the natural sciences, clinical medicine, and ergonomics. If the phrase “human response to vibration” is deconstructed into its component parts, then we can consider that a complete grasp of the discipline requires an understanding of the human (biological, anatomical, and physiological aspects), their response (psychological and biomechanical aspects), and the nature of the vibration (in terms of the engineering and underlying physics). Although most researchers have a focus in one of the three main areas, it is the understanding of the interactions between these component parts that is essential in developing our understanding of the topic.
The human aspects and response aspects are the focus of Chapter 2, Chapter 3, and Chapter 4 of this book. Other chapters consider the practicalities of applying this knowledge and the frameworks that are defined in standards and directives. This chapter considers the underlying nature of vibration itself and defines some of the vocabulary that will be used throughout the rest of the book. It considers the fundamentals of wave theory that underpin the discipline (Section 1.2), how vibration is classified when it comes to human response (Section 1.3), and how vibration axes are defined (Section 1.4).
1.2INTRODUCTION TO WAVE THEORY
FIGURE 1.1
Component parts and
topic areas for the discipline of
“human response to vibration.”
This section gives only an introduction to the fundamentals of wave theory. For a more complete discussion of the topic, the reader could consult, for example, Kinsler et al. (2000) or Harris and Piersol (2002).
1.2.1SIMPLE WAVES
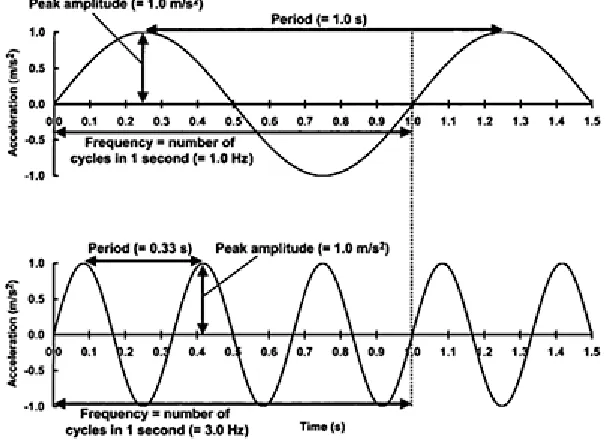
The most simple type of wave is defined mathematically as:
a(t)=A sin (2πft)
where a(t) is the acceleration (measured in m/s2) at time t. This wave has an amplitude A
and a frequency f cycles per second (unit=hertz, Hz; Figure 1.2). Such waves are known
as sine waves. If the frequency of the wave increases, then the period of the wave will decrease. This means that as each individual cycle takes less time, the frequency rises. In the engineering literature, frequency can also be expressed in terms of radians per second (ω) where:
ω=2πf
To define a simple sine wave, we need to know its frequency, its amplitude, and the time from the starting point. Unfortunately, human vibration exposures are rarely these simple sine waves. Therefore, more complex descriptions of waves are required.
1.2.2ADDING WAVES
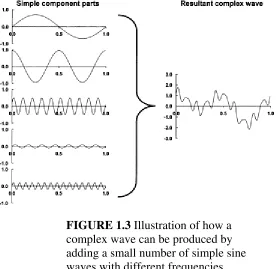
Complex waves can be produced by the addition of sine waves with different amplitudes, frequencies, and phases (i.e., time delays from the start of the wave). This principle of
superposition means that when individual component waves interact, the resultant vibration is equal to the sum of all of the components. For example, if five waves of different frequencies are summed, then a complex wave results
FIGURE 1.2
Basic descriptors for a
1-Hz and a 3-1-Hz wave with a peak
amplitude of 1.0 m/s
2.
(Figure 1.3). The beauty of this phenomenon is that the superposition process can be reversed using mathematical techniques such that a complex wave can be resolved into simple component parts, each with different amplitudes, phases, and frequencies. It is this process that allows for consideration of human responses to vibration with simultaneous components of different frequencies. These are the types of vibration signals that are encountered in the real world (e.g., when driving a car, the occupants are simultaneously exposed to low-frequency vibration caused by the general road profile in addition to higher-frequency vibration caused by the roughness of the road surface).
1.2.3DlSPLACEMENT, VELOCITY, AND ACCELERATION
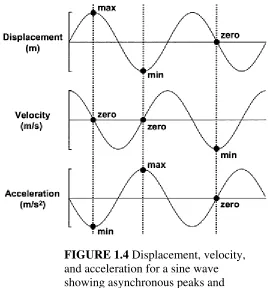
Any vibration signal has three qualities: its displacement, velocity, and acceleration, which are inextricably linked. Consider a slow-moving vertical oscillation, such as a ship rising and falling on large waves. The ship rises on each wave, stops on the wave crest, falls into the trough, and stops and rises again on the next wave. The maximum vertical displacement occurs when the ship is at the top of each wave, yet this coincides with the instant of zero velocity. The greatest velocity occurs while rising or falling (positive or
negative). The minimum vertical displacement occurs when the ship is in each trough, when, again, there is zero velocity. There is also an associated cyclic acceleration and deceleration due to the constantly changing velocity. For any wave, the displacement, velocity, and acceleration do not coincide
FIGURE 1.3
Illustration of how a
complex wave can be produced by
adding a small number of simple sine
waves with different frequencies,
magnitudes, and phase shifts.
with one another; indeed, for a sine wave, the displacement and acceleration have an inverse relationship (Figure 1.4).
Depending on the frequency of the vibration, the displacement, velocity, or acceleration can dominate the mechanism of perceiving whether an object is vibrating. At low frequencies, displacement is the most important property. For example, a person looking out of the window from the top floor of a very tall building on a blustery day might be able to see that he or she is slowly swaying (as tall buildings are designed to do) by observing their relative displacement to the ground, yet not perceive any acceleration or velocity. At intermediate and high frequencies, velocity and acceleration are the most important properties, respectively. For example, it is often easy to perceive the high-frequency vibration from a fan in a piece of electrical equipment by lightly touching the surface of the casing, yet there is no other cue that any vibration exists (e.g., visual).
1.2.4RESONANCE
If a compliant mechanical structure is oscillated very slowly, then it will move as a single coherent unit, acting as a pure mass. However, at high frequencies, the vibration can be localized to the point of application, i.e., the structure is isolated from the vibration. It is this principle that is used in car suspensions, engine mounts, and in isolation mechanisms for turntables and CD players. Between these high and low frequencies is a zone where the response of the system will be maximized when compared to the stimulus (Figure 1.5). This is known as reso-
FIGURE 1.4
Displacement, velocity,
and acceleration for a sine wave
showing asynchronous peaks and
troughs.
nance. All compliant systems have a resonance frequency, and complex structures have more than one. Many famous disasters have ultimately resulted from a resonant failure, including the 1940 Tacoma Narrows bridge collapse where a new suspension bridge was unable to withstand the high winds that induced vibration at its resonance frequency.
To ensure that vibration at the resonance frequency does not build up to a point of failure, engineering structures are damped. However, there is a trade-off, as the more damping that exists in a system, the less effective it will be at isolating from high frequency vibration. Humans are inherently highly damped, although resonances are still
clearly observable. These resonances mean that if an individual is exposed to vibration, his or her response will depend not only on the magnitude but also on the frequency of the stimulus.
1.2.5REPRESENTATION OF VIBRATION SIGNALS
Vibration can be presented in a graphical form where the x-axis of the graph represents time and the y-axis represents the acceleration at any time. This is known as representation in the “time domain.” Although time-domain representations are useful in understanding the waveform of the motion, they are difficult to interpret and cannot usually be applied to standardized analysis methods. Time-domain signals are always presented with linear axes.
An alternative representation of vibration is to present it in the “frequency domain” where the x-axis of the graph is frequency and the y-axis is vibration magnitude. This allows for a representation of how much vibration energy exists
FIGURE 1.5
Response of a simple
dynamic system to vibration. At low
frequencies, the response equals the
stimulus; around the resonance
frequency the response is greater than
the stimulus; at high frequencies the
response is less than the stimulus. As
damping increases, the peak response
decreases.
at each frequency and is often more useful than time-domain representations for practical purposes. Depending on the application, frequency-domain graphs can be presented with
linear or logarithmic axes. For whole-body vibration, the xaxis is usually linear; for hand-transmitted vibration, the x-axis is usually logarithmic. Although frequency-domain graphs are sometimes presented with linear y-axes, human responses to physical stimuli are usually proportional to the logarithm of the stimulus magnitude (e.g., Stevens’ Law; Stevens, 1957) and so a logarithmic y-axis is usually most appropriate when considering the human response to the vibration.
1.3CLASSIFICATION OF VIBRATION
Vibration can be classified using a variety of descriptors. Some of these terms are technical and have specific meaning; others are more generic and the meaning is dependent on the context of use.
1.3.1CLASSIFICATION OF VIBRATION BY CONTACT SITE, EFFECT, AND FREQUENCY
People are primarily exposed to either localized vibration or vibration that affects the whole body. Usually, localized vibration only affects the hand-arm system, as it is caused by an individual holding a vibrating object such as a tool, workpiece, or control device (e.g., a joystick, handlebars, or steering wheel). In this case, the vibration is termed “hand-transmitted” or “hand-arm” vibration. These terms are
FIGURE 1.6
Typical frequency
ranges and magnitudes of interest for
the study of motion sickness,
whole-body vibration, and hand-transmitted
vibration.
sometimes abbreviated to HTV or HAV, respectively. If this vibration is of sufficient magnitude and occurs long enough, then hand-arm vibration syndrome (HAVS) can develop. HAVS is characterized by disorders of the muscles, nerves, bone, joints, and circulatory systems, the most well known of which is vibration-induced white finger (VWF). The effects of hand-transmitted vibration are most marked at relatively high frequencies, with the range of 8 to 1000 Hz generally considered to be the most important (Figure 1.6). Localized vibration can also occur at other sites, such as at the feet due to pedal vibration, but it is unusual to observe any adverse human responses in these situations.
“Whole-body vibration” is vibration that affects the whole of the exposed person, i.e., the vibration affects all parts of the body. It is usually transmitted through seat surfaces, backrests, and through the floor, although it can also be important for those standing or lying, such as for those traveling on busy commuter trains or patients being transported by ambulance. Most whole-body vibration exposures are associated with transportation where vehicle drivers or passengers are exposed to mechanical disturbances and impacts while traveling. Whole-body vibration can affect comfort, performance, and health, depending on the magnitude, waveform, and exposure times. People are most sensitive to whole-body vibration within the frequency range of 1 to 20 Hz, although many measurements include higher frequencies. Whole-body vibration is sometimes abbreviated to WBV.
The final classification of human vibration by contact site, effect, and frequency is vibration that causes motion sickness. Motion sickness can occur when a person is exposed to real or apparent low-frequency motion (below 1 Hz). Although it is true that the whole body is affected by such stimuli, the frequency range of interest and the effects of the vibration are distinct from those relevant to whole-body vibration and so the topic is usually considered separately.
FIGURE 1.7
Categorization of types
of oscillatory motion. [Adapted from
Griffin, M.J. (1990).
Handbook of
Human Vibration.
London: Academic
Press.]
1.3.2CLASSIFICATION OF VIBRATION BY WAVEFORM
Vibration can occur with a wide range of waveforms (Figure 1.7). Sometimes the future waveform can be determined from knowledge of a previous waveform or mathematical
function; this type of motion is termed “deterministic.” If the motion cannot be predicted from previous events or other knowledge, then it is termed “random.” Deterministic motion can be of two types. Either the vibration is a motion that is repeated, whereby each successive cycle is identical (“periodic” motion, such as a sine wave), or the vibration could only occur as one cycle at a time (“nonperiodic” motion). Nonperiodic motion is sometimes subcategorized as “transient” or “shock” motion.
In practice, vibration that humans are exposed to is usually random. If the random motion’s statistical properties do not change over time, then the vibration is said to be “stationary.” If the statistical properties do change over time, then the vibration is said to be “nonstationary.” When vibration is measured in an environment, it is usually assumed that the vibration is stationary. This means that the measurement that is being taken is representative of any other measurement that could be taken (i.e., the statistical properties would not change over time). However, this assumption is never perfectly true and is, occasionally, wildly inaccurate. When interpreting or generating measurement data, the nonstationarity should be considered, especially if the results are close to critical values (e.g., when ranking the “best” and “worst” machine or assessing compliance to a standard or legal obligation).
1.3.3CLASSIFICATION OF VIBRATION BY MAGNITUDE
Different industrial sectors treat vibration in different ways, essentially due to associated magnitudes and coupled effects. At low magnitudes, issues of refinement and perception can be important (Figure 1.6). These issues form the focus for research and product development in sectors such as the automotive industry, where seat and steering wheel vibration is tuned to optimize comfort and perceptions of quality. Sports equipment manufacturers might be concerned with improving the “feel” of their products by optimizing the transmission of vibration to the competitor. These industries have a focus on the psychophysical aspects of the human response to vibration and need not be concerned with, for example, health effects.
At higher magnitudes, vibration could cause discomfort, reduce performance and induce activity interference. This is of interest to, for example, the military
FIGURE 1.8
Vibration axes for
whole-body vibration centered at the
feet, seat, and back. [Adapted from
British Standards Institution (1987).
Measurement and evaluation of human
exposure to whole-body mechanical
vibration and repeated shock. BS 6841.
London: British Standards Institution.]
sector where individuals are required to perform optimally under potentially challenging environmental conditions. In this context, considerations of “feel” or “ride quality” are not relevant.
For those exposed to relatively high magnitudes of vibration for extended periods of time (or extreme magnitudes for short periods of time), injury could occur. This is primarily of interest in an occupational health context. Manufacturers of machines, vehicles, or tools have an interest in reducing the vibration to give a competitive edge, whereas purchasers seek to protect their workforce with affordable, yet optimized, products with an acceptable magnitude of vibration emission. Again, these stakeholders are not concerned with the refinement of the dynamic environment.
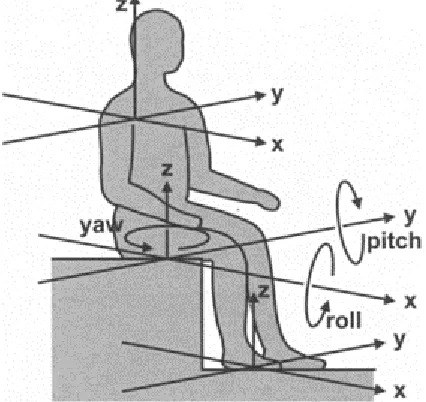
1.4VIBRATION AXES
Vibration can occur in any direction. Complex stimuli simultaneously move vertically, laterally, and in the fore-and-aft directions. In addition, rotation is possible, producing a total of six axes of potential movement.
For whole-body vibration, the fore-and-aft direction is defined as the x-axis, lateral as the y-axis, and vertical as the z-axis (Figure 1.8). Roll is rotation around the x-axis, pitch is rotation around the y-axis, and yaw is rotation around the z-axis. Therefore, considering head motion, roll corresponds to tilting the head to either side, pitch corresponds to a nodding motion, and yaw corresponds to the conventional shaking of the head. For a standing person, the axes are those for the feet (i.e., while sitting, the thighs are aligned to the x-axis, but are aligned to the z-axis when standing). For a supine person, the axes, relative to the individual, are the same as
FIGURE 1.9
Vibration axes for
hand-transmitted vibration. The y-axis is out
of the page. The coordinate system is
centered on the head of the third
metacarpal. [Adapted from
International Organization for
Standardization (1997). Mechanical
vibration and shock: Human
exposure—biodynamic coordinate
systems. ISO 8727. Geneva:
International Organization for
Standardization.]
for standing (i.e., foot-to-head is the z-axis). It should be noted that other specialisms within biomechanics use different coordinate systems to those that are used for whole-body vibration (e.g., gait analysis). Therefore, to avoid confusion, it is usually appropriate to define the x-, y-, and z-axes within any document.
For hand-transmitted vibration, there is a single coordinate system that is based on the head of the third metacarpal (i.e., the middle knuckle). The x-axis is through the palm, the y-axis is across the palm towards the thumb, and the z-axis extends towards the fingers parallel with the back of the hand (Figure 1.9). Defining the coordinate system at the third metacarpal ensures that there is no confusion regarding axes for palm or power grips or any orientation of the hand. Although it is probable that rotational vibration will affect the hand, it has rarely been studied, and no standardized terminology exists other than rotation about the x-, y-, or z-axes.
1.5CHAPTER SUMMARY
Human response to vibration is a multidisciplinary topic involving biology, psychology, biomechanics, and engineering. Although these topics are sometimes considered in isolation, understanding the interactions between them is key to gaining a grasp of the topic area. Vibration is mechanical oscillation about a fixed reference point. In practice, people are exposed to complex waveforms, although these can be represented by their component parts defined as a summation of sine waves. Human vibration is usually classified as either hand-transmitted vibration, whole-body vibration, or motion sickness, and these subdisciplines are often considered separately from one another. Motion sickness is only concerned with frequencies below 1 Hz, whole-body vibration is concerned with frequencies from about 1 to 100 Hz, and hand-transmitted vibration is concerned with frequencies from about 8 to 1000 Hz. Vibration occurs in six axes simultaneously. For whole-body vibration, these are the x-axis, y-axis, and z-axis (fore-and-aft, lateral, and vertical, respectively) and rotation about these axes (roll, pitch, and yaw). Often, rotational vibration is neglected in vibration analysis. For hand-transmitted vibration the x-axis passes through the palm, the y-axis across the palm, and the z-axis parallel with the back of the hand in the direction of the fingers.
2
Whole-Body Vibration
2.1INTRODUCTION
It is common for people to experience whole-body vibration on most days of their lives. An office worker may travel to work in a car, a bus, a train, or use a bicycle or motorcycle. A factory worker may use industrial trucks; an agricultural worker may drive a tractor; military personnel travel in many types of tracked and wheeled vehicles across rough terrain, or may fly in aircraft or travel in ships and boats. Other workers such as astronauts, jockeys, race car drivers, and cabin crew may be exposed to whole-body vibration or they may be paid to participate in experimental research studying the effects of vibration on humans. In these and many other environments, people are primarily exposed to vibration while seated and are exposed to a wide range of vibration magnitudes, waveforms, and durations.
Whole-body vibration occurs when a human is supported by a surface that is shaking and the vibration affects body parts remote from the site of exposure. For example, when a forklift truck drives over a bumpy surface, vibration is transmitted through the vehicle to the seat and footrest, which are the surfaces that support the driver. The vibration is then transmitted through the body of the driver to the head, which will move. This transmission path includes the seat (Section 2.5); the surface of the driver in contact with the vehicle (Section 2.2) including the driver’s nervous system (Section 2.3); the skeleton, including the spine where an injury might occur (Section 2.4); and ultimately the skull, which might have its own dynamic responses to the transmitted vibration (Section 2.6).
2.2WHOLE-BODY VIBRATION PERCEPTION
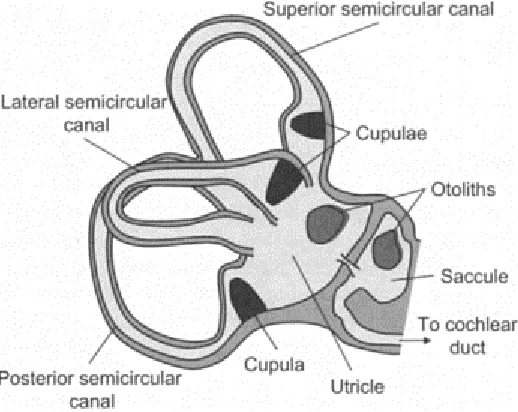
FIGURE 2.1
Anatomy of the
vestibular complex, located in the
inner ear.
2.2.1MECHANISMS OF PERCEPTION
The body does not contain a single vibration-sensing organ but combines signals from the visual, vestibular, somatic, and auditory systems. Each of these systems can sense vibration in more than one way, and will be considered in turn.
For high-displacement and therefore low-frequency oscillation, one can clearly see movement by changes in the relative position of objects on the retina. The visual system might also sense vibration by observing motion of other objects in the vibration environment. For example, a rear-view mirror of a car might vibrate, blurring the image; drapes and lights might swing in response to movement; the surface of a drink might show ripples. Finally, the eyeball itself can resonate at frequencies between 30 to 80 Hz, blurring vision (e.g., Stott et al., 1993).
The vestibular complex of the inner ear includes the semicircular canals and the vestibule, which are sensitive to rotational and linear acceleration, respectively (Figure 2.1). Endolymph in the three orthogonally orientated semicircular canals has inertia. Hence, when the head rotates, the endolymph applies a force on the gelatinous cupula, which bends and stimulates the embedded hair cells and thus the nerves to which they are attached. The vestibule is composed of two sacs, the utricle and the saccule. Hair cells within these sacs are embedded in a gelatinous substance that is topped with small calcium crystals (otoliths). When the head is exposed to linear acceleration, or when it changes its orientation to gravity, the mass of the otoliths causes a distortion of the hair cells, which again are connected to the nervous system.
The somatic system can be subdivided into three elements: kinesthetic, visceral, and cutaneous. Kinesthetic sensation uses signals from proprioceptors in the joints, muscles, and tendons to provide feedback to the brain on the position and forces within segments. Similarly, visceral sensation uses receptors in the abdomen. Cuta-neous sensation consists of a combined response of four types of nerve endings in the skin (see also Section 4.2). Ruffini endings are located in the deep layer of the skin (the dermis) and respond not only to high-frequency vibration (100 to 500 Hz) but also lateral stretching and pressure. Pacinian corpuscles are also located in the dermis but respond to vibration in the 40 to 400 Hz frequency range. Merkel’s disks are located closer to the surface of the skin (the epidermis) and respond to perpendicular pressure at frequencies below 5 Hz. Meissner’s corpuscles are also located close to the skin surface and are sensitive to vibration between 5 and 60 Hz.
The final sensory system for whole-body vibration is the auditory system. In most vehicles, exposure to transients and shocks can be heard by radiation through the structure of the vehicle. At higher frequencies (above 20 Hz), vibrating surfaces can also act as loudspeakers, directly driving the air, and this can result in auditory perception. Also, there is some evidence that skull-conducted vibration can be “heard” at approximately one tenth of the magnitude required for cutaneous feeling (Griffin, 1990).
This combination of sensory signals must be assimilated by the brain to produce a cognitive model of the motion environment. Therefore, psychophysical techniques are appropriate for the investigation of the human perception of vibration (e.g., Coren et al., 1999). Experimental studies have shown the maintenance of Stevens’ Law, which states that sensation magnitude increases proportionally to the stimulus magnitude raised to some power:
S=cIm
where S is the sensation magnitude, c is a constant, I is the stimulus magnitude, and m is
the value of the exponent (see also Subsection 2.3.3).
Similarly, experimental studies have shown the maintenance of Weber’s Law, which states that the smallest perceivable change in magnitude, the difference threshold, is proportional to the magnitude of the stimulus:
∆I=kI
where ∆I is the difference threshold and k is a constant. For example, for simulated
automobile seat vibration, Weber’s Law has been shown to hold with a difference threshold of about 13% for a variety of road stimuli (Mansfield and Griffin, 2000).
2.2.2PERCEPTION IN SEATED POSTURES
Most exposure to whole-body vibration occurs in seated postures while people are driving or are passengers in transportation. Therefore, most research into the perception of whole-body vibration has used subjects in seated postures. These studies can use two approaches: either to map the perception threshold with frequency or to map equal-intensity curves with frequency. Usually, studies have been carried out in the laboratory using single-axis sinusoidal signals due to the methodological difficulties in using
complex multiaxis stimuli. One common finding is that individuals vary in their perception thresholds, often by a factor of 2:1.
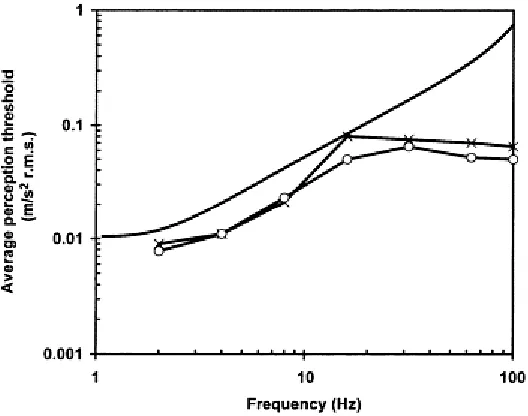
FIGURE 2.2
Average detection
thresholds for 75% detection
probability for sinusoidal vertical
whole-body vibration of seated
subjects and perception threshold from
BS 6841 (1987) for 50% of alert fit
persons. [Mean data from Benson and
Dilnot, 1981 (-x-); median data from
Parsons and Griffin, 1988 (-O-);
threshold values from BS 6841, 1987
(—)].
For vertical vibration, the motion is perceived most easily at about 5 Hz (e.g., Benson and Dilnot, 1981; Parsons and Griffin, 1988; Howarth and Griffin, 1988). Sinusoidal vibration can be perceived at about 0.01 m/s2 r.m.s. at 5 Hz, equating to a displacement of
about 0.01 mm r.m.s. (Figure 2.2). Below 1 Hz, about 0.03 m/s2 r.m.s. is required for perception; at 100 Hz, about 0.1 m/s2 r.m.s. is required for perception. Below 0.5 Hz, it is
possible to see motion that cannot be perceived using other physiological systems. For horizontal vibration, the motion is perceived most easily below 2 Hz (e.g., Parsons and Griffin, 1988; Howarth and Griffin, 1988). As for vertical vibration, sinusoidal horizontal motion can be perceived at about 0.01 m/s2 r.m.s. at the most sensitive
frequencies (Figure 2.3). For 1 Hz, 0.01 m/s2 r.m.s. equates to a displacement of about
0.25 mm r.m.s. Above about 2 Hz, sensitivity decreases to a threshold of about 0.4 m/s2
r.m.s. at 80 Hz.
BS 6841 (1987) also provides guidance on perception thresholds. This states that 50% of alert and fit persons can just detect a weighted vibration with a peak magnitude of approximately 0.015 m/s2 (which equates to 0.01 m/s2 r.m.s. for sinusoidal signals). The
standardized threshold value applies to vertical and horizontal vibration.
2.2.3PERCEPTION IN NONSEATED POSTURES
Despite most whole-body vibration exposures occurring for seated postures, there are many environments where other postures are important. For example, rush-hour travel often involves standing in trains, trams, or buses; travelers sleep in prone, supine, or semisupine postures on ships or aircraft; injured patients are transported
FIGURE 2.3
Median detection
thresholds for 75% detection
probability for sinusoidal horizontal
whole-body vibration of seated
subjects and perception thresholds
from BS 6841 (1987) for 50% of alert
fit persons. [Data from Parsons and
Griffin, 1988: fore-and-aft (-x-) and
lateral (-O-)
;threshold values from BS
6841, 1987 (—)].
to and from hospital or are evacuated from military operations in supine postures; and many sleeping areas are exposed to ground-borne vibration from passing heavy trucks or trains.
In standing postures, perception thresholds for whole-body vibration at the floor are generally similar to those for vibration at the seat for seated persons, although there is some evidence for a decreased sensitivity to horizontal vibration when standing (e.g., Parsons and Griffin, 1988). However, due to the similarity of the anatomy of the hand and foot and anecdotal evidence of “vibration white toe” (Pelmear and Wasserman, 1998), it might also be appropriate to assess perception of vibration at the feet using techniques developed for hand-transmitted vibration. (There are some studies of vibration perception thresholds for individual toes in the literature on diabetes, but these have been carried out using methodologies that do not include the support of bodyweight on the feet. There are no known studies of vibration perception thresholds for the feet that have been carried out using techniques similar to those usually employed for whole-body vibration research.)
In recumbent postures, vibration perception thresholds are similar to those for seated postures. It should be noted that vertical vibration of the supporting surface is most easily perceived at about 5 Hz, irrespective of whether that corresponds to the z-axis (seated), x-axis (lying prone or supine), or y-x-axis (lying on one side) motion for the biomechanical coordinate system (Maeda et al., 1999; Yonekawa et al., 1999).
2.2.4FREQUENCY WEIGHTINGS
A frequency weighting is a frequency response function that models the response of the body to wave phenomena. Another way of considering frequency weightings is that they are an inversion of an equal response (e.g., perception, pain) curve. In Subsection 2.2.3 it was observed that the seated human is 10 times more sensitive to vibration at 5 Hz than at 100 Hz. Therefore, it could be proposed that measurements of vibration at 100 Hz are reduced by a factor of 10 when compared to measurements of vibration at 5 Hz, in order to maintain subjective sensation parity between the two measures. The concept can be extended such that there is a continuum of weighting factors across the frequency range of possible perception. Frequency weightings are thus applied to time-domain signals to modify them so that the weighted signal represents the human response to the vibration rather than the mechanical characteristics of the vibrating surface. Usually, the procedure applies mathematical digital signal processing techniques, the details of which are beyond the scope of this book (for further reading see Bendat and Piersol, 1986).
There are three limitations of using frequency weightings for whole-body vibration, although these limitations also apply for hand-transmitted vibration. First, frequency weightings are derived from meta-analyses of studies of equal sensation curves. They are therefore representative of a population rather than an individual. As a result, inter- and intra-individual differences cannot be reproduced by using weighting techniques. For example, a householder complaining about residential building vibration might have a very sensitive perception threshold such that he or she can feel the movement, whereas other individuals might not be able to perceive any vibration at all. In this example, vibration measurements might indicate that magnitudes should be below threshold. One is therefore faced with the challenge of whether to design for the population as a whole or
for the sensitive extremes in terms of perception (this is analogous to classic anthropometry problems).
A second limitation of human vibration frequency weightings is that they assume linearity, i.e., there is only one weighting that is used for both low- and highmagnitude environments. Howarth and Griffin (1988) show small changes in the shape of the equal-sensation curves at the extremes of their vibration magnitudes and that subjective sensation increased more rapidly than would be expected from Stevens’ Law for the lowest vibration magnitudes. Although these differences are slight when compared to interindividual variability, they are an indication of the nonlinearities in human response. Shoenberger (1972) proposes a series of curves for varying vibration magnitudes (analogous to “phon” curves in acoustics), but their use is not widespread.
A third limitation of frequency weightings is that they assume that techniques based on perception (or ratings of equal comfort) can be used for prediction of injury. This assumption is an important consideration because unlike other sensory systems (e.g., visual, auditory), the anatomical locations where injury might occur for whole-body vibration are not the same as the locations where physiological receptors are located. One must question the appropriateness of linking the psychophysiological response of the visual, vestibular, somatic, and auditory systems with the pathological response of spinal tissue.
Although there are problems with the use of frequency weightings, a key consideration is that there is, currently, no alternative method for the assessment of complex vibration with components at multiple frequencies that has proved to be better than the use of frequency weightings. For the time being at least, the principle of “if it feels unhealthy then it probably is unhealthy” should be maintained.
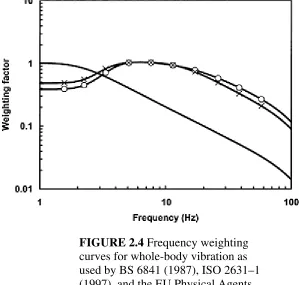
For whole-body vibration, the three most commonly used frequency weightings are known as Wb, Wk, and Wd (Figure 2.4). Wb and Wk are both used for vertical vibration
only and are each characterized by a peak at 5 Hz. Wk is about 25% higher than Wb
below 3 Hz and is lower than Wb at frequencies above 12 Hz. These differences are small
when compared to intersubject differences for vibration perception, on which the weightings are based. Wb is used by BS 6841 (1987); Wk is used by ISO 2631 (1997), the
EU Physical Agents Directive (2002), and the most recently introduced standards. For most environments, assessments made using Wk will generate higher values for the
weighted acceleration than using Wb (e.g., Lewis and Griffin, 1998; Paddan and Griffin,
2002a, b).
It is possible to encounter documents referring to ISO weightings from versions of ISO 2631 prior to 1997. These weightings were different from the current weightings and are often labeled ISO-x, ISO-y, and ISO-z. Other weightings include We (for rotational
vibration) and Wc (for vibration at the back of the seat). Such techniques are not limited
to human response to vibration; weightings have even been developed to assess the welfare of chickens during transportation (e.g., Randall et al., 1997).
FIGURE 2.4
Frequency weighting
curves for whole-body vibration as
used by BS 6841 (1987), ISO 2631–1
(1997), and the EU Physical Agents
(Vibration) Directive (2002). Vertical
vibration: W
b(-O-) and W
k(-x-);
horizontal vibration: W
d(—).
2.2.5VIBRATION PERCEPTION IN BUILDINGS
Buildings might move due to passing heavy transport, seismic activity, or exposure to strong winds. People might respond in a variety of ways, including distraction,
TABLE 2.1
Multiplying Factors Used to Specify Satisfactory
Magnitudes of Building Vibration with Respect
to Human Response
Source: From British Standards Institution
(1984). Evaluation of human exposure to vibration in buildings (1 Hz to 80 Hz). BS 6472. London: British Standards Institution.
fear, annoyance, sleep disturbance or, alternatively, precision activities might be compromised. Occupants are quick to complain of building vibration even if it is only just above perception thresholds. If the movement of the building is sufficient, then slight (or severe) structural damage might occur producing a psychological response beyond the scope of this chapter.
Two technically identical standards, ISO 6897 (1984) and BS 6611 (1985) provide guidance for assessing the motion of tall buildings or fixed offshore structures to low-frequency motion (0.063 to 1 Hz). The standards provide a “satisfactory” magnitude of motion for the peak 10 min of the worst windstorm with a return period of 5 years. For
building motion, satisfactory magnitudes are below 0.067 m/s2 r.m.s. at 0.1 Hz falling to
0.026 m/s2 r.m.s. at 1 Hz. These values do not consider other cues to the motion such as
visual or auditory.
For vibration between 1 and 80 Hz, ISO 2631–2 (1989) and BS 6472 (1984) apply. Their approach is identical but there are slight differences in detailed criteria. A“base curve” is specified that, above 4 Hz, is similar in shape to the “perception threshold” curve in BS 6841 (1987) but is lower between 1 and 4 Hz (i.e., implies a greater sensitivity). Satisfactory magnitudes of building vibration are specified as multipliers of the base curve, depending on the type of activity in the building and whether the vibration is continuous (more than 16 h/d), intermittent, or impulsive (stimuli <2 s). Multipliers for continuous vibration range from 1, for “critical working areas” such as some hospital operating theaters, to 128 for intermittent vibration in workshops (Table 2.1). A multiplier of 2 causes the curve in BS 6472 to replicate the perception threshold curve in BS 6841 above 4 Hz. Therefore, acceptable magnitudes of continuous vibration for nighttime residential and some other uses are below average perception thresholds.
2.3WHOLE-BODY VIBRATION COMFORT AND DISCOMFORT
Many dictionaries provide a definition of comfort aligned to “an absence of discomfort.” In the same dictionaries, discomfort can be defined as “an absence of comfort,” leaving us with a circular argument. Physiologically, humans have no comfort receptor despite having a battery of pain receptors (nociceptors). One could therefore define one criterion for comfort as “an absence of signals from nociceptors.” However, there is also a range of vibration magnitudes that might be considered uncomfortable but not painful. Perhaps the most appropriate definition of a comfortable stimulus is one where the subjects would not change their activity to reduce its magnitude.
The scope of this section is bound by vibration signals that are above perception thresholds but below magnitudes that might be considered hazardous to health. An important factor for comfort in vehicles is the design of the seat; this is treated separately in Section 2.5.
2.3.1NOISE, VlBRATION, AND HARSHNESS (NVH)
NVH as a discipline has grown in the automotive industry since the 1980s. It was spawned from an increasing demand from customers for improved vehicle refinement, ride, and quality. NVH engineers use a colorful terminology for noise and vibration including shuffle, idle shake, lugging roughness, and jiggle shake. An objective for NVH is not only to reduce levels of cabin noise and vibration but to tune them so that there is a feeling of smoothness within the car. Therefore, it provides the automotive industry with a crossover point for engineering, ergonomics, and psychology.
One aspiration for NVH engineering is the prediction of comfort levels in the production vehicle without the requirement for extensive prototyping. This has demanded the development of predictive models for perceived ride comfort in addition to the development of seat testing techniques (Section 2.5).
2.3.2VEHICLE COMFORT
In a “comfortable” vehicle, occupants tend not to actively consider the background vibration despite magnitudes being above perception thresholds. The vibration signals are thus filtered out by the brain. However, if the vehicle passes over a bump in the road, a combination of vibration, auditory, and possibly visual stimuli are perceived as an “event” that is noticed by the occupant. This “event hypothesis” is analogous to the cocktail party effect whereby unimportant sounds and speech are filtered out by cognitive processes.
The perceived discomfort increases as the intensity and number of events increases. Usually, background vibration contributes only a small proportion of the total discomfort if there are events in the vibration, but this depends on the number and nature of the events and the magnitude of the background vibration.
One might assume that changing a vehicle to decrease weighted vibration emissions would lead to an improved vehicle ride. Although this can be true, it depends on the limiting factor for the ride of the original vehicle. In agriculture, for example, tractors are often driven at a speed such that the drivers moderate their discomfort. They will drive at higher speeds on smoother surfaces so that the overall discomfort is maintained. This concept can be further developed by considering the development of fully suspended tractors in the early 1990s that could provide a significant reduction in vibration exposures if speeds were not increased (Scarlett and Stayner, 2001). However, many drivers use the tractors in such a way that speeds are increased, enabling tasks to be completed quicker but also resulting in little or no reduction in the vibration. Quicker completion of tasks should be welcomed as this will reduce the exposure time either of the individual or of the workforce as a whole, so long as the total vibration dose does not increase. This behavior can be termed discomfort homeostasis (analogous to risk homeostasis).
2.3.3ASSESSING VlBRATION COMFORT
Laboratory studies of whole-body vibration discomfort have established a relationship between the magnitude, duration, frequency content, and waveform of the signal. It is not surprising that a higher magnitude stimulus is more uncomfortable than a lower magnitude stimulus (e.g., Mansfield et al., 2000). For stimuli up to 2 min, longer-duration stimuli are more uncomfortable than shorter-duration stimuli (Griffin and Whitham, 1980; Kjellberg and Wikström, 1985). However, for longer durations, the discomfort increases less rapidly, if at all (Kjellberg and Wikström, 1985).
There are many laboratory investigations of the effect of frequency on comfort in the literature (e.g., Shoenberger and Harris, 1971; Miwa and Yonekawa, 1971; Howarth and Griffin, 1988). Many of these have used semantic rating scales, asking subjects to rate stimuli as, for example, slightly uncomfortable, uncomfortable, and very uncomfortable (e.g., Shoenberger, 1982; Huston et al., 2000). Others have used reference vibration stimuli for comparison to test stimuli (e.g., Griffin et al., 1982). These and other techniques have applied a wide range of psychophysical methods, postures, and shakers, but most show similar trends in their results. Vibration at about 5 Hz is generally reported as producing a greater sensation than lower or higher frequencies. This trend follows the
same pattern as that established for vibration perception threshold curves, thus validating the general shape of the frequency weighting curves.
A final factor for vibration comfort is the waveform of the signal. Shocks have been shown to cause more discomfort than other stimulus types of the same frequency-weighted r.m.s. vibration magnitude (Mansfield et al., 2000). This is one reason why assessment techniques that emphasize high acceleration events (such as the vibration dose value) perform better than r.m.s. for assessments of whole-body vibration comfort.
When considering vibration comfort, the interaction between magnitude, duration, frequency content, and stimulus waveform is not trivial and is further confounded by inter- and intra-subject differences and nonvibration factors. For example, the physical environment in a car cabin at 30°C will be considered “too hot,” and this response will dominate feelings of discomfort, irrespective of the subtleties of the vibration environment. Various authors have suggested a variety of techniques for assessing comfort using a range of frequency weightings, averaging (or peak detection) techniques, and time dependencies. Some laboratory studies (e.g., Mansfield et al., 2000; Ruffell and Griffin, 2001) and field studies (e.g., Wikström et al., 1991) have identified that dose measurements based on the fourth power of the frequency-weighted acceleration are superior, or at least not inferior, to using second power measures (i.e., r.m.s.) for the prediction of discomfort. Therefore, application of the vibration dose value (VDV) is recommended above r.m.s. or peak methods for assessment of vehicle comfort.
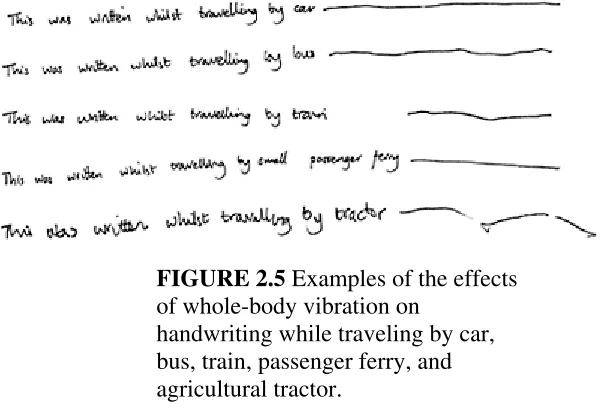
2.3.4ACTIVITY INTERFERENCE
The demands of a time-pressured culture in combination with advances in information and communications technology has led to an increase in the range of tasks performed while traveling. Reading, writing, and eating can be affected by wholebody vibration. The extent of the disturbance depends on the nature of the vibration (e.g., frequency, magnitude, direction, waveform; see Figure 2.5). The problem of writing has, to some extent, been eliminated by the developments in mobile computing allowing for use of word processors while traveling. Although one might also expect typing to be affected by vibration, there are no known studies investigating the extent of its effects. Increased functionality for mobile telephones means that small keys are now used not only for dialing but for accessing information and typing short messages, introducing a new arena of activity interference from wholebody vibration. It is impossible to accurately predict the longevity and development of such technologies, and so experimental laboratory data-based improvements in usability might not be achievable due to the insatiable appetite for new products (at least by the suppliers) driving rapid technological changes.
2.4HEALTH EFFECTS OF WHOLE-BODY VIBRATION
The most commonly reported health effect of whole-body vibration is back pain. Indeed, back pain is the focus for the rest of this section. Despite this, other types of health effects have been observed. These include sciatica, digestive disorders, genitourinary problems, and hearing damage (Griffin, 1990). Portuguese researchers have reported links between low frequency noise and whole-body vibration with a variety of disorders, collectively
termed vibroacoustic disease (e.g., Castelo Branco and Rodriguez, 1999; Castelo Branco, 1999). These include thickening of cardiac structures and neurological and vascular disorders. Despite the name of the condition, the greatest contributor to risk is considered to be large-pressure-amplitude (≥90 dB SPL), low-frequency (≤500 Hz) noise and not whole-body vibration as described in this book. One might argue that high-intensity, short-duration impacts that can cause trauma of the internal organs is a form of whole-body vibration. Such topics fall within the remit of crash research and are beyond the scope of mainstream whole-body vibration research. At the other extreme, low-intensity, long-duration vibration might cause annoyance leading to elevated blood pressure and other stressrelated symptoms.
FIGURE 2.5
Examples of the effects
of whole-body vibration on
handwriting while traveling by car,
bus, train, passenger ferry, and
agricultural tractor.
A problem with many of the symptoms previously described is that they might be caused by a variety of factors. Consider two journeys, one in a new luxury car and one in an old budget car. It is likely that the occupants will feel more fatigued after the drive in the old car. If the vibration magnitudes in the cars were measured, then it might also be observed that the exposure was greater in the old one. Does this mean that the fatigue was caused by the vibration? Perhaps it was. However, it might also have been caused by the design and condition of the seat, the quality of the posture, or one of a host of other differences between the cars. As issues of whole-body vibration and health are considered, it is important to remember that vibration is one of many risk factors that dictate the need for a holistic approach.
2.4.1EPIDEMIOLOGICAL STUDIES
The problem of linking a specific pathogen to a specific disease is not exclusive to whole-body vibration. Epidemiologists have developed techniques that are helpful in establishing links. Hill’s criteria (see Table 2.2; Bradford-Hill, 1966) provide a nine-part epidemiological framework for establishing a link. It is important to note that the only
essential criterion is the temporal relationship; all other criteria help to support the relationship, but none determine a link irrefutably. For considering links between whole-body vibration exposure and back pain, the first five criteria are the most useful (i.e., strength of association, consistency of association, plausibility of relationship, temporal relationship, biological gradient). The other criteria are sometimes difficult to test. It is, for example, unethical to attempt to deliberately
TABLE 2.2
Hill’s Criteria for Pathogen-Disease Causality
Criteria Example of Criteria
1. Strength of association
There is a strong link between the pathogen and the disease, with the risk of exhibiting symptoms substantially increased with exposure to the pathogen (e.g., supporting odds ratios)
2. Consistency of association
There is a consistent body of evidence with repeated studies linking the pathogen and disease
3. Plausibility of
relationship The association between the pathogen and disease is plausible, considering the biomechanics of the system 4. Temporal
relationship The disease occurs after exposure to the pathogen and not before
5. Biological
gradient An increase in the severity of the disease is observed with an increase in the exposure to the pathogen (e.g., a dose-response relationship)
6. Coherence The link between disease and pathogen is in agreement with the existing state of knowledge 7. Experimental
evidence
Initiation of the disease can be demonstrated through laboratory simulation or administration of the pathogen 8. Analogy There is knowledge of similar processes within the biological sciences
9. Specificity A unique link between the pathogen and the disease can be identified, i.e., a lack of other pathogens
cause injury through vibration exposure (as required for experimental evidence criteria). Similarly, other common pathogens are known for back pain (specificity criteria).
Epidemiological data for specific exposure types have been repeatedly reported since the 1950s. Griffin (1990) summarizes over 130 studies of whole-body vibration and health between 1949 and 1988. It is helpful, therefore, that epidemiological studies of whole-body vibration and health are reviewed periodically (Hulshof and van Zanten, 1987; Griffin, 1990; Kjellberg et al., 1994; Bovenzi and Hulshof, 1998; Lings and Lebouef Yde, 2000; Stayner, 2001). There is general agreement between these reviews that there is evidence for a link between vibration exposure and low back pain. Bovenzi and Hulshof (1998) state:
Occupational exposure to whole-body vibration is associated with an increased risk of low back pain, sciatic pain, and degenerative changes in the spinal system including lumbar inter-vertebral disc disorders.
The authors combined data from two previous studies that indicated that, for tractor drivers, an increased prevalence odds ratio was observed for increased vibration exposures, suggesting a link between back pain and vibration dose (Figure 2.6).
Mansfield and Marshall (2001) performed a questionnaire study to investigate the prevalence of musculoskeletal troubles experienced by rally drivers and codrivers (Figure 2.7). These data were compared with a meta-analysis of reported prevalence of troubles in those occupations traditionally associated with whole-body vibration exposure (e.g., forklift truck drivers, tractor drivers) and also with controls who were not employed in such jobs (e.g., car drivers, office workers). This study had the advantage of using subjects who were exposed to high magnitudes of vibration and mechanical shock but for short periods of time (i.e., rally drivers and co-drivers), rather than those exposed to low or moderate magnitudes of vibration but for extended periods of time (i.e., the two groups used for comparison). Furthermore, pain was specifically related to the rally vibration exposure. A clear increase in prevalence of pain was shown for the rally participants when compared to the other two groups (Figure 2.8).
In the U.K., it is estimated that 9 million workers are exposed to whole-body vibration each week (Palmer et al., 1999). Of these, 383,000 are estimated to be exposed to magnitudes of vibration that exceed the 15-VDV guidance level from BS 6841 (1987). Occupations with the most people exposed at this level are farming, drivers of road goods vehicles, and forklift and industrial truck drivers.
Most of the epidemiological studies reported in this section have used questionnaire-based evidence to identify back trouble. However, if injury occurs, then tissue damage would be expected, thus resulting in a pathological change.
FIGURE 2.6
Prevalence odds ratio for
low back pain among tractor drivers as
a function of lifetime cumulative
whole-body vibration (WBV) dose
estimated as
∑
a
i2t
i,
where
a
iis the root
sum of squares of the
frequency-weighted r.m.s. acceleration of tractor
i
and
t
iis the number of full-time
working years of driver on tractor
i
(year m
2/s
4). Data from Boshuizen et
al. 1990 (-O-) and Bovenzi and Betta
(1994) (-x-). [Adapted from Bovenzi,
M. and Hulshof, C.T.J. (1998). An
updated review of epidemiologic
studies on the relationship between
exposure to whole-body vibration and
low back pain.
Journal of Soundand
Vibration,
215(4), 595–612.]
FIGURE 2.7
Prevalence of pain,
aching, or discomfort following
rallying for 90 drivers and co-drivers.
[Adapted from Mansfield, N.J. and
Marshall, J.M. (2001). Symptoms of
musculoskeletal disorders in stage rally
drivers and co-drivers.
British Journal
of Sports Medicine,
35, 314–320.]
2.4.2PATHOLOGICAL STUDIES
Despite back pain being reported across a variety of occupations with vibration exposure, it has proved difficult to diagnose any specific disorders of those employed
FIGURE 2.8
Percentage prevalence of
low back pain for rally participants,
those exposed to industrial whole-body
vibration, and those not exposed to
whole-body vibration (data from
Mansfield and Marshall, 2001).
in such industries, or even for those reporting pain. Drerup et al. (1999) used a cohort of 20 heavy earthmoving machine operators who had clinically verified back complaints and had applied for early retirement. All operators had more than 15 years’ exposure of whole-body vibration. The authors applied a battery of tests (e.g., stadiometry, MRI imaging, CT scans) in an attempt to find pathological changes to the spine. No significant differences were observed between the cohort with longterm vibration exposure and a group of nonexposed controls. Indeed, the authors concluded that there was:
No evidence that lumbar discs of subjects exposed to long-term whole-body vibration differ on average from those of nonexposed subjects.
Similarly, Videman et al. (2000) used MRI imaging to investigate the spinal pathologies of 18 rally drivers, of which 89% reported low back pain. As per Drerup et al.’s study, no differences were observed between the rally drivers and controls:
…Even extreme vehicular vibration as associated with rally driving does not appear to have significant effects on disc degeneration…
A key factor with these two studies is that virtually all of the participants reported back pain. Therefore, from an individual level, the problem of pain exists, despite the current lack of technology to identify the specific pathology that causes the pain.
2.4.3PROTECTION
The previous sections have highlighted the association between whole-body vibration and risk of musculoskeletal troubles. Occupational health good practice dictates that agents inducing a risk should be reduced. For vibration protection, there are only two strategies available: either to reduce the duration of the exposure or to reduce the magnitude of the exposure. Changing working practices entirely such that machines are remote controlled and operator vibration is eliminated is perhaps the ideal (but rarely feasible) solution, so long as other ergonomic risk factors are not increased as a result.
The first method of protection should be to implement engineering solutions to the problem. To reduce vibration at source, it is important to understand where the major contributor to the vibration originates.
For some environments (e.g., forklift trucks) a major contributor to the vibration is the roughness, or tidiness, of the floor or road. In these situations, maintenance of floors and keeping debris from the vehicle routes would improve the mechanical (vibration) environment for the vehicle. There might also be other spinoff benefits such as elimination of trip hazards for pedestrians. Some areas of a workplace could be prohibited for certain machines, either to preserve quality floors or to avoid rough ones. For many vehicles, a lower vibration dose is received by the operator if the speed of the vehicle is limited.
Occasionally, the engine of the vehicle can be the main contributor to the vibration exposure. Considering that the body is most sensitive to whole-body vibration at frequencies less than 20 Hz, it is best for single-cylinder engines to run at speeds greater than 1000 rpm. The more cylinders that exist in the engine, the higher the dominant frequencies of vibration. Therefore, it is often better to use multicylinder engines. Engines should be mounted on resilient mountings to isolate the engine vibration from the chassis of the vehicle and for engines to be balanced, where possible.
Tools used by the machine can be a source of vibration. Sometimes vibration is an essential part of the process (e.g., ride-on rail grinders, hydraulic breaker attachments, driving or piling machines, tamping machines). In these cases the frequency of vibration should be selected to be effective for the task but out of the sensitive range of the operator. Other tools (e.g., backhoe loader excavators) are hydraulically driven and the mechanisms should be designed such that a smooth operation is achieved. The recent move from direct linkage to servo control for some types of machine provides opportunities for development of idealized mechanisms for vibration reduction. Finally, the correct tool should be used for the task (e.g., excavator buckets should not be used for piling).
If the source of the vibration cannot be adequately eliminated, then the transmission of vibration to the operator should be minimized. This can be achieved by isolation of the source (e.g., axle suspension, engine mounting, tool isolation) or isolation of the operator (e.g., suspended cabs, suspension seats).
If exposures cannot be reduced by engineering means, then reducing the number of operations per exposed person might be the only option for reducing vibration exposure dose. This could be achieved by reducing demands on the operator, allowing for a slower completion rate, or by job (or task) rotation. Job rotation is not always effective at reducing risk. For example, some machines might expose the operator to most vibration while traveling from a store to a work site (e.g., a road roller) and so increasing the number of such journeys, albeit with different operators, might not be an effective means of reducing vibration exposure.
Through innovation it is possible to reduce vibration exposure while improving performance (e.g., agricultural machines with suspended axles). Vehicle manufacturers and component suppliers are often aware of critical parts of their designs that could improve the vibration efficiency, at a cost. If customers along the supply chain consider vibration performance as a purchasing criterion, then, to maintain a competitive advantage, manufacturers may improve the technologies employed for vibration isolation. As a result, operators should be exposed to lower magnitudes of wholebody vibration.
2.4.4THE “HOLISTIC” APPROACH
The cause of an individual’s back pain is often elusive. Most researchers agree that vibration is a risk factor for back pain, but there are other factors that are important. When making an assessment of an environment, it is therefore essential that the entire task be considered. Other risk factors like poor posture, prolonged sitting, heavy lifting, and working in the cold are often associated with environments where whole-body vibration is also present. It is not uncommon to observe drivers jumping down from cabs of trucks or agricultural machines; this action might be more of a risk factor than the exposure to the vibration. Consider helicopter pilots as an example; there are few researchers who disassociate the occupation with back pain, but if vibration were the only cause of pain, then one would expect similar prevalence of pain for pilots and copilots. Bridger et al. (2002a,b) report a significantly lower prevalence of back pain for copilots (24%) than for the pilots (up to 72%, depending on the task) and conclude that the poor posture of the pilot is likely to be another important risk factor for the cause of the pain. Similarly, Magnusson and Pope (1998) comment that vibration is only one of many pathogens and recommend that core ergonomic factors be considered with any vibration assessment.
Stayner (2001) highlights that although it is possible to associate back pain with an occupation, it is far more difficult to identify which aspect of the occupation is the cause of the pain. He makes the observation that:
It is a common feature of many of the research reports and reviews that they refer to occupational groups as “exposed” groups, using “WBV exposure” as a synonym for working on a machine, and thereby implying that they are concerned only with vibration exposure. …This seemingly innocuous mistake carries with it the assumption that the researchers are not trying to discover the cause of the disease or effect, but that they have already decided what it is and are intent only on finding evidence in