VIBRATION ANALYSIS OF GEARMESH IN EVERY
CONDITION USING THE VIBRATION SIGNAL
PUBLICATION PAPER
To fulfill partial of requirement
to achieve undergraduate level in mechanical engineering.
Arranged by :
Fani Nur Fadhila Ichsan
NIM : D 200 102 014
MECHANICAL ENGINEERING PROGRAM STUDY
ENGINEERING FACULTY
MUHAMMADIYAH UNIVERSITY OF SURAKARTA
VIBRATION ANALYSIS OF GEARMESH IN EVERY CONDITION USING THE
VIBRATION SIGNAL
Fani Nur Fadhila Ichsan
Automotive/Motorcycle Engineering Department Muhammadiyah University of Surakarta
Jl. Ahmad Yani Tromol Pos 1 Pabelan Kartasura 57102 Email: [email protected]
ABSTRACT
The purpose of the research is to detect the defect of the gear on the gearbox using
vibration signal analysis. The experiment was done on four condition of gear. Gear ru in good
condition, a half broken tooth, one broken tooth, and cracked. The gear rotational speed were
taken in 300 rpm, 750 rpm, and 2250 rpm. Vibration data accuisition was done using
vibrationmeter and PC. Vibrationmeter record the signal on time domain and convert it to
frequency domain. Defect analysis was done in the time domain and frequency domain.
Experiment result showed that time domain, defect of gear culd detected by spike
appearing every one period of shaft revolution. This case was indication of gear having broken
one broken tooth. Then, on two broken teeths, amplitude of spike period was smaller than one
brken tooth condition. Whereas on a half broken tooth conditionm gailure was difficult to detect
at time domain. At frequency domain, indication of a half broken tooth was seen by increasing
amplitude of gearmesh frequency four time to 39,57 volt and sideband appearing. Then on one
broken tooth indication could be seen by increasing amplitude of gearmesh frequency ten times
to 123,5 volt and sideband appearing. On cracked gear, indication could be seen by increasing
amplitude of gearmesh frequency fourtime to 123,5 volt and appearing many sidebands.
Everysideband have a distance a shaft revolution frequency. Sideband appearing and increasing
amplitude of gearmesh can be detected as failure of gearbox.
Background
Nowadays, almost all machines are made to work automatically. In general, these machines work on high rotation, where the rotation causes a vibration with a frequency high enough so that it can no longer perceived by the human senses. Conventional methods cannot be used efficiently because it requires a long time and high cost. Therefore we need an efficient method of monitoring and can detect damage with a high degree of accuracy that with predictive maintenance methods. Predictive maintenance is regular monitoring of the condition actual mechanics, by detecting recent problems to prevent further damage.
Predictive maintenance based on vibration signal analysis applied to various engine components one of them is a gearbox. The problem of monitoring the condition of the gearbox has got increased interest in the last two decades with the aim to improve safety and reduce the cost of operation of the machine (Shao et al, 2009).
Based on this background, it is necessary to research in improving predictive maintenance techniques on gear damage detection using vibration signal.
Problem Limitation
To determine the direction of the research, it is given limitations as follows:
a. It is assumed the damage occurs only in the gear, the other component is considered in good condition.
b. The gears which damaged are the gear drive and there are only 4 kind of damage.
c. This test use electrical motor as the engine to rotate the shaft in gear as the engine components by analyzing the characteristics of the vibration signal in the form of time domain and frequency domain, which is generated by the gear with different damage types.
Literature Review
Techniques that used are the time domain analysis, frequency domain analysis, order analysis, syncrous time signal averaging, waveform analisys and fuzzy neural network. The usefulness of these techniques are time and frequency domain can be used to eliminate noise from the broken gears but not suitable for use on gears that have a lot of damage. Time syncrous signal averaging is suitable for detecting and diagnosing damage to shafts and gears, the fuzzy neural network is used to categorize the damage and the condition of the gear with the main signal extracted from the vibration signal, waveform analisys is suitable to detecting damage that amounted a lot of gear, but not suitable to classify type of damage.
Ebrahimi (2012) examines the damage on straight gears. The method used is comparing signals with analysis the time domain and frequency domain of gears. The results of the study are the differences in the time domain and frequency domain, between good condition and defect condition. In the form of time domain, defective condition is characterized by spikes in each round of its axis. In the frequency domain, defective condition is characterized by the increase of amplitude on gear mesh.
Jayaswal et al (2013), in his research investigates the vibration signal on the gear arrangement. The purpose of this study was to detect the gears damage, especially because fatigue damage. The method used is analyzing the peak value of the vibration from the good and tired defect gears per unit time. By these methods can be detected the broken gear has a higher peak value.
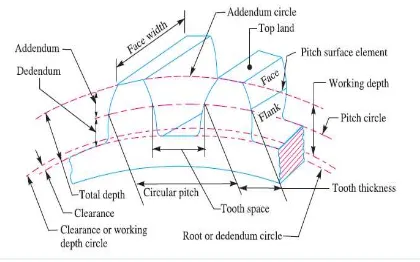
Parts of Gear
Figure 1 Terms on gear.
Source: Khurmi (2005) diameter from the pitch circle
3. Circular pitch is the spacing from space) between the boundaries when two teeth contact.
6. Working depth is the distance of the roots of the toes with the gear pitch circle radius. caused by the influx of foreign dirt particles into gear when rotate. Therefore, those particles are abrasive scrape the surface of the gear, another cause of this defect is
accompanied by a heavy load conditions at low speed, causing a thin line. Wear defects can be seen at figure 2a
b. Plastic flow
Plastic flow is defects caused if gears rotate with heavy loads. These defects usually occur due to the different material properties of the two gears are gears with soft materials and gears with a harder material. Surface profile gear will experience plastic deformation if vibration is too big and lubricants can also cause these defects. Plastic flow defects can be seen at Figure 2b.
c. Pitting
Pitting is fatigue damage to teeth which occurs early after the exchange of the load. These defects occur because of wells corrosion. When crater forming occurs this formed rolling tongues in the opposite direction, thus forming pores or gray spots. Pitting defects can be seen at figure 2c. d. Spalling
of the excessive force. Spalling defect can be seen at figure 2d.
e. Burning
Burning defect or burnt is defects caused by the reduction of hardness characteristic of the gear. This occurs because of the temperature rises too high. Factors that affect the temperature rise include lubricants, rotary speed too high and excessive loads. This defect is seen when gears surface etched. Burning defect can be seen at Figure 2e.
Figure 2 Defects on gear surface (a). Wear,
(b). Plastic flow,
(c) Pitting, (d) Spalling, (e)Burning. Source: Higgins (2002) 2. Gear Damage
a. Fatigue damage
Fatigue damaged is gear damage caused by repetitive bending stress above the endurance limit of the gear material, thereby reducing the toughness of the material. These repetitive voltages are because of overload, design faults, and others. This defect visible when viewed from an electron microscope would look like a coastline. Fatigue damaged defect can be seen at figure 3a.
b. Quenching crack
Quenching crack is damage caused by the excess stress because of heat treatment. These stress initiate fatigue fracture. Large cracks will cause the same defects with overload breakage after lasting for a few cycles (in relative terms). Quenching crack defect can be seen at figure 3b.
c. Overload breakage
Figure 3 Defects of gear damage. (a)
Fatigue Damage, (b) Quenching crack, (c) Overload breakage. Source: Higgins (2002) Vibration
Vibration is the periodic motion or motion that repeated itself after a certain time interval. The time interval is called a period. Condition of the engine and mechanical problems can be determined by studying the vibration characteristics. In a spring-mass system, the vibration characteristics can be studied by plotting the mass movement against time
Mass motion from the neutral position toward the upper limit and then back to the neutral position (equilibrium) and move again to the lower limit and then back to the equilibrium position, showing a cycle movement. Time to do the motion of the cycle is called a period, while the number of cycles that resulted in a certain
time interval is called frequency. In the analysis of machine vibration, frequency is more useful because it relates to rpm (rotation) of a machine.
Time Domain
Time domain data are expressed as the profile data charts / plots amplitude against time. A change of the deviation of a vibration with time can be observed in detail with time domain graphs. Amplitude signal is proportional to the unbalanced mass and the cycle repeats as the rounds. This signal is very simple and easily analyzed. Time domain vibration provides a description of the physical phenomena.
Figure 2 Example of vibration signal graph
in time domain. Source: Mobley (2002)
Frequency domain based on the principle that all signals (not the ideal signal) can be generated by summation of sine waves. This principle was formulated by J.B. Fourier century ago. Instead described above can signal any of its
Time (sec) Amplitude
components in the form of a sine wave, it is important to note that fully represents the frequency spectrum of vibration signal. No information is lost due to the conversion of the the time domain to the frequency domain, when the difference phase between the components is also included.
Frequency Domain
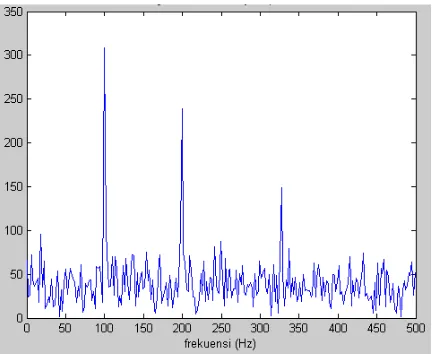
Frequency domain is expressed as a profile data graphs / plots amplitude against frequency. In practice there is no existence of vibration signals directly in the frequency domain. Vibration signal always occurs in the time domain, but for purposes of analysis, the vibration signal in time domain can be converted into the frequency domain.
Figure 3 Example of frequency domain
vibration signal graph. signal any of its components in the form of a sine wave, it is important to note that fully represents the frequency spectrum of vibration signal. No information is lost due to the conversion from the time domain to the frequency domain, when the phase difference between the components is also included.
Fourier Transform
Transition from periodic to non periodic function can be effected by allowing the period approaching infinite. In other words, once T becomes infinite, its function is never repeated so, become periodic. If this is allowed to happen, then it can be demonstrated that tapers into a
Known as Fourier transformation. Both pair of equations is teach about transformation back and forth between the time domain and frequency domain without periodic signal. Fourier series can be applied to a periodic waveform, while the Fourier transformation can be applied to a random waveform.
To change the time domain to the frequency domain is used Direct Fourier transformation, and to turn back to the time domain is used Inverse Fourier equal to the number of teeth times the speed of rotation. This frequency will always appear in the vibration spectrum, both for the good and the gear that is damaged.
2) Sideband
Frequencies generated by the arising of a backlash gearbox, eccentricity, loading, and the pulses generated by the defect.
Sideband can often indicate damaged of gears. Where if n the number of teeth and N
is the rotational speed (Hz) it will appear on the vibration spectrum sideband (n-1) N and
(n +1) N, as well as the spectrum shaft, natural frequency, and the frequency of gear mesh.
3) Backlash
Research Method
Details of the equipment used in this research:
a. Gearbox vibration test equipment (with 3 phase electric motor of 5.5 HP).
b. Normal gears, half broken tooth gear, one broken tooth gear, cracked gear.
c. Magnetic dial indicator. d. Vibration meter.
e. Tachometer. f. 3 phase inverter. g. Lubricant SAE 140.
Figure 3 Gearbox vibration test equipment.
Figure 4 Good gear (normal gear).
Figure 5 Half broken tooth gear.
Figure 6 One broken tooth gear.
Research Flowchart
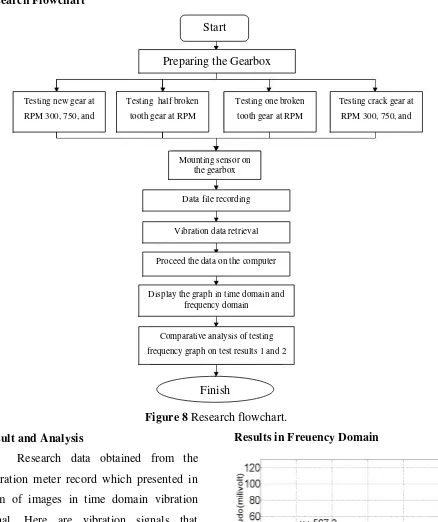
Figure 8 Research flowchart.
Result and Analysis
Research data obtained from the Vibration meter record which presented in form of images in time domain vibration signal. Here are vibration signals that recorded by the Vibration meter in various rounds and direction sensors. The results of vibration signals are in form time domain and frequency domain.
Results in Freuency Domain Start
Preparing the Gearbox
Testing new gear at RPM 300, 750, and
2250
Testing one broken tooth gear at RPM 300, 750, and 2250
Testing crack gear at RPM 300, 750, and
2250 Mounting sensor on
the gearbox
Proceed the data on the computer Vibration data retrieval
Data file recording
Display the graph in time domain and frequency domain
Comparative analysis of testing frequency graph on test results 1 and 2
Finish Testing half broken
tooth gear at RPM 300, 750, and 2250
Figure 9 Gear frequency signals in rounds
750 RPM with (a) Good condition, (b) Half tooth broken, (c) One tooth broken, (d)
Crack. Gearmesh Analysis
In figure 9 (a), the gear mesh frequency is detected around 567 Hz with an amplitude of 18.4 mVolt gear mesh worth. At a frequency of two times gear mesh more
dominant than the amplitude value of its one-time gear mesh. Gear meshes appear to be low because of the condition of the gears with no load. If the value of its gear mesh twice higher than of its one-time gear mesh, so indicated the gear under normal circumstances.
Based on figure 9 (b), on the condition of half broken tooth, gear mesh amplitude value increased by 39.57 mVolt and twice value of its gear mesh down. This is due to the collision of the broken tooth.
In figure 9 (c), when the condition one broken tooth, gear mesh amplitude value increase. Gear mesh value detected at a frequency of about 531 Hz with an amplitude value 123.5 mVolt. The increase in the amplitude is due to the greater collision. The greater impact on the gear will make the value of the gear mesh amplitude higher. Gear mesh frequency value becomes smaller due to the reduced number of teeth.
The phenomenon of the gear that cracks is just the opposite. Decreased amplitude occurs. In Figure 9 (d), the condition of gear crack indicates that the value of gear mesh down on value of 40.2 mVolt. Value of the gear mesh shifting compared to with one broken tooth condition (c). Impairment of vibration is due to the shape of the crack so that the (b)
(c)
collisions that occur lower than one broken condition.
Sideband Analysis
a. Sideband analysis
Gear damages cause conflict in every one rotation. It causes the modulation of each unit of time. The modulation causes sidebands in the frequency domain. Magnification on gear mesh performed to detect frequency sideband occurs.
( a )
( b )
( c )
Figure 10 Magnification of gears frequency
signal at rotational speed 750RPM. a). good, (b). Half tooth broken, (c). One
tooth broken.
At figure 10 (a), magnification of frequency signal of half tooth broken gear shows sideband appearance beside gear mesh. Two high sideband frequencies contained in 544.6 Hz and 566.9 Hz. The distance of the second sideband is 12.3 Hz, the amount is almost equal to the frequency of driver shaft gears. This is because the defective gear drives. The defect arises because the greater backlash on the gears. Hence, the frequency of modulation amplitude equal to the value of the input shaft.
than at half tooth broken gear. This is caused by the collision values which greater from the tooth. Based on the picture 4.14 (b), sideband seen at frequency of 496.5 Hz and 507.4 Hz. Sideband distance value nearly equal to the value of the input shaft rotation.
Based on the figure 10 (c), on a crack gear frequency signal indicating the number of sideband. Sidebands happen with higher numbers than other damage. Sideband can indicate damage to the gears. The emergence of many sidebands can be an indication of further damage. Sideband distance value nearing 12.5 Hz and this is the input shaft frequency.
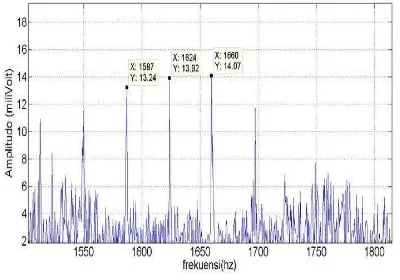
Figure 11 Magnification of crack gears
frequency signal at rotational speed 2250RPM.
Based on the figure 11 shows the value of the gear mesh at a frequency of 1660 hertz. At that point is followed by the appearance of sideband. The sideband arises because the defect position on the driving gear. The sideband intervals are between
1624 and 1587 hertz. The distance is almost the same as the rotation axis at 37 hertz. Discussion
In the time domain analysis, half tooth broken gear condition and normal condition are difficult to detect. This is because the gears still interlocked in the handicap conditions. However, one tooth broken gear and cracked gear can be seconds. 0.2 seconds is the time to reach one round shaft. While at 750 rpm surge occurs every 0.08 seconds. The amplitude spike exceeds 0.75 volts. 0.08 seconds is the time it happens to reach one round. Spike when the collision occurred because of defective gears intersect with good gear. At a speed of 2250 rpm is difficult to detect the damage because of other components involved vibrate.
analysis is not commonly used for shaft speed below 600 rpm (Mobley, 2002).
At 750 rpm shaft speed, gearmesh value seen at low amplitudes and the gearmesh frequency covered by noise. This is because the gears work with no-load condition. On the condition of half tooth broken gear, the gearmesh surge happen and followed by sideband. At one tooth broken condition, there was a higher surge in gearmesh frequency. The surge is due to the greater collision. Besides of the surge phenomenon, it is also occurs gearmesh frequency shift. Such shifts occur due to loss of teeth, so the gearmesh value shifted toward the left.
Sideband phenomenon appears in the frequency domain of damaged gears. The distance between sideband is almost the same as the spacing distance of shaft round. This proficiency level is as an indication of defects in the gear drive. In cracked gear, gearmesh values fell as the collision is reduced. In cracked gear condition, sideband appears more than at one tooth broken condition with a lower amplitude. It happened because the greater the backlash, the more emerging sideband.
At 2250 rpm speed variations, it is difficult to detect the damage using
frequency domain. The difficulty is due to the high speed drive other components. Conclusion
From the data analysis and discussion, it can be concluded as follows:
Gear defects in the frequency domain can be detected by the sideband appearance and the high of gear mesh amplitude. Gear mesh amplitude values at one broken tooth are higher than at other defects due to the greater impact. The greater the collision that occurred on the tooth defect, the greater value of the amplitude at the time domain and gear mesh amplitude. The larger size of backlash at defect gear, so sideband at the good recording, therefore the use of better tools are very helpful in the setting of the gear meshing and gear meshing alignment. 2. Research needs to be developed
References
Aherwar, A., dan Khalid, S., 2012, “Vibration Analysis Techniques For Gearbox Diagnostic: a review ”, International Journal of Advanced Engineering Technology
Aji, K., 2007, Deteksi Kerusakan Bantalan gelinding pada pompa sentrifugal dengan anaisa sinyal getaran, Jurusan Teknik Mesin, Universitas Sebelas Maret
Barjic, R., Sprecic, D., Zuber, N., 2011 Review of vibration signal processing techniques towards gear pairs damage identification. International Journal of Engineering & Technology IJET-IJENS Vol: 11 N0:4
Carwford, A., dan Crawford, S., 1992 The Simplified of Handbook vibration Analysis, Dept of physics, Kenyon College, Gambier, Ohio, Canada.
Ebrahimi, E., 2012, Fault Diagnosis of spur gear using vibration analysis, JURNAL OF AMERICAN SCIENCE 2012
Higgins dan Lindley R., 2002, Maintenance Engineering Handbook, McGraw-Hill, Amerika Serikat
Jayaswal, P., Arya, S., Gupta, N., 2013 ”Fault Analysis in Gearbox Using Vibration Technique”,
International Journal of Emerging Trends inEngineering and Development Issue 3, Vol 1 (January 2013),
Jonathan, Bob, How does an Accelerometer Work ?, http://ezinearticles.com/ ?expert=Bob_Jonathan (2013, August, 7th)
Kreyszig, E., dan Sumantri, B., 1993, Matematika Teknik Lanjutan, Penerbit PT Gramedia Pustaka Utama, Jakarta
Hidahat.R.L.G., 2009, Perawatan Prediktif Penerapan Getaran Mekanis, Lembaga Penerbit Penerbitan dan Percetakan UNS, Surakarta
Kurmi, R.S., dan Gupta, J.K., 2005 A text book of Machine Design, Eurasia Publishing house (pvt.) ltd, Ram Nagar, New delhi
Martin, G.H., dan Setyobakti, 1994, Dinamika Permesinan, Erlangga, Jl. H. Baping Raya no. 100, Ciracas Jakarta 13740


