1 This paper was presented in 97th Annual International Conference of the American Society for Horticultural Sciences. Lake Buena Vista, Florida, USA 23-26 July 2000.
2 Department of Agronomy, Faculty of Agricultur, Bogor Agricultural University, Jl. Meranti, Kampus IPB Darmaga, Bogor 16680 Telp./Fax. (0251) 629353 (*Author for correspondence)
3 Horticultural Sciences Department, University of Florida, Gainesville, FL,USA 32611-0690
Sulfur Source, Rate, and Methods of Application for Polyethylene-mulched Tomato1
Anas D. Susila2* and Salvadore J. Locascio3 Received 18 October 2004/Accepted 30 March 2005
ABSTRACT
Tomato (Lycopersicon esculentum L.) was grown with polyethylene mulch and drip irrigation on a Millhopper fine sandy soil testing very high in P and low in organic matter during two seasons to evaluate the effect of S source, rate, and application methods on plant growth and yield of fruit. Sulfur rate of 34 and 68 kg S.ha-1 were applied with preplant (broadcast in the bed), drip (10 weekly drip application), and by split applications (50% preplant and 50% drip). In split applications, S sources evaluated were ammonium sulfate and ammonium thiosulfate. Plant height was increased with S application from 0 to 68 kg S.ha-1 in both studies. However, response on plant dry weight only occurred in spring 1999. Total marketable yield was 17.9 tons.ha-1 with 0 kg S.ha-1 and was increased linearly to 48.1 tons.ha-1 with application of 68 kg S.ha-1 in Spring 1999, but no response to S was obtained in the Spring 1998 study. Measured variables were not affected by S source and methods of application. Increasing S application from 0 to 68 kg S.ha-1 reduced leaf and plant tissue P concentration 14 and 12% at mid season, 26 and 25% at late season sampling times, respectively. S application of 68 kg S.ha-1 reduced soil pH approximately 0.3 unit at the end of the season in both studies.
Key words: drip irrigation, sulfur, fertigation, Lycopersicon esculentum
INTRODUCTION
The sandy soil of northern and central Florida is low in available sulfur. Extractable SO4-S was less than 6 mg.kg-1 and considers very low throughout the profile of Florida Spodosol (Mitchell and Blue, 1981). Lack of S in many fertilizer material used on crop under intensive production system may cause plant nutrient imbalance that reduce yield. Early researchers demonstrated that crop such as white clover (Monteiro and Blue, 1990; Blue and Malik, 1986), sorghum-sudangrass (Mitchell and Blue, 1981) and corn (Blue et al., 1981) growing in Florida sandy soil would respond to S application. Response of tomato growth to S application also reported in the greenhouse study by Susila and Locascio (1999).
Fresh market tomato is the most valuable vegetable grown in Florida. During 1998-1999, the crop was grown on 17,577 ha with value of $461 millions or share 29.2% of the total vegetable production value in Florida (Witzig and Pugh, 2000). Tomato is vegetable most widely grown with drip irrigation. Total fruit yield, marketable fruit, and average fruit weight of tomato were higher with drip irrigation than with sub irrigation (Scholberg and Locascio, 1999) Extensive studies have been conducted with drip irrigation to determine the fertilizer
require-ment of polyethylene-mulched tomato. Yield of tomato were greater with ~ 60 % trickle applied N+K than with preplant applied N+K (Locascio et al., 1989). Locascio
et al. (1997) also showed that on a sandy soil, tomato yield were lowest with 100% N+K applied preplant, intermediate with 100% applied by fertigation, and highest with 40% applied preplant with 60% applied by fertigation.
In coarse-textured, sandy soil, very little sulfate adsorption take place. Mineralized sulfate or sulfate applied in fertilizer may be readily lost by leaching under high rainfall condition which exist during most of the growing season in Florida. Although intensive studies have been conducted on N, K nutrition, however, less attention has been paid to S nutrition in polyethylene-mulched tomato with drip irrigation. Studies reported here were conducted to evaluate the effect of S-source, rate, and methods of application on growth, yield and nutrient concentration of polyethy-lene-mulched tomato.
MATERIALS AND METHODS
Pre fertilizer soil samples were taken with a soil probe from the top 15 cm of an Arredondo fine sand (loamy, siliceous, Hyperthermic, Grossarenic Paleudults). Soil was dried, sieved, and analyzed for P (very high), K (very low) in Spring 1998, and P (very high), K (medium) in Spring 1999 with Melich-I procedures (Hanlon et al., 1994). Low organic matters content were determined in both seasons. Fertilizer was applied at 197-0-209-34 (Spring 1998), and 197-0-93-34 (Spring 1999) kg N-P-K-micronutrient mix..ha-1 from ammonium nitrate, potassium chloride, and FN 503 (Frit Industries, Ozark, Ala.). All the micronutrient and 40% of N and K applied preplant, and 60% of N and K were fertigated.
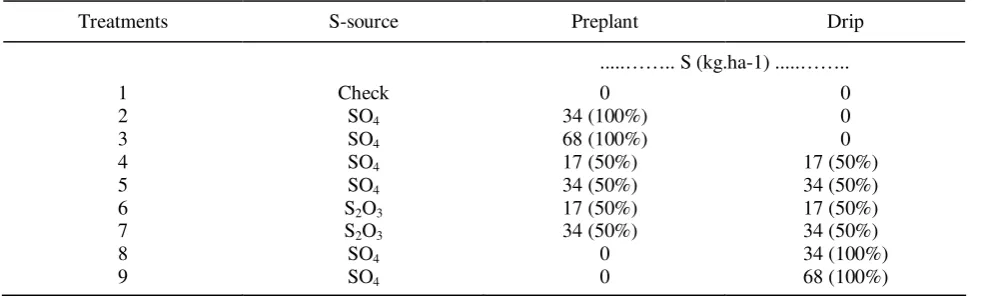
Treatments were combination of S rate (34 and 68 kg S.ha-1), method of applications (preplant, drip, and split), and source (ammonium sulfate and ammonium thiosulfate). Preplant applications were applied of fertilizer broadcast and rototilled into raised bed approximately 0.9 m wide and 20 cm high. Drip applications were applied 10 times weekly, and split applications were 50% preplant and 50% drip. In split applications S source were evaluated. Eight treatment combinations and check (0 S) were arranged in randomized complete block design with five replications. Treatment applications are presented in Table 1.
Beds were fumigated with methyl bromide (MB 92-2) at 448 kg on 4 Mar.1998 and 1999. Biwall drip irrigation tubing (orifice diameter, 0.025 cm; emitter spacing, 30 cm; rate of 1.89 liter per 30.5 meter per minute) was placed on the soil surface at 10 cm from the bed center and covered with black polyethylene mulch (Sonoco with 0.0038 cm thickness). 'Agriset 761 ' tomatoes were transplanted in the bed center on 25 Mar. 1998 and 24 Mar. 1999. Plants were spaced 0.45
m within row and staked. The volume of irrigation water applied daily at 60% of the mean daily volume of E pan for previous 10 days.
Recently matured tomato leaves and soils were sampled on 5, 21 May, 2 Jun. 1998, and 5, 21 May, 30 June 1999. Above ground portion of two plants per plot were taken on 21 Apr., 5, 21 May 1998 and 1999. Tissue was dried in forced-air drier at 70o C and ground to particle with diameter of < 0.6 mm. Total N was determined by Total Kjeldhal methods using 100 mg sample digested in H2SO4 and analyzed by Rapid Flow Colorimetry (Hanlon et al., 1994). P, K, Ca and Mg content were determined by dry-ash procedure using 500 mg sample dried in 500o C for 10 hours, diluted in 1N HCl, and analyzed by ICPS (Inductively Couple Plasm Spectrophotometer).
Total plant and leaf S content was determined on digested tissue by turbidimetry procedure slightly modified from Jones (1995). Plant tissue of 500 mg was digested using Mg(NO3)2 solution on hot plate followed heating in muffle furnace at 500o C for 4 hours. Sulfate reagent powder (SulfaVer®4 from HACH Co.) was used in the turbidimetry process. Sample was determined by using spectro-photometer (Spectronic-20D).
Tomato was harvested at the mature green or riper stage and graded into extra large (> 73 mm in diameter), large (64 to 73 mm), and medium (58 to 64 mm) sizes of marketable fruit (USDA, 1976). Analysis of variance of data was calculated using SAS 6.12 (SAS Institute, N.C). Orthogonal contrast were used to compare S-methods of application (preplant Vs split, preplant Vs drip, and split Vs drip), and S -source (sulfate Vs thiosulfate). Polynomial regression was used to analyzed S-rate effect (linear or quadratic).
Table 1. Treatment application in spring 1998 and 1999 study.
Treatments S-source Preplant Drip
...…….. S (kg.ha-1) ...……..
RESULTS AND DISCUSSION Plant growth
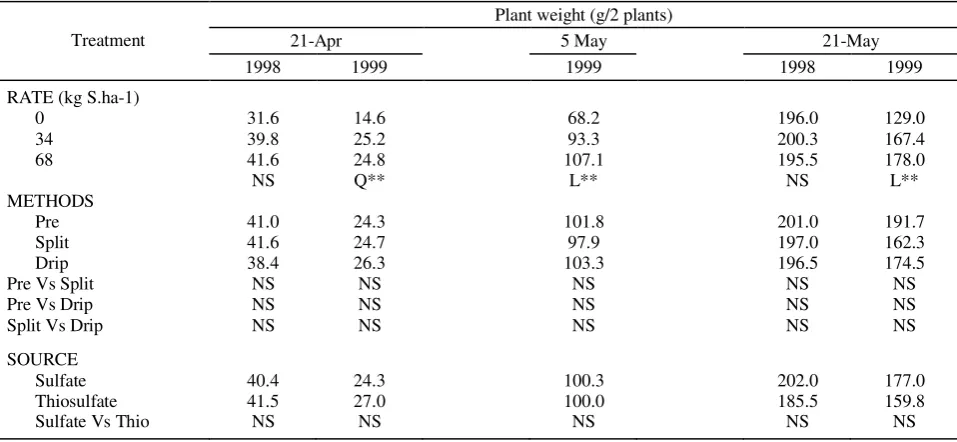
Tomato growth was not influenced significantly by the methods of applications and source of S at all sampling times in both seasons (Table 2 and 3). However, tomato growth was significantly influenced by S rate in spring 1999. Sulfur deficiency symptoms were first observed in younger leaves at 4 weeks after transplanting (WAT) on the plants grown with no S application. As the growing period progressed, these
visible symptom become more pronounced and spread to the lower leaf and finally reduced plant size.
By 21 Apr. 1999, approximately three weeks after transplanting, plants were quadratically larger with an increase in the rate of S applied to 68 kg S .ha-1. At the second and third sampling, plants were also largest with the largest S rate, but the response to S rate was linear. The effect of S rate on plant growth was not significant in spring 1998, however plant dry weights were larger than in spring 1999.
Table 2. Effect of S rate, source, and methods of application on tomato plant height in spring 1998 and 999
Plant height (cm)
21-Apr 5-May 21-May
Treatment
1998 1999 1998 1999 1998 1999
RATE (kg S.ha-1)
0 21.0 21 58 47 76.0 55.0
34 21.0 27 67 55 81.0 63.0
68 22.0 27 68 59 81.0 66.0
NS Q** Q** L** L** L**
METHODS
Pre 22 27 66 57 83 65
Split 22 27 68 57 82 64
Drip 22 27 68 60 81 64
Pre Vs Split NS NS NS NS NS NS
Pre Vs Drip NS NS NS NS NS NS
Split Vs Drip NS NS NS NS NS NS
SOURCE
Sulfate 22 27 67 57 82 64
Thiosulfate 22 28 67 57 82 65
Sulfate Vs Thio NS NS NS NS NS NS
*, ** = Significant at 0.05 and 0.01 probability level, respectively, and NS = Not significant at P>0.05, L = linear, Q = quadratic
Table 3. Effect of S rate, source, and methods of application on tomato plant weight in spring 1998 and 1999
Plant weight (g/2 plants)
21-Apr 5 May 21-May
Treatment
1998 1999 1999 1998 1999
RATE (kg S.ha-1)
0 31.6 14.6 68.2 196.0 129.0
34 39.8 25.2 93.3 200.3 167.4
68 41.6 24.8 107.1 195.5 178.0
NS Q** L** NS L**
METHODS
Pre 41.0 24.3 101.8 201.0 191.7
Split 41.6 24.7 97.9 197.0 162.3
Drip 38.4 26.3 103.3 196.5 174.5
Pre Vs Split NS NS NS NS NS
Pre Vs Drip NS NS NS NS NS
Split Vs Drip NS NS NS NS NS
SOURCE
Sulfate 40.4 24.3 100.3 202.0 177.0
Thiosulfate 41.5 27.0 100.0 185.5 159.8
Sulfate Vs Thio NS NS NS NS NS
Fruit yield
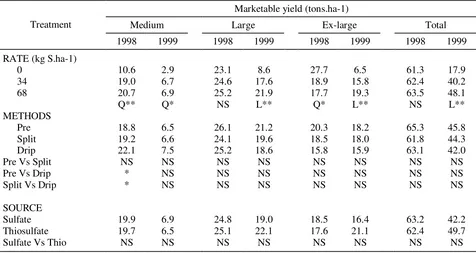
Fruit yield was not influenced by S methods of application. There were not significant effect among preplant, split, and drip application of S on total marketable, extra large, large, and medium fruit size in both season, except on medium fruit size in spring 1998 (Table 4). Fruit yield also was not influenced by S source of sulfate and thiosulfate application. In spring
1998, S rate had no effect on total marketable yield although S deficiency symptom observed in the plant growth with no S application. In the spring 1999, however, a significant response to S rate was obtained. Total marketable yield increased linearly from 17.9 tons.ha-1 to 48.1 tons.ha-1 with application of 0 kg S.ha-1 to 68 kg S.ha-1, respectively. However total marketable yield in spring 1999 was lower than in spring 1998.
Table 4. Effect of S rate on tomato total marketable yield in spring 1998 and 1999
Marketable yield (tons.ha-1)
Medium Large Ex-large Total
Treatment
1998 1999 1998 1999 1998 1999 1998 1999
RATE (kg S.ha-1)
0 10.6 2.9 23.1 8.6 27.7 6.5 61.3 17.9
34 19.0 6.7 24.6 17.6 18.9 15.8 62.4 40.2
68 20.7 6.9 25.2 21.9 17.7 19.3 63.5 48.1
Q** Q* NS L** Q* L** NS L**
METHODS
Pre 18.8 6.5 26.1 21.2 20.3 18.2 65.3 45.8
Split 19.2 6.6 24.1 19.6 18.5 18.0 61.8 44.3
Drip 22.1 7.5 25.2 18.6 15.8 15.9 63.1 42.0
Pre Vs Split NS NS NS NS NS NS NS NS
Pre Vs Drip * NS NS NS NS NS NS NS
Split Vs Drip * NS NS NS NS NS NS NS
SOURCE
Sulfate 19.9 6.9 24.8 19.0 18.5 16.4 63.2 42.2
Thiosulfate 19.7 6.5 25.1 22.1 17.6 21.1 62.4 49.7
Sulfate Vs Thio NS NS NS NS NS NS NS NS
*, ** = Significant at 0.05 and 0.01 probability level, respectively, and NS = Not significant at P>0.05, L = linear, Q = quadratic
Plant S Concentration
Total S concentration in leaf and plant tissue increased linearly in response to S rate application of 0 kg S.ha-1 to 68 kg S.ha-1 at all sampling time in both season, except increased quadraticaly at 2 Jun. 1999. Total leaf S concentrations were lower than in the whole plant tissue (Table 5). Sulfur deficiency symptom observed on the plant grown with no S application could be attributed to S concentration in the leaf. With no S application, leaf S concentration ranged between 0.12 to 0.19% dry weight at all sampling time. In previous work with greenhouse-grown tomatoes, Cerda et al. (1984) reported S deficiency symptom occurs when leaf S concentration was less than 0.18% dry weight, also Hu et al. (1991) reported on pecan when leaf S concentration approximately 0.15% dry weight.
In spring 1999 study, total marketable yield increased linearly with S application. This response
could be attributed to S nutrition, due to leaf and plant S concentrations also increased linearly. With S application of 68 kg S.ha-1, leaf S concentration at 5 May was 0.49 and 0.34% dry weight in 1998 and 1999, respectively. Maximum yield of greenhouse grown tomatoes associated with S leaf concentration of 0.48 to 1.2% dry weight was reported by Cerda et al. (1984).
Table 5. Effect of S rate, source, and methods of application on S concentration of leaf and plant in spring 1998 and 1999
S leaf concentration (%dw) S plant conc.(%dw)
21 Apr 5 May 21 May 1999
Treatment
1998 1999 1998 1999 1998 1999 21 Apr 5 May 21 May
RATE (kg S.ha-1)
0 0.19 0.18 0.15 0.12 0.19 0.17 0.22 0.17 0.25
34 0.36 0.28 0.26 0.23 0.33 0.44 0.33 0.33 0.33
68 0.49 0.34 0.35 0.31 0.47 0.52 0.39 0.42 0.37
L** L** L** L** L** Q** L** L** L**
METHODS
Pre 0.37 0.29 0.23 0.13 0.26 0.38 0.35 0.34 0.27
Split 0.45 0.31 0.31 0.19 0.44 0.51 0.37 0.38 0.38
Drip 0.45 0.32 0.37 0.23 0.46 0.52 0.33 0.39 0.39
Pre Vs Split NS NS ** ** ** ** NS NS
Pre Vs Drip NS NS ** ** ** ** NS NS
Split Vs Drip NS NS * * NS NS * NS NS
SOURCE
Sulfate 0.43 0.32 0.31 0.18 0.39 0.49 0.35 0.36 0.34
Thiosulfate 0.42 0.28 0.31 0.20 0.42 0.48 0.37 0.41 0.38
Sulfate Vs Thio NS NS NS NS NS NS NS NS NS
*, ** = Significant at 0.05 and 0.01 probability level, respectively, and NS = Not significant at P>0.05, L = linear, Q = quadratic
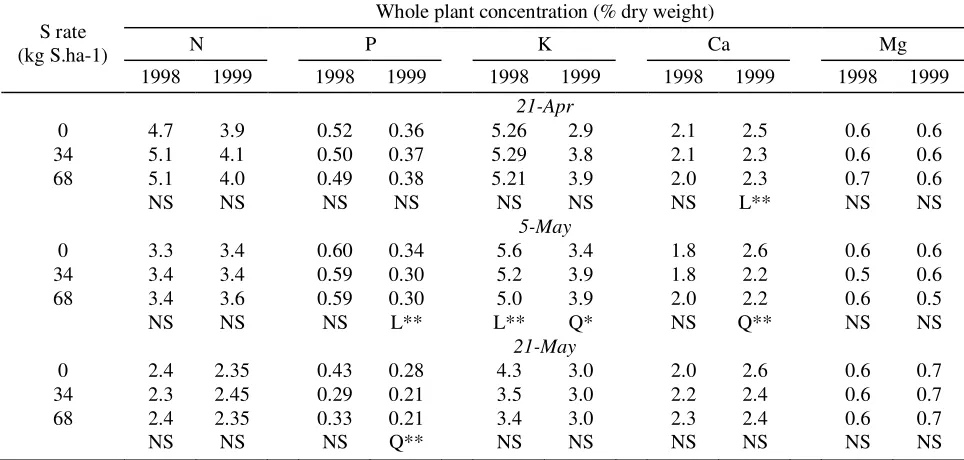
N, P, K, Ca and Mg Concentration
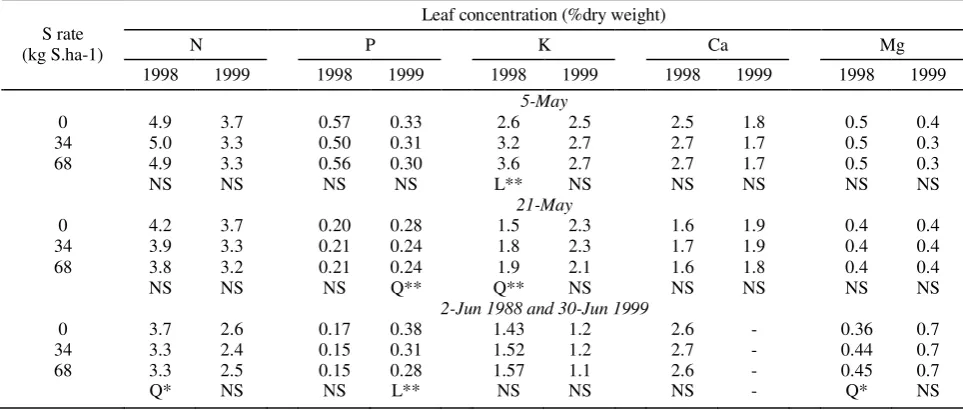
Methods of application and source of S did not influence leaf and plant N, P, K, Ca, and Mg concentration in both seasons (Table 6 and 7). Concentration of P, K, Ca and Mg in the leaf at 5 May and 21 May sampling time fell within adequate range
(Hochmuth, 1999). Leaf N concentration , however, fell in high level. In spring 1998, S application to 68 kg S.ha-1 increased linearly leaf K concentration at 5 May, but quadratically at 21 May sampling time. In spring 1999, application of S reduced leaf and plant P concentration 14 and 12% at mid season, and 26 and 25% at late season sampling time, respectively.
Table 6. Effect of S rate on tomato leaf tissue N, P, K, Ca , and Mg at three sampling times in spring 1998 and 1999
Leaf concentration (%dry weight)
N P K Ca Mg
S rate (kg S.ha-1)
1998 1999 1998 1999 1998 1999 1998 1999 1998 1999
5-May
0 4.9 3.7 0.57 0.33 2.6 2.5 2.5 1.8 0.5 0.4
34 5.0 3.3 0.50 0.31 3.2 2.7 2.7 1.7 0.5 0.3
68 4.9 3.3 0.56 0.30 3.6 2.7 2.7 1.7 0.5 0.3
NS NS NS NS L** NS NS NS NS NS
21-May
0 4.2 3.7 0.20 0.28 1.5 2.3 1.6 1.9 0.4 0.4
34 3.9 3.3 0.21 0.24 1.8 2.3 1.7 1.9 0.4 0.4
68 3.8 3.2 0.21 0.24 1.9 2.1 1.6 1.8 0.4 0.4
NS NS NS Q** Q** NS NS NS NS NS
2-Jun 1988 and 30-Jun 1999
0 3.7 2.6 0.17 0.38 1.43 1.2 2.6 - 0.36 0.7
34 3.3 2.4 0.15 0.31 1.52 1.2 2.7 - 0.44 0.7
68 3.3 2.5 0.15 0.28 1.57 1.1 2.6 - 0.45 0.7
Q* NS NS L** NS NS NS - Q* NS
Table 7. Effect of S rate on tomato whole plant tissue N, P, K, Ca , and Mg at three sampling times in spring 1998 and 1999
Whole plant concentration (% dry weight)
N P K Ca Mg
S rate (kg S.ha-1)
1998 1999 1998 1999 1998 1999 1998 1999 1998 1999
21-Apr
0 4.7 3.9 0.52 0.36 5.26 2.9 2.1 2.5 0.6 0.6
34 5.1 4.1 0.50 0.37 5.29 3.8 2.1 2.3 0.6 0.6
68 5.1 4.0 0.49 0.38 5.21 3.9 2.0 2.3 0.7 0.6
NS NS NS NS NS NS NS L** NS NS
5-May
0 3.3 3.4 0.60 0.34 5.6 3.4 1.8 2.6 0.6 0.6
34 3.4 3.4 0.59 0.30 5.2 3.9 1.8 2.2 0.5 0.6
68 3.4 3.6 0.59 0.30 5.0 3.9 2.0 2.2 0.6 0.5
NS NS NS L** L** Q* NS Q** NS NS
21-May
0 2.4 2.35 0.43 0.28 4.3 3.0 2.0 2.6 0.6 0.7
34 2.3 2.45 0.29 0.21 3.5 3.0 2.2 2.4 0.6 0.7
68 2.4 2.35 0.33 0.21 3.4 3.0 2.3 2.4 0.6 0.7
NS NS NS Q** NS NS NS NS NS NS
*, ** = Significant at 0.05 and 0.01 probability level, respectively, and NS = Not significant at P>0.05, L = linear, Q = quadratic
The N/S ratio has been proposed to better express the S status in the plants than total S alone (DeBoer and Duke, 1982). Increasing S application to 68 kg S.ha-1 reduced N/S ratio in leaves at all sampling time (Table 8). By 5 May, at flowering stage, increasing in S application from 0 to 68 kg S.ha-1 reduced N/S ratio from 25.8 to 10.0 and from 20.6 to 9.7 in spring 1998 and 1999, respectively. In plant without visible N or S deficiency, a N/S ratio of ~ 9 was proposed to be near the optimum for maximum growth of pecan (Carya illinoensis) (Hu and Spark, 1992), ratio of 16 found in
sorghum-sudangrass (Sorghum sudanese) (Mitchell and Blue, 1981), and ratio of 15 found in lucerne (Medicago sativa) (DeBoer and Duke, 1982).
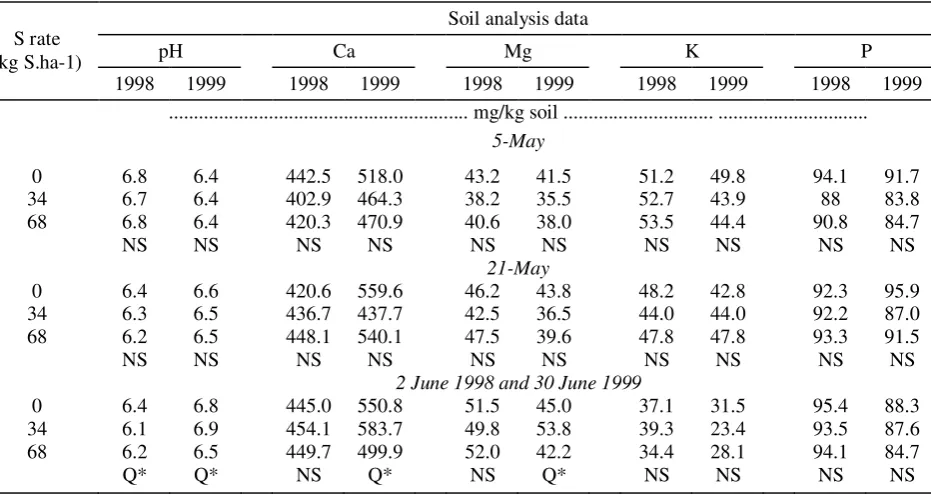
There was no significant response of soil pH, P, K, Ca, and Mg to S-source, rate, and methods of application at 5 May and 21 May in both seasons (Table 9). In the end of the season, however, S application reduced soil pH ~ 0.3 unit, also application of S from 0 to 68 kg S.ha-1 reduced quadraticaly soil Ca and Mg concentration.
Table 8. Effect of S rate on tomato leaf N/S ratio tomato at three sampling time in spring 1998 and 1999
5-May 21-May 2-Jun.
S rate
(kg S.ha-1) 1998 1999 1998 1999 1998 1999
0 25.8 20.6 28.0 30.8 19.5 15.3
34 13.8 11.8 15.0 14.3 10.0 5.5
Table 9. Effect of S rate on soil pH, Ca , Mg, K, and P at three sample times in spring 1998 and 1999
Soil analysis data
pH Ca Mg K P
S rate (kg S.ha-1)
1998 1999 1998 1999 1998 1999 1998 1999 1998 1999 ... mg/kg soil ... ...
5-May
0 6.8 6.4 442.5 518.0 43.2 41.5 51.2 49.8 94.1 91.7 34 6.7 6.4 402.9 464.3 38.2 35.5 52.7 43.9 88 83.8 68 6.8 6.4 420.3 470.9 40.6 38.0 53.5 44.4 90.8 84.7
NS NS NS NS NS NS NS NS NS NS
21-May
0 6.4 6.6 420.6 559.6 46.2 43.8 48.2 42.8 92.3 95.9 34 6.3 6.5 436.7 437.7 42.5 36.5 44.0 44.0 92.2 87.0 68 6.2 6.5 448.1 540.1 47.5 39.6 47.8 47.8 93.3 91.5
NS NS NS NS NS NS NS NS NS NS
2 June 1998 and 30 June 1999
0 6.4 6.8 445.0 550.8 51.5 45.0 37.1 31.5 95.4 88.3 34 6.1 6.9 454.1 583.7 49.8 53.8 39.3 23.4 93.5 87.6 68 6.2 6.5 449.7 499.9 52.0 42.2 34.4 28.1 94.1 84.7
Q* Q* NS Q* NS Q* NS NS NS NS
*, ** = Significant at 0.05 and 0.01 probability level, respectively, and NS = Not significant at P>0.05, L = linear, Q = quadratic
CONCLUSIONS
In conclusion, with polyethylene -mulched and drip irrigation in Florida sandy soil, tomato growth and yield can be increased by S application. The S deficiency symptom was pronounced when leaf S content less than 0.19% dry weight and N/S ratio more than 25.8. Tomato leaf S analysis at flowering stage (4 to 6 weeks after transplanting) can be used to diagnosis evaluation of the S status of tomato because at this growth stage it still possible to correct or alleviate S deficiency problem.
REFERENCES
Blue, G.W., E. Jacome, J. Afre, D. Perez, S. Brown, D.W. Jones. 1981. Sulfur and manganese deficiencies as causes of poor plant growth on Florida's sandy soil. Soil and Crop Sci. Soc. Fla. Proc 40:95-101.
_________. T.G. Malik. 1986. The requirement for sulfur and micronutrient of white clover growing in pots on a Florida spodosol. Soil and Crop Sci. Soc. Fla. Proc 45:81-86.
Cerda, A., V. Martinez, M. Caro , F.G. Fernandez. 1984. Effect of sulfur deficiency and excess on yield and sulfur accumulation in tomato plants. Journal of Plant Nutrition. 7(11) : 1529-1543.
DeBoer, D.L., S.H. Duke. 1982. Effects of sulfur nutrition on nitrogen and carbon metabolism in lucerne (Medicago sativa L.). Physiol. Plant. 54:343-350.
Hanlon, E.A., G. Gonzales, J.M. Bartos. 1994. IFAS extension soil testing laboratory chemical procedures and training manual. Florida. Coop. Ext. Serv. Circ. 812.
Hochmuth, G.J. 1999. Tomato fertilizer management. Florida Tomato Institute Proceeding. p. 65-71.
Hu, H., D. Sparks. 1992. Nitrogen and sulfur interaction influences net photosynthesis and vegetative growth of pecan. J. Amer. Soc. Hort. Sci. 117(1):59-64
___________________., J.J. Evans. 1991. Sulfur deficiency influences vegetative growth, chlorophyll and element concentrations, and amino acid of pecan. J. Amer. Soc. Hort. Sci. 116(6):974-980.
Jones, Jr., J.B. 1995. Determining total sulfur in plant tissue using the HACH kit spectrophotometer techniques. Sulphur in Agriculture. 19:58-62.
effects on drip-irrigated tomato yield and leaf tissue analysis. HortSci. 32:1204-1207.
___________., S.M. Olson, F.M. Rhoads. 1989. Water quantity and time of N and K application for trickle-irrigated tomatoes. J. Amer. Soc. Hort. Sci. 114:265-268.
Mitchell, C. C. Jr. W.G. Blue. 1981. The sulfur fertility status of Florida soil. II. An evaluation of subsoil S on plant nutrition. Proc. Soil. Crop. Soc. Fla. 40:77-82.
Monteiro, F.A., W.G. Blue. 1990. Effects of sulfur and molybdenum applied to a spodosol on white clover-pensacola bahiagrass growth and composition. Soil and Crop Sci. Soc. Fla. Proc 49:72-77.
Scholberg, J.M.S., S.J. Locascio. 1999. Growth response of snap bean and tomato as affected by salinity and irrigation method. HortSci. 34(2):259-264.
Susila, A.D., S. J. Locascio. 1999. Greenhouse evaluation of S requirement on tomatoes (Lycopersicon esculentum Mill. L). Proc. Fla. State Hort. Soc. 112: 323-325.
U.S. Department of Agriculture. 1976. United Stated standards for grades of fresh tomatoes. USDA, Agr. Marketing serv., Washington, D.C.