Abstract
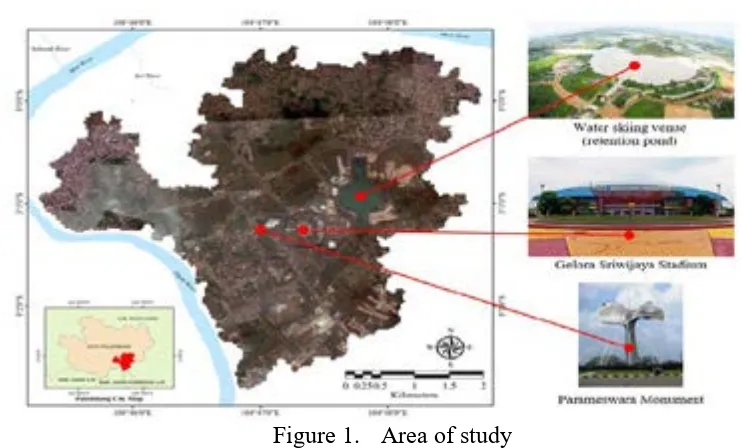
Jakabaring is an area in the Palembang City which has been growing rapidly for over last ten years. Most of this area has been developed for sport center, government office, business and commercial district, school, and residential areas since early 2000; which was formerly large lowland. Due to the rapidly increasing development, the lowland areas decreased which might lead to an increased risk of flooding. This study aims to analyze the land cover change within Jakabaring sub basin and its impact on surface runoff. Land cover change analysis was done using Semi-Automatic Classification plug-in installed on QGIS to Landsat images for year 2002 and 2013. The rational method was used in this study to estimate the peak runoff rate. The results of this study show that the vegetated area has decreased by as much as 527.83 ha (26.37%), while the built-up area increased by as much as 540.38 ha (27.00%). The decrease of vegetated area mostly due to the area was converted into built-up area. The land cover change within Jakabaring sub basin was estimated to increase the peak runoff rate about 30.23%. Hence, this condition could make the area become more risky to flood.
Keywords: flooding, lowland, rational method, remote sensing
INTRODUCTION
General Background
The land cover is one of important factors in hydrologic analysis. It is used to calculate the magnitude of surface runoff that can cause flooding. The changing of land cover within a sub basin especially in urban area from unpaved area to paved area can trigger the increase of surface runoff volume. As an area continues to be developed, then the analysis of land cover change becomes indispensable.
changed significantly from wetland to be paved areas for sport center, government
office, commercial area, school, and residential area. For the future, government
has planned to develop this area to be an economic center in Palembang City. In
order to anticipate the increase of flood risk in Jakabaring sub basin, it is
necessary to analyze the land cover change within this area.
Figure 1. Area of study
Literature Study
Many studies have been conducted to analyze the impact of land coverchange on
surface runoff; among them were studies carried out by Shi, et al. (2007), Wan
and Yang (2007), Githui, et al. (2009), Olang, et al. (2012), Jia and Wan (2012), and also Sajikumar and Remya (2014).
The remote sensing and geographical information system (GIS) are useful for analyzing and mapping land cover change within an area in order to understand
and monitor spatial changes (Africover, 2002 in Congedo and Munafo’, 2012).
Congedo and Munafo’ (2012) developed a methodology for monitoring spatial
changes through remote sensing and GIS techniques, which the processing
software could be accessed from open-source software, particularly QGIS. The
developed methodology used Landsat satellite images, because of their spatial and
spectral resolutions, multitemporal images availability, and particularly the free
cost of data; which could be retrieved from U.S. Geological Survey (USGS)
The rational method is the most popular method used to estimate the rate of runoff
for the design of storm drainage (Yen and Akan, 1999 in Mays, 2001). It is mostly used for determination of peak flow rate within urban catchments (Ghosh, 2014).
The idea behind the rational method is that if a constant intensity of rainfall which
is uniformly spread over an area begins instantaneously and continues
indefinitely, the rate of runoff will increase until the time of concentration; when
the entire watershed is contributing to flow at the outlet. It is thus evident that the
maximum rate of runoff will occur when the rainfall duration equals the time of
concentration. Using the rational method, the peak of storm runoff is estimated by
the rational formula as
The runoff coefficient C is defined as the ratio of inflow rate (the product of
rainfall intensity I and watershed area A) for the system to the rate of peak
discharge Q (which occurs at time of concentration). This coefficient is ranging
between 0 to 1 (0 ≤ C ≤ 1) depends on the surface characteristic of area.
Suggested runoff coefficients for various surface types can be seen in Chow, et al.
(1988) and Ghosh (2014).
In urban areas, thedrainage area usually consists of subareas of different surface
coverage. As a result, an average coefficient is required to account all of surface coverage. The average runoff coefficient for use in the rational method can be
calculated using the following equation:
∑
C : average runoff coefficient (-)
Ci : runoff coefficient for each surface coverage (-)
Methodology
The analysis of land cover change in this study was done by remote sensing
method using Semi-Automatic Classification plug-in installed on QGIS, which is
one of the most widely used open source GIS software. The area of Jakabaring
sub basin studied was approximately 2001 ha. The dataset used were Landsat 7
ETM image for year 2002, which was acquired on June 30th, 2002 and Landsat 8 OLI & TIRS for year 2013, which was acquired on June 20th, 2013. Both of images were corrected and sharpened using Dark Object Subtraction (DOS)
atmospheric correction and pan-sharpening method before analyzed (Congedo,
2015). The pixel size of the images was 15 m x 15 m. The band set used for land cover classification was composed of band 2, 3, 4, 5, 6, and 7. The land cover
classifications used in this study were grouped into built-up (building, parking lot,
road, and etc.), water bodies (lake, retention pond, river, and etc.), vegetated areas
(swamp, garden, and etc.), and bare soil. Since the supervised classification was
applied in this study, the region of interest (RoI) or training area for each
classification used to identify the same classes in the image and also helped by
using aerial image for area of study. After completing RoI, then the land cover
classifications for year 2002 and 2013 were analyzed. The changing of area on
each classification between these two years is called by the land cover change.
The impact of land cover change in respect to surface runoff was estimated by
using rational method since no runoff data were available in the area of study.
RESULTS AND DISCUSSION
Land Cover Changes
The Landsat images for year 2002 and 2013 respectively are shown in Figure 2. The combination of band for image of 2002 is 3, 4, 7 RGB (red, green, and blue),
while for image of 2013 is 4, 5, 7 RGB; which is suitable to describe vegetated
area (shown as green color), built-up (shown as purple color), water body (shown
as black and dark red), and bare soil (shown as light purple color). The images
have corrected using DOS correction and sharpened using pan-sharpening so the
Figure 2. Landsatimages for year 2002 (a), and 2013 (b)
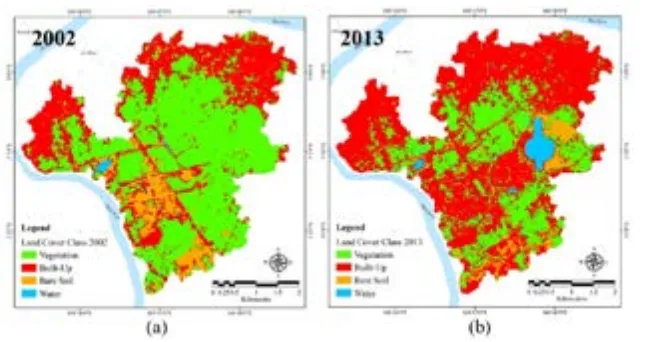
The land cover classifications for year 2002 and year 2013 respectively are shown
in Figure 3. The vegetated area is shown in green color, while the built-up, water
body and bare soil are shown in red, blue, and orange respectively. From Figure 3,
it is obviously can be seen that Jakabaring sub basin has changed significantly to
be built-up area over last ten years. The land cover changes in Jakabaring in more
detail are given in Table 1. From Table 1, the vegetated area decreased from 1133.98 ha (56.66%) in 2002 to 606.16 ha (30.29%) in 2013 or in other words
decreased as much as 527.83 ha (26.37%), while the built-up area increased as
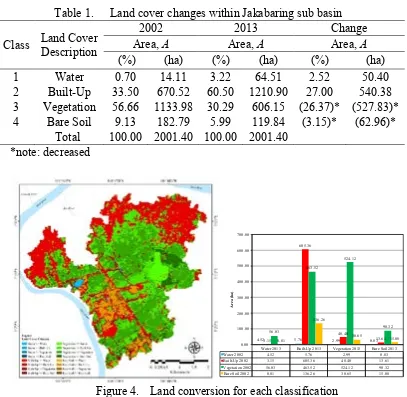
much as 540.38 ha (27.00%). This condition can lead the increase of surface runoff rate in the Jakabaring sub basin. The land conversion for each classification
is shown in Figure 4.
Table 1. Land cover changes within Jakabaring sub basin
1 Water 0.70 14.11 3.22 64.51 2.52 50.40
2 Built-Up 33.50 670.52 60.50 1210.90 27.00 540.38
3 Vegetation 56.66 1133.98 30.29 606.15 (26.37)* (527.83)*
4 Bare Soil 9.13 182.79 5.99 119.84 (3.15)* (62.96)*
Total 100.00 2001.40 100.00 2001.40
*note: decreased
Figure 4. Land conversion for each classification
Figure 4 above shows that the largest land conversion is the conversion of
vegetated area into built-up area which is covering about 463.52 ha followed by
bare soil into built-up area about 136.26 ha, and vegetated area into bare soil
about 90.32 ha. The land conversions could explain that the decrease of vegetated
area mostly caused by the area was converted to be built-up area. Moreover, the
conversion of vegetated area into bare soil and then bare soil into built-up show a
strong tendency the built-up area might be more increase in the future.
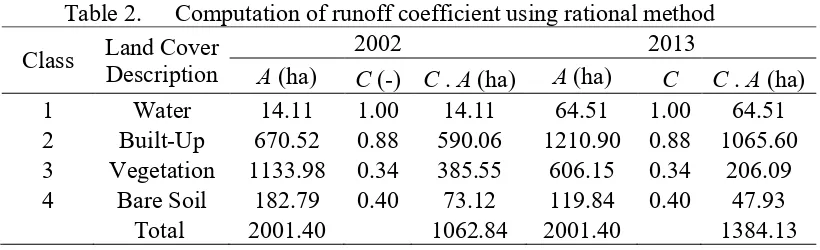
Since the area consists of four different land covers, an average runoff coefficient
analysis is required. The computation of runoff coefficient for each land covers
using rational method given in Table 2.Based on Table 2 above, the average
runoff coefficient for year 2002 can be calculated as
Water 2013 Built-Up 2013 Vegetation 2013 Bare Soil 2013
Water 2002 4.52 5.76 2.99 0.83
Built-Up 2002 3.15 605.36 48.40 13.61 Vegetation 2002 56.03 463.52 524.12 90.32 Bare Soil 2002 0.81 136.26 30.65 15.08
53
C while the average runoff coefficient for year 2013
can be also calculated asC2013 =1384.13 2001.40=0.69
Table 2. Computation of runoff coefficient using rational method
Class Land Cover Description
2002 2013
A(ha) C(-) C.A(ha) A(ha) C C.A(ha)
1 Water 14.11 1.00 14.11 64.51 1.00 64.51
2 Built-Up 670.52 0.88 590.06 1210.90 0.88 1065.60
3 Vegetation 1133.98 0.34 385.55 606.15 0.34 206.09
4 Bare Soil 182.79 0.40 73.12 119.84 0.40 47.93
Total 2001.40 1062.84 2001.40 1384.13
Time of Concentration
The time of concentration used in the rational method is the time associated with the peak runoff from the watershed to the point of interest. Runoff from a
watershed usually reaches a peak at the time when the entire watershed
contributing; in this case, the time of concentration is the time for a drop of water
to flow from the remotest point in the watershed to the time the entire watershed is
contributing (Mays, 2001).
The time of concentration in this study was calculated using Kirpich equation (1940) as expressed in the following equation:
385
tc : time of concentration (hr)
L : length of channel/ditch from headwater to outlet (km)
S : average watershed slope (km/km)
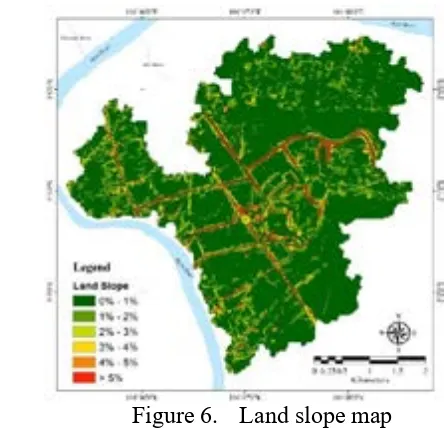
Based on GIS analysis to digital terrain model (DTM) which is also known as
digital elevation model (DEM) and drainage networks as shown in Figure 5, and
also land slope map (Figure 6), it was obtained the average watershed slope and
length of channel repectively were 0.65 degree (1.14%) and 8.16 km. By using Equation (3), it can be calculated that time of concentration is 1.72 hour. The time
Figure 5. Digital terrain model (DTM) overlaid by drainage networks
Figure 6. Land slope map
Design Rainfall
The design rainfall for the sub basin was calculated by frequency analysis using
28 years (1988-2015) long-term observed data obtained from Plaju gage station
operated by BMKG (Badan Meteorologi, Klimatologi, dan Geofisika) Palembang.
Table 3 below shows the design rainfall according to the probabilities.
Table 3. Design rainfall according to the probabilities
P(X≥ Xm) T Design rainfall (mm/day)
Probability Return Period Normal Log-Normal Gumbel Log-Pearson III
XT KT XT KT XT KT XT KT
0.9 1.1 72.936 -1.282 72.910 -1.282 78.014 -1.100 71.821 -1.334 0.5 2. 108.846 0.000 104.992 -0.138 104.243 -0.164 109.421 0.145 0.2 5. 132.429 0.842 133.402 0.876 129.006 0.719 133.782 0.852 0.1 10. 144.756 1.282 151.191 1.511 145.401 1.305 145.545 1.148 0.05 20. 154.937 1.645 167.658 2.099 161.128 1.866 154.520 1.358 0.02 50. 166.394 2.054 188.345 2.837 181.485 2.592 163.680 1.560 0.01 100. 174.033 2.326 203.536 3.379 196.739 3.137 169.181 1.677 0.001 1,000. 195.437 3.090 252.953 5.143 247.145 4.936 181.862 1.931
Based on the goodness of fit test using chi-square and Smirnov Kolmogorov
method, the normal distribution was the best probability distribution for the
rainfall data series. Therefore, the design rainfall was calculated using normal
The rainfall intensity during time of concentration in this study was calculated
using Mononobe methodwhich is expressed in the following equation:
3
R24: maximum daily rainfall (mm/day)
By using design rainfall from Table 3 and time of concentration previously
obtained, the rainfall intensity for each return period can be calculated using
Equation (4) where the result is given in following Table 4.
Table 4. Design rainfall intensity
Using rational method from Equation (1), the peak runoff rate for year 2002 and 2013 can be calculated which the result as shown in Table 5.
Table 5. Peak runoff rate for every return period
Year Peak runoff rate, Q(m3/s)
2-year 5-year 10-year 20-year 50-year 100-year 2002 77.67 94.49 103.29 110.55 118.73 124.18 2013 101.15 123.06 134.51 143.97 154.62 161.72
From Table 5 above, the magnitude of peak runoff for each return period
increased on average 30.23% from year 2002 to 2013. This can be understood as
the result of the increase of built-up area as much as 27%, while the vegetated
area decreased as much as 26.37%. Since Jakabaring area is going to be more
developed in the future, the increase of runoff can be higher than that magnitude.
Furthermore, this condition can make Jakabaring sub basin becomes more risky
CONCLUSION
From the analysis and previously discussion, it can be concluded as followings:
1. The Jakabaring sub basin has changed significantlyfor over last ten years due
to lowland reclamation generally by the development of sport center,
government office, commercial and residential areas.
2. The vegetated area has decreased as much as 527.83 ha (26.37%), while the
built-up area has increased as much as 540.38 ha (27.00%) from year 2002 to
2013.
3. The largest land conversion is the conversion of vegetated area into built-up
area which is covering about 463.52 ha followed by bare soil into built-up
area about 136.26 ha and vegetated area into bare soil about 90.32 ha.
4. The land cover changes within Jakabaring sub basin estimated to increase the
peak runoff as much as 30.23%, so this condition can make the area become
more risky to flooding.
ACKNOWLEDGEMENTS
The authors would like to express their sincere thanks to BMKG and BAPPEDA of Palembang City for providing the dataset and also Handy Wibowo who has
helped in dataset preparation and processing.
REFERENCES
Chow, V.T., Maidment, D.R., and Mays, L.W., 1988. Applied Hydrology, Mc
Graw-Hill Book Company, Singapore.
Congedo L., and Munafo’, M., 2012. Development of a Methodology for Land
Cover Classification in Dar es Salaam using Landsat Imagery, Working
Paper, Rome: Sapienza University, http://www.planning4adaptation.eu/ Docs/papers/08_NWP-DoM_for_LCC_in_Dar_using_Landsat_Imagery.pdf [accessed on 11 April 2016]
Congedo, L., 2015. Semi-Automatic Classification Plugin Documentation,
Githui, F., Mutua, F., and Bauwens, W., 2009. Estimating the impacts of land -cover change on runoff using the soil and water assessment tool (SWAT):
case study of Nzoia catchment, Kenya. Hydrological Sciences–Journal–des
Sciences Hydrologiques, Vol. 54(5): 899-908, DOI: 10.1623/hysj.54.5.899.
Ghosh, S.N., 2014. Flood Control and Drainage Engineering, Fourth Edition,
CRC Press, London.
Jia, H., and Wan, R., 2012. Simulating the Impacts of Land use/Cover Change on
Storm-Runoff for a Mesoscale Watershed in east China. Advanced Materials Research, Vol. 347-353 (2012): 3856-3862.
DOI:10.4028/www.scientific.net/AMR.347-353.3856.
Mays, L.W., 2001. Water Resources Engineering, John Wiley and Sons, New
York.
Olang, L.O., Kundu, P.M., Ouma, G., and Furst, J., 2012. Impact of land cover
change scenarios on storm runoff generation: a basis for management of the
Nyando Basin, Kenya. Land Degradation & Development, DOI:
10.1002/ldr.2140.
Sajikumar, N., and Remya, R.S., 2014. Impact of land cover and land use change
on runoff characteristics. Journal of Environmental Management, xxx (2014): 1-9. http://dx.doi.org/10.1016/j.jenvman.2014.12.041.
Shi, P.J., Yuan, Y., Zheng, J., Wang, J.A., Ge, Y., and Qiu, G.Y., 2007. The effect of land use/cover change on surface runoff in Shenzhen region, China.
Catena, Vol. 69(2007): 31 – 35, doi:10.1016/j.catena.2006.04.015.
Wan, R., and Yang, G., 2007. Influence of Land Use/Cover Change on Storm
Runoff - A Case Study of Xitiaoxi River Basin in Upstream of Taihu Lake
Watershed. Chinese Geographical Science, Vol.17(4): 349-356, DOI: