KETERAMPILAN KOMPUTER &
PENGELOLAAN INFORMASI
Preface
“The illiterate of the 21st century will not be those who cannot read or write, but those who cannot learn, unlearn, and
relearn.” ~ Alfin Toffler.
This Keterampilan Komputer & pengelolaan Informasi Book for 11th Grade SMAKBo Student isn't the first computer
book written for the purpose of teaching computer skills for SMAKBo students, but this may be the first one to be written
completely under GNU/Linux environment. A cost-effective computing OS environment started by Linus Torvalds & Richard
Stallman. As the world is starting to leave the traditional x86 / Windows working environment, we feel that our future
students should too, taste how it feel to learn the computing world in an Open Source way.
This Preface is written by the author at 3.20 AM, October 11th 2012 in the dead of the morning. Thinking he's Alan Wake.
Or maybe even Stephen King. In the hopes that this book would be read, understood, and practiced by those who read it in
their daily life in the best possible way.
Live long & Prosper! V(^_^)
About the Author
Mohamad Tachya Wiratanudatar is a Civil Servant at the Indonesia's Ministry of Industry working as a Computer Teacher
at Sekolah Menengah Analisis Kimia Bogor since 2009. Aside teaching LibreOffice & GIMP to the 11th grade, he also manages
the computer lab at his workplace. His passion includes everything computey, (is that a word?) films, and reading.
Meti Kurnia Sabarini is a Civil Servant at the Indonesia's Ministry of Industry working as a Computer Teacher at Sekolah
Menengah Analisis Kimia Bogor since 2004. Her passion include reading and swimming. Aside teaching computer at school,
Who should read this book
This book is written with the sole purpose to teach simple data analysis & making charts using LibreOffice Calc, making
simple presentation using LibreOffice Impress, basic image editing using GIMP, and basic HTML / CSS to 11th Grade SMAKBo
Students. But not limited to students only.
As of the writing of this book, the software used are Ubuntu 12.04 LTS, LibreOffice 3.5 and GIMP 2.6. the HTML /CSS used
in this book are based on W3C standards, HTML version 4.01 and CSS 2 with some CSS 3 featured.
This book is written completely using LibreOffice Writer version 3.5. The online / PDF version of this book is available for
download at https://www.dropbox.com/sh/n58i3mifk9erbtu/pxMWxxcr3Z/Modul-KKPI-Kls-11.pdf for free. And links to
Dedicated to my loving wife & kid.
Table of Content
Preface...i
About the Author...ii
Who should read this book...iii
Table of Content...v
Chapter 1 : Simple Data Analysis...8
SORT...8
FILTER...10
Auto Filter...10
Standard Filter...10
Advanced Filter...12
Chapter 2 : Simple Data Analysis (continued)...13
Subtotal...13
Bar & Column Chart...17
Line Chart...17
Exercise...20
Chapter 4 : LibreOffice Impress...21
Workspace View...21
inserting an element to slides...22
Master Pages...23
Layouts...23
Table Design...23
Slide Transition...23
Tips on creating a presentation using Impress...25
Chapter 6 : GIMP...27
Getting to know GIMP...27
Image File Types...29
Simple Photo Retouching...30
Getting to know Layers...32
Drawing with GIMP...33
Selection...35
Filters...37
Exercise...39
Chapter 7 : HTML & CSS...40
History of HTML & CSS...40
First HTML Page...40
HTML tags...42
CSS descriptor...42
Tables...43
Forms...44
Exercise...45
Chapter 8 : Bkchem & Chemical Calculator...46
Chemical Calculator...46
BKChem...47
Saving your work...48
Exercise...48
Chapter 1 : Simple Data
Analysis
Data Analysis is the means to find order from raw data, to
simplify information and make it easier to read data make
decisions from it. Life would be easier if everybody's data were
only two rows long and a few columns width. But in reality,
more often we have to deal more than hundreds of rows and
tens or more of columns to simplify, make charts and
information of, and decisions based from it.
This first chapter will try to explain what it means to
simplify any data we have in the shortest way possible through
LibreOffice Calc's feature of Sort, Filter, and Conditional Formatting.
SORT
The Sort feature in LibreOffice Calc is used to, well, sorting
out data. Be it ascending or descending. This feature can be
found through the pull-down menu Data Sort→ which will bring out this dialog box.
Where we will have a maximum of 3 levels of sort. (in MS
Excel, there are more than 3 levels of sorting). A 'Sort by'
indicates the first level of sorting, and the 'Then by' after it is
the next level of sorting.
For example, say that we have several rows of data looked
Then, we're going to sort it one level based on the column
“Kota”, all you have to do is go Data Sort → and Sort by “Kota” ascendingly. It will look like this.
Now that's just a 1 level sort, a 2 level sort basicaly will
arrange the data in the order of the first level, before
rearranging the data again based on the second column that
need to be sorted.
Let's try another example for 2 level sort. First open up the
Sort dialog box. And input Sort by “Kota”, Then by “Dept”. The
table should look like this.
The table looks just the same., But wait! There's a little bit
difference. Yes, the data from Denpasar City is sorted by the
Dept column alphabeticaly.
Now try to get the hang of it, find some larger amount of
data & try to use sort by 3 levels on it, for example try to tinker
with this data “DAFTAR KARYAWAN” below.
Some 3 levels sort should make that data much more
readable, Try sorting based on column 'Kota', 'Dept', or
'Pendidikan'!
The Options tab in the Sort dialog box contains several
options which most of the is not of use. However, there are few
notable option which might come in handy at times. Namely the
'Case sensitive' option which detects data with capital letters
and not, & the 'Copy sort results to' option where you can copy
the sort result to another location or sheet since sorting feature
changes the data you've been working on.
DEPT KOTA PENDIDIKAN
NO NAMA DEPT KOTA PENDIDIKAN GAJI POKOK TUNJANGAN
FILTER
The filter feature in Calc is used to hide rows of data that
doesn't match the criteria given. For example if you have some
hundreds of data and you want to filter out which one of these
data comes from the City Bogor, after filtering out, the other
data is not deleted, but hidden. And the data shown in the
spreadsheet are the only one comes from the criteria.
But the filter technique isn't as easy as it seem. There are 3
kinds of filter in Calc, they are Auto Filter, Standard Filter, &
Advanced Filter.
Auto Filter
Let's try out the first one on the table below.
Now lets try Auto Filter via the Data pull down menu. Data Filter Auto Filter.
→ → Don't forget to select the column
header before you do this! The data should look like this.
Auto Filter toggles a small button just beside the column
headers, When you click the buttons there will be a menu
showing which data you would like to filter.
Most of the time, Auto Filter is used to see top 10 data or if
there are empty data inside a table. Or in most cases where
there are many similar data.
The figure above shows the results of auto filtering data
showing 'Produksi' in column 'DEPT'.
Standard Filter
Standard Filter is the most common used filter. With
Standard Filter, you can put more than one category in a single
filter operation, and your operator option could be AND or OR,
unlike Auto Filter where the filter operator is always AND.
Standard Filter which will bring up a dialog box.
The Standard Filter provide several input needed which is
Field name (which column you'd like to filter), Condition (the
operator for the data value that is being filtered), and Value
(the condition that the data should be). And if there is more
than one criteria being filtered, the operator (the left most
input) provides Boolean operators (AND and OR) for the filter
criteria.
Let's try out an example for the same data we've been
doing!
Now try out some filter on the data above, filter out Field
name = 'Kota', Condition = '=' and Value = 'Jakarta'. This
operation will hide any other data where the value in the 'Kota'
Column isn't 'Jakarta'.
Now, add another criteria below this one with an AND
operator. Filter out where 'Pendidikan' column is 'S1'.
Voila! We hide every other data and only shows where 'Kota'
is 'Jakarta' and 'Pendidikan' is 'S1'!.
This is a two criteria filter with an AND Operator, The OR
operator provides ways to see if either one of the criteria is
valid, the filter operation will be executed, while the AND
operator runs both the criteria for the data.
Try other condition operator such as =, <, >, largest, and
contains and see the result for yourself, The operators should
be self explanatory.
NO NAMA DEPT KOTA PENDIDIKAN GAJI POKOK TUNJANGAN
1 Adam Saputra Produksi Jakarta S1 Rp1.350.000,00 Rp500.000,00 4 Bambang Dewantara Produksi Jakarta SMU Rp1.000.000,00 Rp300.000,00 9 Heri Pribadi Keuangan Jakarta S1 Rp1.375.000,00 Rp500.000,00 11 Ronny Hutagalung Pemasaran Jakarta S1 Rp2.500.000,00 Rp500.000,00
NO NAMA DEPT KOTA PENDIDIKAN GAJI POKOK TUNJANGAN
1 Adam Saputra Produksi Jakarta S1 Rp1.350.000,00 Rp500.000,00 9 Heri Pribadi Keuangan Jakarta S1 Rp1.375.000,00 Rp500.000,00 11 Ronny Hutagalung Pemasaran Jakarta S1 Rp2.500.000,00 Rp500.000,00
NO NAMA DEPT KOTA PENDIDIKAN GAJI POKOK TUNJANGAN
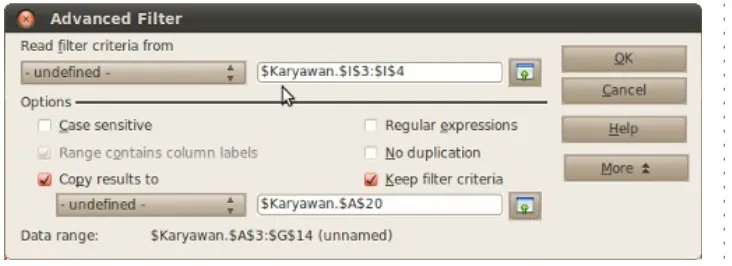
Advanced Filter
The advanced filter is a filter method using another criteria
table. This filter method has a little bit more difficulty, but gives
more criteria possibility.
First step of using this method is build your own criteria
table on the same sheet, this figure below gives an idea how.
This small table is created, say, at cell I3:I4 just next to our
data. This criteria table is going to be used to filter any data
where its Kota is Jakarta.
Second step is via the menu bar, Data Filter Advanced→ →
Filter and you'll see something like this.
We're reading filter criteria from I3:I4 and apllies it to our
data. Before going through the menu bar, make sure the data is
blocked. From this dialog box, we can see there are other
options such as copying our filter results to other sheet, remove
duplications and regular expressions. For the use of regular
expressions consult the LibreOffice help or using the DOS
format of wildcards with added dots (.) in front of the regex is
Chapter 2 : Simple Data
Analysis (continued)
Chapter 2 of Data Analysis consists of several methods of
grouping, instead of filtering or sorting data. These methods are
Subtotal
The use of subtotal is to group our data based on its fields
and then calculating other fields from the same table.
Still using our old data, block our table first and go through
Data Subtotal→ and you'll see a dialog box.
The first option, Group by, let's you decide which field will
be grouped. This option in MS Excel requires you to sort the
data first, but in LibreOffice, the sort is auto.
Second option, is calculating another field and it's function.
In this case, we are grouping our data based on DEPT, and we'll
summarize the field GAJI POKOK, that way we'll know which
Pivot Table
Pivot Table is another way of grouping data. Only this time
it's little bit automatic, you'd probably see something of
similarity in MS Excel. Back in OpenOffice.org this used to be
called Data Pilot, and the screenshot used here is from the early
versions of LibreOffice.
First things first, after highlighting your data, go through
Data Pivot Table→ , the dialog box will ask if you'd like create a Pivot Table from your current selection or from a registered
database in LibreOffice. For now let's choose the first option.
After clicking OK, a Pivot Table will appear on a new sheet,
and you'll be given a dialog box.
The Pivot Table dialog box may be confusing at first, but put
it in a sort level way of perspective, it would be less confusing.
First level is the Pages, consider this a first level sort where
you'll be sorting data based on fields, but what you need to
focus first is the column and row fields, this are like the same
level of sort or group in subtotals. Basically the field you drag to
the row fields and column fields will be sorted an grouped by its
respective field. In this example we'll ignore the Page Fields and
group our KOTA field at the row and our DEPT at the column.
Third level is the Data Fields, pretty much like subtotal, this
is where we calculate the field which were grouped at the row
and column level. Just use Sum GAJI POKOK at this field for an
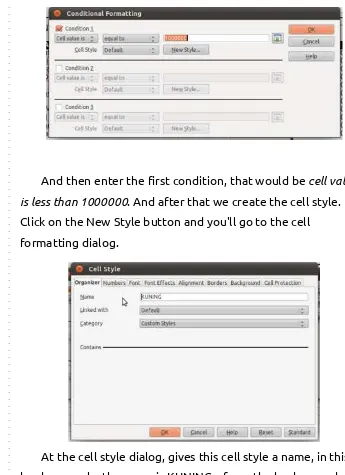
Conditional Formatting
The last method of analyzing data would be the conditional
formatting. Although there are numerous type of Data analysis
method out there, these are the simple ones you can probably
use on a daily basis.
The Conditional Formatting method basically doesn't do
anything to change your data. Be it grouping or changing your
table. Conditional Formatting only formats the cell you
highlighted and gives you easier view on your data. Here's a
simple example.
First of all block only the field which you'd want to apply
conditional formatting, in our example we will change the field
GAJI POKOK to display yellow background when it's less than
Rp. 1.000.000, so block that field first, and go through Format Conditional Formatting
→
And then enter the first condition, that would be cell value
isless than 1000000. And after that we create the cell style.
Click on the New Style button and you'll go to the cell
formatting dialog.
At the cell style dialog, gives this cell style a name, in this
go to the Background tab and select the yellow colour.
When you're done here, click OK, go back to the conditional
formatting dialog and click OK there. You'll see some similar
result.
Exercise
Now try this chapter's exercise using the figure below!
1. Sort the table ascendingly based on the field Asal Kota
and Nama
2. Using standard filter, display the data where the criteria
is Asal Kota from Jakarta and Sisa Pembayaran is equal to
or more than Rp. 500.000
3. Using advanced filter, display the students who took the
class Desain Grafis
4. Create a subtotal based on the field Materi and calculate
the sum for each Total Biaya
5. Create a Pivot Table to compare Total Biaya between the
Chapter 3 : Chart
Charts in LibreOffice Calc is somewhat different than the
ones most people use in their Microsoft product. Having that
said, learning to create charts in LibreOffice -albeit slightly
different, is really not that difficult.
Charts & Graphs are powerfull tools to present your data to
your reader. There are many type of charts provided by
LibreOffice but here, we will try to explain 3 most commonly
used type. Which is :
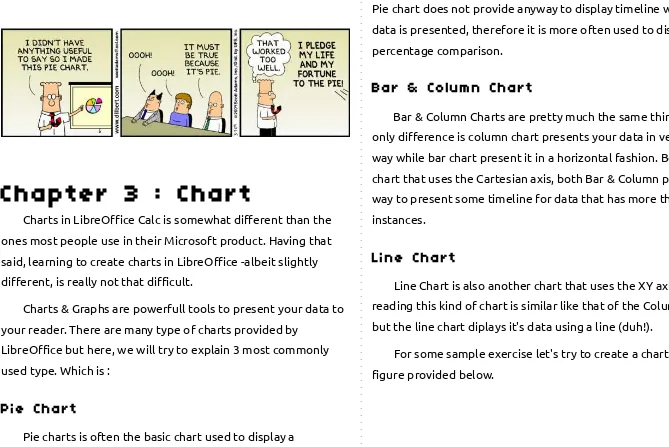
Pie Chart
Pie charts is often the basic chart used to display a
comparison of two or more data. But it has it quirks, often the
Pie chart does not provide anyway to display timeline where the
data is presented, therefore it is more often used to display
percentage comparison.
Bar & Column Chart
Bar & Column Charts are pretty much the same thing, the
only difference is column chart presents your data in vertical
way while bar chart present it in a horizontal fashion. Being a
chart that uses the Cartesian axis, both Bar & Column provide a
way to present some timeline for data that has more than one
instances.
Line Chart
Line Chart is also another chart that uses the XY axis. So
reading this kind of chart is similar like that of the Column chart,
but the line chart diplays it's data using a line (duh!).
For some sample exercise let's try to create a chart from the
First of all, highlight your data. Now these might seem
simple, but when you get to the part where you need to display
specific data on your charts, this could get tricky.
Finish blocking your data? Now display the Chart Wizard
dialog box. This can be done via the toolbar or the menu bar
through Insert Chart. → The first step of the Chart Wizard is to select a chart type, for the sake of simplicity, we will try the
column chart first. Click OK and continue to step 2.
Selecting Data Range makes a big difference to how your
chart look, reading data series in rows or in columns is what
makes it so. If you set reading your data series in column, the X
axis will read as data series and display your data from left to
right, while reading in rows will make your X axis display its data
from top to bottom. Try to switch between the two and
understand and get the hang of it before going to step 3.
Editing the Data Series is used to edit the data (instead of
the look) that shows on your chart. This is often used to improve
data reading, for example you can take out the Motor Data
Series and display only the comparison between the Canoes and
The last step, Chart Element is to edit the look and feel of
your data. Here you can add chart titles, legends, and add some
more names for the X and Y axis.
The steps of creating charts for Pie Chart, Bar, and Line is
similar, try to master editing Data Range and Data Series
because that is where usually the need for displaying specific
Exercise
1. A figure is given below :
Using the table above, create two charts that shows where
alumnus went after high school,
a. Column Chart Based on Category (Places as X axis and
legend)
b. Pie Chart Based on Year (Year as X axis and legend)
2. Another Table is given,
Using the table above, create two charts that shows
students attendance,
a. Column chart for January
Chapter 4 : LibreOffice
Impress
Impress is LibreOffice’s slide show (presentations) program.
You can create slides that contain many different elements,
including text, bulleted and numbered lists, tables, charts, clip
art, and a wide range of graphic objects. Impress also includes a
spelling checker, a thesaurus, prepackaged text styles, and
attractive background styles.
(yes, I quoted that from the manual).
The use of slide-creation-and-presentation applications is –
depends on who's statistics you've read – the second most used
application in an Office Suite. Just behind spreadsheets apps.
Impress is one of those, and by the time of this writing, can
actually open a pptx file with 75%+ accuracy.
Other slide-creation application worth mentioning are
slideshare (an online slide application), slide rocket (also online),
and a part of the iWorks productivity suite, Apple Keynote.
Which, of course only runs on Mac OS X.
Workspace View
The Workspace view of Impress is also somewhat similar to
the one in that other OS. There are Slides pane on the left side,
Workspace, which consists of several other views like Normal,
Outline, Notes, Handout, and Slide sorter.
And at the top, we have the usual menu bar. And Drawing
bar at the bottom. Most menus can be accessed via the menu
bar, and the toolbar is there most of the time for your shortcuts
convenience.
The Slides pane on the left is where we navigate through
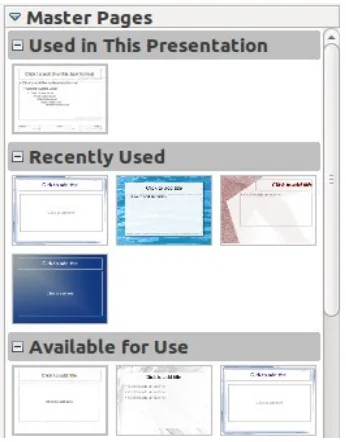
slides most of the time. While the Task pane on the left consists
of ;
1. Master Pages, where the slide's designs resides. This is
where we choose the slide's background and color
themes.
2. Layouts, where user chooses which layout is suitable for
the slide. Be it a blank layout, text only, photo galleries,
and so on.
3. Table Design, obviously to choose from several available
color theme for that table inside that slide. Should there
be any.
4. Custom animation, where most users spend their time on,
is also pretty much like the one in that other OS. But
rather lacking in the interesting animations factor.
5. Slide transition, for choosing the animation and sound
that shows when the slide show is playing.
inserting an element to slides
Adding an element, such as pictures, sounds, and videos, or
tables and charts is pretty straightforward. The Insert menu bar
is there at your disposal. While the chart, hyperlink and other
toolbar is just a shortcut. The Drawing bar at the bottom gives
you a little bit more variations for the elements you're taking
into your presentation.
Try to give into the habit of using the Insert ….→ menu bar,
it is not a shortcut, of course. But it opens up more option when
Master Pages
The Task pane first content is the Master Pages, where you
will be given some choices for the background and themes for
your slides. You can also set your own background picture. Just
right click on the middle of the slide and go Slide Set →
background picture for slide.
Layouts
The second content – choosing layouts, is easy. But choosing
the correct layout for your presentation can be tricky. Would
your audience need comparison charts? Does this slide need
tables? Or just some photos will do. This often gets easier with
practice.
Table Design
Should be self explanatory, but most presenters copy tables
from spreadsheets, Impress just makes it looks better.
Slide Transition
The Slide transition is most often overlooked. But building
up your presentation and timing training can be time
consuming.
Most of the time, the speed of the slide transition doesn't
break a slide. So choose wisely if you want the slide to move at
your pace (On mouse click) or automatically after.
Also keep in mind that in Impress, the sound and music you
played on the previous slide doesn't carry on to the next slide,
you can only have one audio media playing at a times.
Adding a custom animation to an
element.
While most of the other features of a presentation software
is self explanatory, the custom animation usually deserves it's
own section. This is also true for Impress, here's a simple step
for custom animation.
First things first, you need to have an object on your slide
before breathing some life into it. The available objects for
custom animation includes pictures, texts, and custom drawing
objects, and excludes sounds and videos.
For this example, try inserting a text object or a fontwork
gallery.
From there on, select your object and choose custom
animation from the Task pane.
Click add and you will be given a myriad of custom
animations to choose from, starting from entrance, emphasis,
Some properties need mentioning are;
• Start, this differs from on click, with previous, and after previous. On click starts the animation when user click
the mouse button. With previous starts the animation
altogether with the previous object that were given an
animation. While after previous waits for the last object
animation to finish before starting.
• Effect, usually varies from which animation that were chosen; and
• Speed, chooses the speed of the animation.
This concludes the custom animation part.
Tips on creating a presentation using
Impress
Impress is NOT Microsoft PowerPoint. Albeit you can open a
pptx file here, the results won't be the same. Some things worth
mentioning are;
• Gather the resources you have for the presentation in a single folder. Including pictures, sounds, videos, and
fonts. This usually solves the “stuff not showing on
slides” problems.
• Make your point short and clear! Nobody want's to go
through a half an hour presentation as if they have to
read an entire book. NO BODY.
• Don't use text color with too much contrast or less contrast from the background. This is usually comes with
practice, but it's important not to hurt your audiences
eyes.
• Sounds and music – unlike in Power point – doesn't go through slide transition. It stop when you change slide.
who is giving the presentation, not Impress. Going
through an entire photo gallery without any explanation
and you're better off giving your audience handouts
Chapter 6 : GIMP
GIMP (GNU Image Manipulation Program) is an image
retouching and editing tool and is released under the GPLv3
license as free and open-source software. There are versions
tailored for most operating systems including Microsoft
Windows, Mac OS X and Linux.
GIMP has tools used for image retouching and editing,
free-form drawing, resizing, cropping, photo-montages, converting
between different image formats, and more specialised tasks.
Animated images such as GIF and MPEG files can be created
using an animation plugin.
(that one is from Wikipedia).
GIMP (original's name was the GIMP) first released version
was 0.54 back in 1995 as a semester-long project by Spencer
Kimball and Peter Mattis at the University of California,
Berkeley.
By the time this is written, the stable version of GIMP is 2.8.4
under Linux platform.
There are other forked versions of GIMP, one notable is the
GIMPShop, which aim to replicate Adobe Photoshop at some
point.
Getting to know GIMP
GIMP user interface is, well, looks almost exactly like Adobe
Photoshop. Or lots of other raster based application. Although
somewhat different, users who have experience or came from a
design orientation background should have no trouble using
The Toolbox is the where your tools resides. Each tool is
designed to do something to your images and layers. Some of
these will be used a lot more than the others. And for most
situations, there are shortcuts to most of these so you won't
have to click on them all the time. Just below the toolbox
there's a color “swatch”. These represent the current
background and foreground of GIMP. Clicking on them opens up
the color chooser.
Just below the color swatch, lies the Tool Options. This
dialog box changes everytime we choose a different tool. For
example if we select the Paintbrush tool, the Tool Options
The Image Window is where your images appear. And also
where we do the editing. The menu bar in MS Windows appears
at the top. While in Unity Desktop, is integrated with the top
panel. The Image Window provide useful information from
how much we are zooming on the image, image size, etc.
And the last window is the Layer dock, this window is
actually called Dialog Docking, because it has several other
function more than just managing existing layer. There's the
history tab, the channel and also brush and patterns.
Image File Types
Before we actually dive in, there are several important
concept we need to brief. That is “What file type should I save?”.
By default when we start a new project with GIMP, it
automagically saves a project using the XCF format, which is
GIMP's default. But most of the other time, we don't want to
start a new project, we just want to edit existing images. Here's
a few image type you need to know.
1. XCF, as mentioned above, this is GIMP's default file
format. It's file size is quite large, but saves every
layer you need to work with.
Photoshop's default format.
3. JPG/JPEG, stood for Joint Picture Group or Joint
Picture Expert Group is a common image file type used
since late 90's but it has several limitations. It's a
lossy file compression, meaning every time you save
the file, there's always some color information
missing.
4. PNG, now a more popular on the web. PNG has
slightly larger file size than JPG but it doesn't lose
any color information when it's saved. Also PNG
supports tranparency and partial transparency to
make translucent images. So it's a common format we
see in everyday web pages. PNG once stood for
“PNG's not GIF” or “PNG's not JPEG”. But now, most
convention calls it Portable Network Graphic.
5. GIF, Graphic Interchange Format. Supports 8 bit color,
transparency and animation. But it's saving algorithm
makes it a bad choice for full color images.
Simple Photo Retouching
•
Scaling
Scaling is a way to change your image resolution. Most
Digital Cameras today can take pictures at high resolution up to
12 Megapixel. Albeit this method takes beautiful, crisp images.
When you upload them to a website, the loading time for these
images is frustrating. Scaling these images to a lower resolution
could reduce loading time.
Vice versa, if you scale a low-res image to a higher
resolution, the image quality will look really poor.
Scale tool can be accessed via the toolbox. Or from the
menu. The menu Tools Scale provide a dialog box where → →
you can manually choose the resolution, while the toolbox allow
to resize images using the mouse. Also, if you want to keep the
image ratio, use the chain in the dialog box. Similar method
using the mouse is to use Shift+click while resizing your image.
Cropping is an act to cut a part of an image to your liking/need.
The tool GIMP provide is pretty straight forward. Select a part
of the image you want to crop and press enter.
•
Brightness & Contrast
Changing the image brightness and contrast is probably
something we see on TV every other day. in GIMP, this dialog
box can be accessed via menu Color Brightness-Contrast.→
The Brightness and Contrast tool is particularly usefull for low
light photography, and the color menu also provide some other
usefull features such as changing color level, hue, and
saturation.
•
Rotating Images
Rotating Images is also usefull when we didn't hold the camera
at the right angle. The Rotate Tool can be accessed from the
toolbox (if you want to use the mouse) and from the menu
there's the Tools Transform Tool Rotate. You can also rotate→ →
images 90 degree quickly using the menu Image Transform → →
90 degree clock or counterclock wise. This also allow image
flipping.
•
Sharpening & Fixing Red Eyes
Sharpening or blurring images usually comes at the filtering
chapters. But these filters are used so often it deserves a little
preview.
To sharpen an image, we use the menu filter enhance → →
sharpen, while blurring an image, we use the menu filter blur. →
These filter is some of the most common filter people use.
Blurring can also be accessed via the toolbox, while the filter
blur method is used for the entire image, or selection.
The Fix Red Eye is also accessed from the enhance filter. But be
sure to use the selection tool first. If you don't, the red colors in
Getting to know Layers
Layer, be it in Photoshop or GIMP. Are your bread and butter
in image editing. Most beginners tend to avoid using layers at
first try. But using a multitude of layers for image editing can
make things much easier.
Almost every project in GIMP consist of several images
combined called layers. A layer may or may not be transparent.
It can even be translucent!
For example, we have an image where we want to add some
caption, just drop some text layer and your'e done!, or we want
to change someone else's face into a celebrity, just crop some
images and drop them as layer and you'll have a -terrible-
composition of head-to-body picture!
To get the hang of it, let's try some exercise. Below, we have
a couple of images we're going to join.
First up start a new project with a tranparent background.
After that, open up the second image as layer and then the first.
And you'll have something like this on the layer dock.
Here, you have two layer on top of each other. You can scale
the image to your liking, you can also change the layer mode
layer. And your final image should look something like this.
There are quite a few things on the layer dock that you should
try familiarize with, namely
• Tabs. By default this consists of Layers, Channels, Paths, and Undo History.
• Layers List. This is where you see your layer previews, names, visibility toggles and layer linking.
• Layer Button. Performs usual layer tasks such as new
layers, delete layers, and move layers up and down
• Layer Mode & Opacity. The popular layer modes are normal, multiply, and dissolve. The opacity slider dictates
how much transparency the layer has. Now, layer modes
are actually mathematical calculation between the active
layer and the layer just below it. You can see what it does
by selecting differebt layer modes and changing the
opacity slider.
Drawing with GIMP
Raster based graphic apps such as GIMP is usually used to
edit photos, but it does provide an array of drawing tools at
tools available in GIMP, here's a few tips.
1. Always use a new layer to draw new component. Why
do this? Simply because when your image consist of
several editabel components (in this case, layers),
you'd be able to edit your images with ease in the
future.
2. Use a tranparent background, and use a new white
layer to draw. You don't always have to draw on a
white layer, but most people ends up wanting
tranparency for their drawings.
With that out of the way, let's go through some of the basic
drawing tools available.
• Pencil Tool. To draw some hard edge lines, this is the way to go.
• Paintbrush Tool. The main difference between this and the pencil tool is the antialiasing. You can draw fuzzy
edges and smooth lines.
• Airbrush Tool. Always draws fuzzy edges. This one has
some extra tool options that is rate and pressure. The
longer you press the mouse, the more differences it
makes on the canvas. Think of it as using a real airbrush.
• Ink Pen Tool. The most complex drawing tool available, this emulates an old fashioned fountain pen, and is best
used with drawing tablets.
The multiple drawing mode :
• Normal. Is what normal does.
• Dissolve. Adds some random dots to your brush. • Behind. Draws whatever behind the active layer.
• Color Erase. Erases the selected foreground color. The Tool Options :
• Opacity : is self explanatory
• Mode : as explained above
• Scale : makes you brush bigger! - or smaller
• Fade out : makes the line fade out after somewhile
drawing
• Jitter : makes some randomness on your brush, sometimes makes the drawing look natural.
• Incremental : works only when opacity is below 100%. it
makes the brush grow darker as you draw.
the foreground color.
Selection
Selection is the second most used Tools for photo editing,
just after Filters. You might have used the basic selection tools
available in GIMP, the Rectangle and Ellipse selection tool.
The select tool is used to -*duh- select a part of your image.
Here is some similar tool options for the basic select tool.
1. Select Mode includes replace, add, substract and
intersect.
2. Feather Edges disables anti aliasing, so you can have a
fuzzy selection a few pixel more instead of a hard-edged
selection
3. Rounded Corner gives a round corner for the rectangle
selection
4. Expand from center is to select part of your image from
the center
after a selection is done, users may do several other thing to
selected parts such as applying filters, cutting and moving
selection, grow, shrink, or give some fuzzy edges. But most of
the time, the after task is done in the select menu.
Here's some of the sub-menu you'll find in the select menu.
• Select All / None. Is self explained.
• Invert. This one inverts your selection. Changes what you don't select into your selection.
• ByColor. Select the color you choose from the image
• Feather. Gives a fuzzy selection so you won't have to deal with with hard-edged images.
• Shrink / Grow. Is to reduce or grow your selection by the number or pixel you choose.
The basic select tool works like a charm for simple images
with few colors. But with a fuzzy image, you might want to look
at some other advanced selection tool.
• Beezier Path Tool. Or Path Tool named after a French engineer who invented it, is a selection tool which allow
users to give path points. This is particularly usefull when
The Path Tool creates Path first. This Path can be saved as
selection when needed.
• Intelligent Scissor Tool. Works just like Path tool, but it tries to follow similar foreground color.
• Foreground Select Tool. This select tool works by selecting similar foreground color with three steps.
◦ Step one, after selecting the foreground select tool, select the area between the object you want to select
and the background
◦ After that release the mouse button and the general
area will be highlighted, second step is to draw along
the object you want to extract, but be carefull not to
touch the area you don't want.
◦ When you finished, hit enter key and the object will be
masked and turned into a selection.
mask. You can find quick mask in the left corner of the image
window.
Here's a simple way to use quick mask;
1. First, draw a rough selection of your image. And then
activate quick mask.
2. After quick mask had been activated, the unselected area
will turn into red. At this point, use the paintbrush and
draw along the object to add selection precision.
3. Turn off Quick Mask and see result.
Filters
GIMP has tons of tools at your disposal. The easiest of them
all is probably the Filters. This feature resides in the menu
Filters and using them is a easy as applying one to your image.
Albeit it seems easy, the desired results often doesn't always
reach the users needs. This is where practice comes in.
here, we'll discuss and try some of the most popular filters in
GIMP, usually used for photo retouching.
• Blur
You probably have used the Blur Tool from the toolbox,
the Blur Filter applies the same principle but to the entire
image or selection. Some interesting options are the
Gaussian Blur and Motion Blur. The Motion Blur spreads
• Enhance
The Enhance Filters contains some usefull features
mostly used to correct problems in images. Few of these
worth mentioning are Sharpen, which is used to sharpen
an image, and Antialias, to look for jagged edges and
make them look smoother.
• Distorts
Is a filter dedicated to reshape your layer, as opposed to
correcting it. It contains many types of filters, including
Emboss.
Iwarp, Swirl, & Ripple help reshape your layer to many
forms, and filters like mosaic gives a glass effect to your
image.
• Light & Shadow
Flares, Light, Sparkles & Supernova gives a light and flare
effects to your images, and Shadows - like we have tried
previously – gives a drop shadow to a layer. This is mostly
used for text layers.
Last one in the Light & Shadows is also Lens & Glass
Effects which gives the illusion of a translucent objects.
• Noise Filters
The Noise Filters gives a noise effect to an image or
more often than not, giving a noise effect to a photo
makes it better, and looks like the photo was taken by
professionals.he
• Artistic Filters
The Artistic Filters gives an image the impression of
being made out of an oil painting. There are tons of
different filters inside this category to explore, but the
most interesting is probably the GIMPressionist.
Exercise
The exercises for this chapter can be found at the writers
Dropbox site at :
https://www.dropbox.com/sh/2mghlsusctz4o8n/67JvBdV0r
Chapter 7 : HTML & CSS
History of HTML & CSS
HTML (Hypertext Markup Language) is a markup language
created to diplay web pages and other information that can be
displayed in a web browser.
HTML is written in the form of HTML Elements usually
consisting of tags enclosed in angle brackets “< />” and most
commonly comes in a pair. The first tag is the opening tag and
then followed by a closing tag.
The Web Browsers job is to translate this tags and compose
them to a readable web pages. HTML tags also allows images
and objects to be embedded.
HTML was first proposed & prototyped by Tim Berners-Lee
at CERN (European Organization for Nuclear Research) to use
and share research documents. Berners-Lee specified and wrote
HTML and its parser (a browser) in 1990.
The currently widely used version HTML is 4.1, while HTML 5
is beginning to spread all over the internet. Most of the modern
web browsers available can now translate HTML 5.
CSS (Cascading Style Sheet) is a style sheet language used
for describing looks and formatting of an element written in
markup languages such as HTML. It is mostly used in adjacent to
HTML markups.
CSS initial release was December 17th 1996, and developed
by the World Wide Web Consortium. It is primarily designed to
enable the separation of document content with document
presentation.
First HTML Page
HTML is written in text editors, saved as text file with the
.html extension, and translated by web browsers.
You can have any text editor you want. The Ubuntu's default
text editor, Gedit, can handle Syntax Highlighting in HTML & CSS
and Bluefish. For most people using Microsoft Windows
Platform, Notepad++ is widely used.
Now let's try to create our first html page. Save this page as
latihan-1.html.
<h1>Document HTML yang Pertama</h1>
</p>
</body>
</html>
Now, after you saved it. And open it in a web browser. It
would probably look like a normal HTML page, now let's try
adding some CSS into it.
Next, open up another new file and write this down.
body {background:orange;
}
Now saved it as latihan-1.css and then fire up your browser. It
would probably look something like this.
Okay, here's a brief explanation for the HTML page.
First of all, The <html> and it's closing tag </html> marks the
document as a html page. Everything written between this tag
is translated by a browser to a html page.
The second part is the <head> </head> tags. This is the head
of the html element. Most of the time, programmers put CSS
links here, more on this later. But take a look at the <title> tag.
Everything written in this tag is displayed on the browsers
windows title.
The third and largest is the <body> tags. This is where your
pages are. Everything written here will be displayed as a web
number 1. and everything in Heading 1 is written in large fonts.
While the <p> tags marks it as a paragraph.
Now the CSS part. There are actually 3 kinds of way to insert
a CSS to a html page, but we're just going to discuss just one,
using the <link> tag.
Watch carefully at latihan-1.html line 3. this is where we
insert the link to a CSS file named latihan-1.css. The <link> tag
also has some other arguments like rel=”stylesheet” and
type=”text/css” and href. Marking the linked file as text/css as a
stylesheet.
HTML tags
Try Familiarize yourself with some of these HTML Tags as
practice.
• <a> : hyperlink
• <br> : break return (serves as new line)
• <h1> to <h6> : marks a heading 1 to heading 6
• <p> : paragraph
• <form> : marks a form area to submit data
• <button> : a clickable button
• <img> : marks an image
• <table> : defines a table
• <ul> & <ol> : defines an ordered and an unordered list.
• <div> : marks a section in the document.
CSS descriptor
CSS as we have seen in the file latihan-1.css defines the
presentation of the document. In this case we select the
background of the document an changes it's color to orange.
What CSS is basically doing is to select an element, and then
change it's appearance. For example, here's another CSS file
h1 {font-family:ubuntu;
}
h2 {color:white;
}
Now, if you add this to your last CSS file, It will select the
heading 1 and heading 2 element and changes it's font family
and font color.
Now for a bit of exercise, try adding some HTML elements
#upperroman {list-style-type:upper-roman;}
#loweralpha {list-style-type:lower-alpha;}
#decimal {list-style-type:decimal;}
#lingkaran {list-style-type:circle;}
#kotak {list-style-type:square;}
Note that this CSS styles are for ordered & Unordered lists.
table,th,td { border:2px solid black;
border-collapse:collapse;
margin:2px;
padding:5px;
}
And these CSS stylesheets are for HTML elements <table>.
Tables
Tables in HTML is old school. Most designers moved to <div>
tags for more flexibility. But still there's just no getting away
completely from them. It's still a topic that spurs endless debate
in internet message boards to this day. And another reason to
learn how to use them. Here's an example of a table tags in
</table>
The code above creates a table by definition, and adds 3
rows and three columns. For if you haven't tested it, the
additional tags are.
• <tr> stands for table row. This tags represents a row in a table in which you add some cell
• <td> this tags marks the smallest element in a table. Or if
in a spreadsheet, you call them cells.
• There are a few additional tags in tables such as <th> or the new <thead> and also <tbody>.
Forms
Forms, during the early ages of the internet, is the only way
to communicate between the client and the server. It is what
separates static website and dynamic ones.
Although these days websites uses many kinds of user
interactions, the form tags persists. It's still among the primary
ways to send data to servers.
Now, the scope of HTML in this book doesn't cover server
side scripting, but it's still important to know some of the basic
tags used to create a form.
A form tags usually involves inputting some texts, some
radio buttons, drop down lists, etc. and followed by a submit
buttons.
<form>
First name: <input type="text" name="firstname"><br>
Last name: <input type="text" name="lastname">
</form>
The basic form to input names.
And also several other kinds of input form, such as radio
buttons, and checkboxes
<form name="input" action="html_form_action.asp"
method="get">
<input type="radio" name="sex" value="male">Male<br>
<input type="radio" name="sex" value="female">Female
<input type="checkbox" name="vehicle" value="Bike">I have a
bike<br>
</form>
Exercise
The Exercises for this chapter is available at the writer's
Dropbox Sites :
Chapter 8 : Bkchem &
Chemical Calculator
The Ubuntu Software Center / Repository as of this writing,
has literally over thousands of application available for free and
download. While quite a number of them has some use for a
would be chem analyst, there won't be enough time to cover
every single one of them. So instead we will cover some of the
most popular ones, being Kalzium, Chemical Calculator, &
BKChem. Well, maybe not Kalzium as it's only a digitalized
periodic table.
Note that the Chemical Calculator can be installed in Ubuntu
using this command :
sudo apt-get install chemtool
and the calculator also comes with several handy tools like
the chemtool and the periodic table viewer.
Chemical Calculator
This certain application is the easiest one yet. You will only
have to input a certain chemical structure and then you'll get it's
written formula, raw formula, molecular weight, Elements, and
its mass.
For example we're entering H2SO4 here :
And that's it. This might come handy in the future, so make it
a reference. There are tons of other scientific tools you can try
BKChem
To install Bkchem in Ubuntu, simply search for it at the
Ubuntu Software Center, or type this into the terminal.
Sudo apt-get install bkchem
after you're finished installing, fire it up and you'll see the
workspace windows.
Drawing a chemical structure in BKChem is fairly easy due to
an already premade templates.
Some key points we need to look at are these :
• Edit and Compound lines
The first 2 tool box represents drawing line compounds
and editing them, make some notes that there are single,
double lines, and so on. The edit tool makes it so that the
object you draw can be moved, or edited.
• Templates
The template tool & its options consist of premade
templates such as benzene, cyclopentadiene, and other
cyclohexane for easy drawing.
• Atom Mode
This is where you conjure your compound. To write some
chem structure like CO, H, etc. simply click Atom Mode
and then click at the end of the line you were drawing.
You will go to text editing mode to input your chem
• Other menus and tools you need to try are Text tool, Rotate, and Transformation. The tools name are probably
self explanatory.
Saving your work
BKChem by default saves your work in SVG format. (Scalable
Vector Graphics). This format allows you to re edit your work in
vector based design applications.
The steps below will guide you to use GIMP to convert your
work to PNG format, which you will probably need later to
insert your work to word processors.
1. First things first save your work via the menu file save. →
This automagically gives your file name a *.svg extension.
But don't forget to choose your save folder! You might
not remember them later.
2. Second step fire up GIMP, and open your file. At first your
image will seem huge, but there's a way to crop this, go
to menu Image Autocrop Image. Your image will be →
cropped to minimum size, taking less disk space. At this
point you might want to resize your image to your need.
3. Finally choose save as from the GIMP menu and give the
filename a *.png extension. This will save your image in
PNG format for later use.
Exercise
Let's try some of these simple drawing exercise and then
Bibliography
Refsnes Data, HTML Tutorial, www.w3schools.com : Refsnes
Data, 1999-2013.
Peck, Akkana, Beginning GIMP From Novice to Professional
Second Edition : aPress, 2008
The Document Foundation, Getting Started LibreOffice 3.5 :