Indonesia
Demographic and
Indonesia Demographic
and Health Survey
2012
Statistics Indonesia
National Population and Family Planning Board
Ministry of Health
MEASURE DHS
ICF International
The 2012 Indonesia Demographic and Health Survey (IDHS) was carried out by Statistics Indonesia (Badan Pusat
Statistik—BPS) in collaboration with the National Population and Family Planning Board (BKKBN) and the
Ministry of Health (MOH). Funding for the local costs of the survey was provided by the Government of Indonesia.
ICF International provided technical assistance under the auspices of the Demographic and Health Surveys
(MEASURE DHS) program, which is funded by the U.S. Agency for International Development (USAID).
Additional information about the survey may be obtained from the Directorate for Population and Labor Force
Statistics, BPS, Jalan Dr. Sutomo No. 6-8, Jakarta 10710, Indonesia (Telephone/fax 345-6285, e-mail:
[email protected]), or BKKBN, Jalan Permata 1, Halim Perdanakusumah, Jakarta 13650, Indonesia
(Telephone/fax 800-8557, email: [email protected]), or the Institute for Research and Development, Ministry of
Health, Jalan Percetakan Negara 29, Jakarta 10560, Indonesia (Telephone 426-1088, fax 424-3935, email:
[email protected]).
Additional information about the DHS program may be obtained by contacting: MEASURE DHS, ICF
International, 11785 Beltsville Drive, Suite 300, Calverton, MD 20705, USA (Telephone 572-0200; Fax
301-572-0999; E-mail: [email protected]; Internet: www.measuredhs.com).
Recommended citation:
CONTENTS
TABLES AND FIGURES ... vii
PREFACE (BPS) ... xv
PREFACE (BKKBN) ... xvii
PREFACE (MOH) ... xix
MILLENNIUM DEVELOPMENT GOAL INDICATORS ... xxi
MAP OF INDONESIA ... xxii
1 INTRODUCTION ... 1
1.1
Geography, History, and Economy ... 1
1.2 Population ... 2
1.3
Population and Family Planning Policies and Programs ... 3
1.4 Health
Priorities and Programs ... 3
1.5 Objectives
of the Survey ... 4
1.6
Organization of the Survey ... 5
1.7 Questionnaires ... 5
1.8 Pretest,
Training, and Fieldwork ... 6
1.8.1 Pretest ... 6
1.8.2 Training ... 7
1.8.3 Fieldwork
... 7
1.9 Data
Processing ... 7
1.10 Response rates ... 7
2 HOUSING
CHARACTERISTICS
AND HOUSEHOLD POPULATION ... 9
2.1 Housing
Characteristics ... 9
2.1.1 Drinking
Water
... 9
2.1.2 Household
Sanitation Facilities ... 11
2.1.3 Housing
Characteristics ... 12
2.2. Household
Possessions
... 14
2.3 Wealth Index ... 15
2.4 Hand
Washing ... 16
2.5 Household
Population by Age and Sex ... 17
2.6 Household
Composition
... 19
2.7 Birth
Registration ... 19
2.8 Education
of
Household Population ... 20
3 CHARACTERISTICS
OF RESPONDENTS ... 23
3.1 Characteristic
of
Survey Respondents ... 23
3.2 Educational
Attainment ... 24
3.3 Literacy ... 26
3.4 Exposure
to Mass Media ... 28
3.5 Employment
... 29
3.5.1 Employment
status
... 29
3.5.2 Occupation ... 32
3.5.3 Type
of
employment
... 34
3.6 Health
Insurance
Coverage
... 35
4
MARRIAGE AND SEXUAL ACTIVITY ... 41
4.1 Current
Marital Status ... 41
4.2 Polygyny
... 42
4.3 Median
Age
at
First Marriage ... 43
4.4
Age at First Sexual Intercourse ... 45
4.5
Median Age at First Sexual Intercourse ... 46
4.6 Recent
Sexual Activity ... 47
5 FERTILITY ... 49
5.1
Assessment of the 2012 IDHS Fertility Data ... 49
5.2 Fertility
Levels
and Differentials ... 50
5.2.1 Fertility Levels ... 50
5.2.2
Differentials in Current and Completed Fertility ... 51
5.3 Fertility
Trends ... 53
5.3.1 Evidence
from
Retrospective Data ... 53
5.3.2
Evidence from Comparisons with Previous IDHS Surveys ... 53
5.4 Children
Ever
Born and Living ... 54
5.5 Birth
Intervals ... 55
5.6 Postpartum
Amenorrhea, Abstinence, and Insusceptibility ... 57
5.7 Menopause
... 59
5.8
Age at First Birth ... 59
5.9 Teenage
Pregnancy and Motherhood ... 60
6 FERTILITY
PREFERENCES ... 63
6.1
Desire for Additional Children ... 64
6.2 Ideal
Family Size ... 67
6.3 Planned
Fertility ... 69
6.4 Wanted
Fertility Rates ... 71
7 FAMILY
PLANNING
... 73
7.1 Knowledge
of
Family Planning ... 73
7.1.1
Knowledge of Contraceptive Methods ... 73
7.1.2 Knowledge
of
Fertile Period ... 75
7.1.3
Exposure to Family Planning IEC ... 76
7.1.4
Contact of Nonusers with Fieldworkers/Health Providers about Family Planning ... 79
7.2
Current Use of Family Planning ... 80
7.2.1
Current Use of Contraception by Age ... 80
7.2.2
Current Use of Contraception by Background Characteristics ... 81
7.2.3
Trends in Contraception by Background Characteristics ... 83
7.2.4
Timing of Sterilization ... 85
7.2.5 Source
of Methods ... 85
7.2.6 Informed
Choice
... 86
7.2.7 Pill
Use
Compliance ... 88
7.2.8 Quality
of
Use of Injectables ... 89
7.2.9 Problems
with Current Method ... 90
7.2.10 Cost of Contraceptive Use ... 91
7.3
Nonuse and Intention to Use Family Planning ... 92
7.3.1 Discontinuation Rates ... 92
7.3.2
Reason for Discontinuation of Contraceptive Use ... 93
7.3.3
Need for Family Planning Services ... 94
7.3.4 Intention
to
Use in the Future ... 97
8
INFANT AND CHILD MORTALITY ... 99
8.1 Assessment
of
Data Quality ... 100
8.2
Levels and Trends in Infant and Child Mortality ... 101
8.3 Socioeconomic
Differentials
in
Infant and Child Mortality ... 104
8.4 Demographic
Differentials
in
Infant and Child Mortality ... 105
8.5 Perinatal
Mortality ... 106
8.6 High-risk
Fertility Behavior ... 108
9 REPRODUCTIVE HEALTH ... 111
9.1 Antenatal Care ... 112
9.1.1 Antenatal Care ... 112
9.1.2
Number of Antenatal Care Visits and Timing of First Visit ... 113
9.1.3
Components of Antenatal Care ... 114
9.1.4 Tetanus
Toxoid
Injections
...
115
9.1.5 Complications
of
Pregnancy
...
117
9.2 Delivery Care ... 118
9.2.1 Place
of Delivery ... 118
9.2.2 Assistance
during Delivery ... 120
9.2.3 Preparation for Delivery ... 122
9.2.4 Complications
during Delivery ... 123
9.3 Postnatal Care ... 124
9.3.1
Timing of First Postnatal Checkup for the Mother ... 124
9.3.2
Provider of First Postnatal Checkup for the Mother ... 125
9.3.3
Timing of First Postnatal Checkup for the Newborn ... 126
9.3.4
Provider of First Postnatal Checkup for the Newborn ... 127
9.4
Problems in Accessing Health Care ... 128
10 CHILD
HEALTH
... 131
10.1 Child’s
Size at Birth ... 131
10.2 Immunization of Children ... 133
10.2.1 Immunization
Coverage for Children age 12-23 Months ... 134
10.3 Childhood
Illness and Treatment ... 139
10.3.1 Acute
Respiratory Infection (ARI) ... 140
10.3.2 Fever
... 141
10.3.3 Diarrhea ... 142
10.4 Disposal of Stools ... 148
11 INFANT
FEEDING
... 151
11.1 Initial
Breastfeeding ... 151
11.2 Age
Patterns
of Breastfeeding ... 153
11.3
Duration and Frequency of Breastfeeding ... 155
11.4 Types
of
Complementary Foods ... 156
11.5
Infant and Young Child Feeding Practices ... 158
11.6 Micronutrient
Intake Among Children ... 160
11.7 Micronutrient
Intake Among Mothers ... 162
12
HIV- AND AIDS-RELATED KNOWLEDGE, ATTITUDES, AND BEHAVIOR ... 165
12.1
Knowledge of HIV-AIDS and Transmission and Prevention Methods ... 166
12.1.1 Knowledge of HIV-AIDS ... 166
12.1.2 Knowledge of HIV Prevention Methods ... 168
12.1.3 Comprehensive
Knowledge about AIDS ... 169
12.2 Accepting
Attitudes
toward those Living with HIV and AIDS and Attitudes toward
Negotiating Safer Sexual Relations with Husband ... 172
12.2.1 Accepting Attitudes toward Those Living with HIV and AIDS ... 172
12.2.2 Attitudes toward Negotiating Safer Sexual Relations with Husband... 174
12.3
Payment for Sexual Intercourse and Condom Use at Last Paid Sexual Intercourse ... 175
12.4
Self-Reporting of Sexually Transmitted Infections (STIs) and STI Symptoms ... 176
12.5
Prevalence of Medical Injections ... 177
12.6
Comprehensive Knowledge about AIDS and Source of Condoms among Youth ... 179
12.7
Age at First Sexual Intercourse among Young People ... 180
12.8 Source
of
Information on HIV-AIDS ... 181
13
WOMEN’S EMPOWERMENT AND DEMOGRAPHIC AND HEALTH OUTCOMES ... 185
13.1
Employment and Cash Earnings of Currently Married Women And Men ... 185
13.2 Control
over
Earnings
... 186
13.2.1 Control over and Relative Magnitude of Women’s Earnings ... 186
13.2.2 Control
over
Men’s Earnings ... 187
13.2.3 Women’s Control over Their Own Earnings and over Those of Their Husbands ... 188
13.3
Women’s and Men’s Ownership of Assets ... 189
13.4 Participation
in Decision Making ... 191
13.5 Attitude
Toward Wife Beating ... 195
13.6
Indicators of Women’s Empowerment ... 197
13.7 Women’s
Empowerment
and Health Indicators ... 198
14
FATHER’S PARTICIPATION IN FAMILY HEALTH CARE ... 201
14.1 Antenatal Care ... 201
14.2 Preparation for Delivery ... 203
14.3 Contact
with
Health Provider ... 204
14.4 Diarrhea
Treatment ... 205
14.5
Knowledge about Children’s Immunization ... 206
15
ADULT AND MATERNAL MORTALITY ... 209
15.1 Data
... 209
15.2 Direct
Estimates
of Adult Mortality ... 211
15.3
Estimates of Maternal Mortality ... 212
15.4
Trends in Maternal Mortality ... 213
REFERENCES ... 217
APPENDIX A PROVINCIAL TABLES ... 221
APPENDIX B SURVEY DESIGN ... 315
APPENDIX C SAMPLING ERRORS ... 325
APPENDIX D DATA QUALITY TABLES ... 365
APPENDIX E PERSONS INVOLVED IN THE 2012 INDONESIA DEMOGRAPHIC AND
HEALTH SURVEY ... 371
TABLES AND FIGURES
1 INTRODUCTION ... 1
Table 1.1
Basic demographic indicators ... 2
Table 1.2
Results of the household and individual interviews ... 8
2 HOUSING
CHARACTERISTICS
AND HOUSEHOLD POPULATION ... 9
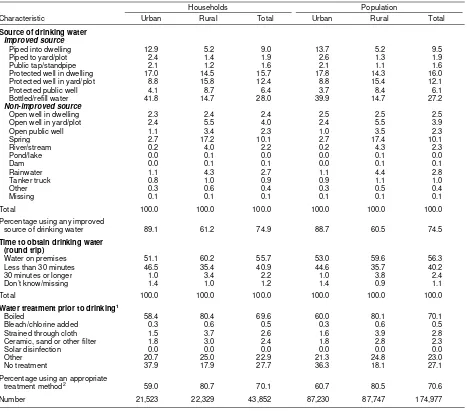
Table 2.1
Household drinking water ... 10
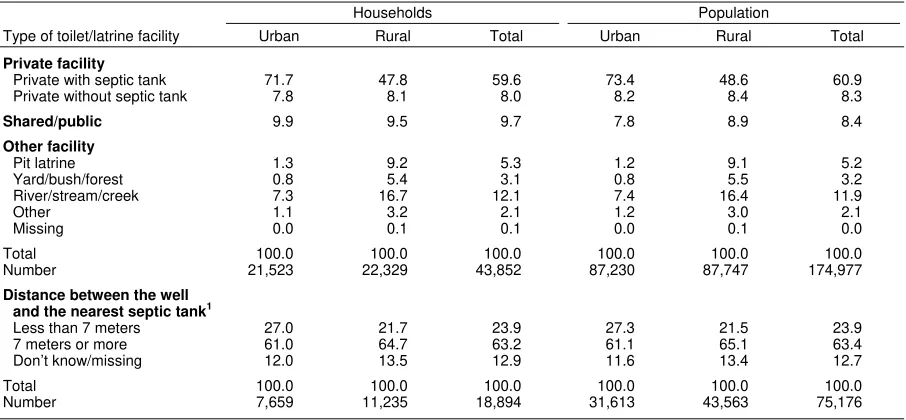
Table 2.2
Household sanitation facilities ... 12
Table 2.3
Household characteristics ... 13
Table 2.4
Household possessions ... 14
Table 2.5
Wealth quintiles ... 16
Table 2.6
Hand washing ... 17
Table 2.7
Household population by age, sex, and residence... 18
Table 2.8
Household composition ... 19
Table 2.9
Birth registration of children under age 5 ... 20
Table 2.10.1
Educational attainment of the female household population ... 21
Table 2.10.2
Educational attainment of the male household population ... 21
Figure 2.1
Population pyramid of Indonesia ... 18
Figure 2.2
Age-specific attendance rates of the de facto population age 5-24 ... 22
3 CHARACTERISTICS
OF RESPONDENTS ... 23
Table 3.1
Background characteristics of respondents ... 24
Table 3.2.1
Educational attainment: Women ... 25
Table 3.2.2
Educational attainment: Men ... 26
Table 3.3.1
Literacy: Women ... 27
Table 3.3.2
Literacy: Men ... 27
Table 3.4.1
Exposure to mass media: Women ... 28
Table 3.4.2
Exposure to mass media: Men ... 29
Table 3.5.1
Employment status: Women ... 30
Table 3.5.2
Employment status: Men ... 32
Table 3.6.1
Occupation: Women ... 33
Table 3.6.2
Occupation: Men ... 34
Table 3.7
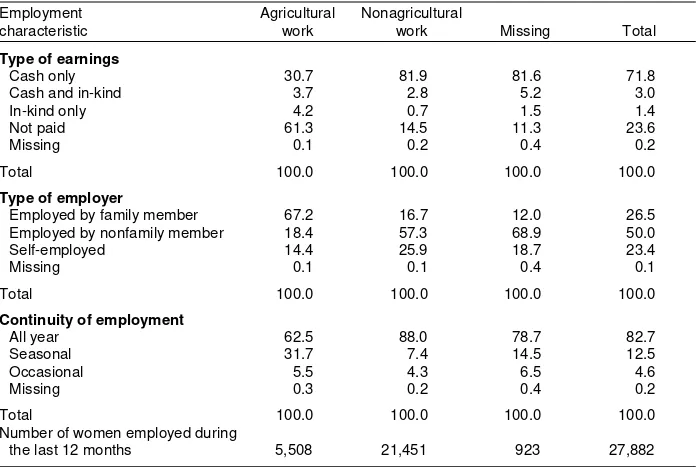
Type of employment: Women ... 35
Table 3.8.1
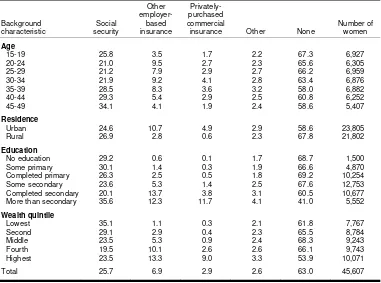
Health insurance coverage: Women ... 36
Table 3.8.2
Health insurance coverage: Men ... 37
Table 3.9.1
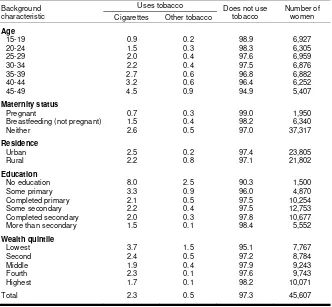
Use of tobacco: Women ... 38
Table 3.9.2
Use of tobacco: Men ... 39
Figure 3.1
Women’s employment status in the past 12 months ... 31
4
MARRIAGE AND SEXUAL ACTIVITY ... 41
Table 4.1
Current marital status ... 42
Table 4.2
Number of men's wives ... 42
Table 4.3
Median age at first marriage by background characteristics ... 43
Table 4.4
Age at first sexual intercourse ... 45
Table 4.5
Median age at first sexual intercourse by background characteristics ... 46
Table 4.6
Recent sexual activity: Women ... 48
5 FERTILITY ... 49
Table 5.1
Current fertility ... 50
Table 5.2
Fertility by background characteristics ... 52
Table 5.3
Trends in age-specific fertility rates ... 53
Table 5.4
Trends in current fertility rates ... 54
Table 5.5
Children ever born and living ... 55
Table 5.6
Birth intervals ... 56
Table 5.7
Postpartum amenorrhea, abstinence and insusceptibility ... 57
Table 5.8
Median duration of amenorrhea, postpartum abstinence, and postpartum
insusceptibility ... 59
Table 5.9
Menopause ... 59
Table 5.10
Age at first birth ... 60
Table 5.11
Median age at first birth ... 60
Table 5.12
Teenage pregnancy and motherhood ... 61
Figure 5.1
Age-specific fertility rates by residence ... 51
Figure 5.2
Trend in total fertility rate, 1991-2012 ... 54
Figure 5.3
Percentage amenorrheic and abstaining by months since birth ... 58
6 FERTILITY
PREFERENCES ... 63
Table 6.1
Fertility preferences by number of living children ... 64
Table 6.2.1
Desire to limit childbearing: Women ... 66
Table 6.2.2
Desire to limit childbearing: Men ... 66
Table 6.3
Ideal number of children by number of living children ... 68
Table 6.4
Mean ideal number of children ... 69
Table 6.5
Fertility planning status ... 70
Table 6.6
Wanted fertility rates ... 71
Figure 6.1
Desire for another child ... 65
7 FAMILY
PLANNING
... 73
Table 7.1
Knowledge of contraceptive methods ... 74
Table 7.2
Knowledge of contraceptive methods by background characteristics ... 75
Table 7.3
Knowledge of fertile period ... 75
Table 7.4.1
Exposure to family planning messages through mass media: currently married
women ... 77
Table 7.4.2
Exposure to family planning messages through mass media: men ... 77
Table 7.5
Exposure to family planning messages through personal contact ... 78
Table 7.6
Contact of nonusers with fieldworkers/health providers about family planning ... 79
Table 7.7.1
Current use of contraception by age: Women ... 80
Table 7.7.2
Current use of contraception by age: Men ... 81
Table 7.8.1
Current use of contraception by background characteristics: All women ... 82
Table 7.8.2
Current use of contraception by background characteristics: Currently married
women ... 82
Table 7.9
Trends in use of specific contraceptive methods, Indonesia 1991-2012 ... 84
Table 7.10
Timing of sterilization ... 85
Table 7.11
Source of modern contraception methods ... 86
Table 7.12
Informed choice ... 87
Table 7.13
Pill use compliance ... 89
Table 7.14
Use of injectables ... 90
Table 7.16
Payment for contraceptive methods and services ... 91
Table 7.17
Mean cost of contraceptive methods and services ... 92
Table 7.18
Twelve-month contraceptive discontinuation rates ... 93
Table 7.19
Reasons for discontinuation ... 93
Table 7.20
Need and demand for family planning among currently married women ... 95
Table 7.21
Unmet need, current use, and demand for family planning, Indonesia 1991-2012 ... 96
Table 7.22
Future use of contraception ... 97
Table 7.23
Reason for not intending to use contraception in the future ... 98
Figure 7.1
Trends in contraceptive use among currently married women, 1991-2012 ... 84
Figure 7.2
Trends in unmet need, 1991-2012 ... 97
8
INFANT AND CHILD MORTALITY ... 99
Table 8.1
Early childhood mortality rates ... 102
Table 8.2
Trends in early childhood mortality ... 102
Table 8.3
Early childhood mortality rates by socioeconomic characteristics ... 105
Table 8.4
Early childhood mortality rates by demographic characteristics ... 106
Table 8.5
Perinatal mortality ... 107
Table 8.6
High-risk fertility behavior ... 108
Figure 8.1
Reported age at death in months ... 101
Figure 8.2
Trend in neonatal, infant, and under-5 mortality, IDHS 1991-2012 ... 103
Figure 8.3
Trend in infant mortality rate, selected sources, Indonesia 1971-2012 ... 104
9 REPRODUCTIVE HEALTH ... 111
Table 9.1
Antenatal care ... 112
Table 9.2
Number of antenatal care visits and timing of first visit ... 113
Table 9.3
Components of antenatal care ... 115
Table 9.4
Tetanus toxoid injections ... 116
Table 9.5
Complications during pregnancy ... 117
Table 9.6
Place of delivery ... 119
Table 9.7
Assistance during delivery: the most qualified person ... 121
Table 9.8
Assistance during delivery: the least qualified person ... 122
Table 9.9
Preparation for delivery ... 123
Table 9.10
Complications during delivery ... 124
Table 9.11
Timing of first postnatal checkup ... 125
Table 9.12
Type of provider of first postnatal checkup for the mother ... 126
Table 9.13
Timing of first postnatal checkup for the newborn ... 127
Table 9.14
Type of provider of first postnatal checkup for the newborn ... 128
Table 9.15
Problems in accessing health care ... 129
Figure 9.1
Trend in timing of first ANC visit ... 114
Figure 9.2
Actions taken in response to pregnancy complications ... 118
Figure 9.3
Trend in percentage of births delivered in a health facility and at home ... 120
10 CHILD
HEALTH
... 131
Table 10.1
Child’s weight and size at birth ... 132
Table 10.2
Vaccinations by source of information ... 135
Table 10.3
Vaccinations by background characteristics ... 137
Table 10.4
Prevalence and treatment of symptoms of ARI ... 140
Table 10.6
Prevalence of diarrhea ... 143
Table 10.7
Knowledge of ORS packets or pre-packaged liquids ... 144
Table 10.8
Diarrhea treatment ... 146
Table 10.9
Feeding practices during diarrhea ... 147
Table 10.10
Disposal of children’s stools ... 149
Figure 10.1
Birth weight and birth size by mother’s education ... 133
Figure 10.2
Vaccination by 12 months of age (based on health cards and mother’s reports) ... 135
Figure 10.3
Trends in immunization coverage excluding hepatitis B ... 139
Figure 10.4
Trends in knowledge and use of ORS packets for treatment of children with
diarrhea, 1997-2012 ... 144
Figure 10.5
Trends in feeding practices during diarrhea, 1997, 2002-2003, 2007, and 2012 IDHS .. 148
11 INFANT
FEEDING
... 151
Table 11.1
Initial breastfeeding ... 152
Table 11.2
Breastfeeding status by age ... 154
Table 11.3
Median duration of breastfeeding ... 156
Table 11.4
Foods and liquids consumed by children in the day or night preceding the interview ... 157
Table 11.5
Infant and young child feeding (IYCF) practices ... 159
Table 11.6
Micronutrient intake among children ... 161
Table 11.7
Micronutrient intake among mothers ... 163
Figure 11.1
Infant feeding practices by age ... 154
Figure 11.2
IYCF indicators on breastfeeding status ... 155
Figure 11.3
IYCF indicators on minimum acceptable diet ... 160
12
HIV- AND AIDS-RELATED KNOWLEDGE, ATTITUDES, AND BEHAVIOR ... 165
Table 12.1
Knowledge of AIDS ... 167
Table 12.2
Knowledge of HIV prevention methods ... 168
Table 12.3.1
Comprehensive knowledge about AIDS: Women ... 170
Table 12.3.2
Comprehensive knowledge about AIDS: Currently married men age 15-54... 171
Table 12.4
Knowledge of prevention of mother to child transmission of HIV ... 172
Table 12.5.1
Accepting attitudes toward those living with HIV-AIDS: Women age 15-49 ... 173
Table 12.5.2
Accepting attitudes toward those living with HIV-AIDS: Currently married
men age 15-54... 174
Table 12.6
Attitudes toward negotiating safer sexual relations with husband ... 175
Table 12.7
Payment for sexual intercourse and condom use at last paid sexual intercourse ... 176
Table 12.8
Self-reported prevalence of sexually-transmitted infections (STIs) and STI
symptoms ... 177
Table 12.9
Prevalence of medical injections ... 178
Table 12.10
Comprehensive knowledge about AIDS and of a source of condoms among youth ... 179
Table 12.11
Age at first sexual intercourse among young people ... 180
Table 12.12.1
Source of information on HIV-AIDS: women age 15-49 ... 181
Table 12.12.2
Source of information on HIV-AIDS: Currently married men age 15-54 ... 182
Figure 12.1
Knowledge of AIDS by education level, Indonesia 2012 ... 167
13
WOMEN’S EMPOWERMENT AND DEMOGRAPHIC AND HEALTH OUTCOMES ... 185
Table 13.1
Employment and cash earnings of currently married women and men ... 186
Table 13.2.1
Control over women’s cash earnings and relative magnitude of women’s
cash earnings: Women ... 187
Table 13.2.2
Control over men’s cash earnings ... 188
Table 13.3
Women’s control over their own earnings and over those of their husbands ... 189
Table 13.4.1
Ownership of assets: Women ... 190
Table 13.4.2
Ownership of assets: Men ... 191
Table 13.5
Participation in decision making ... 192
Table 13.6.1
Women’s participation in decision making by background characteristics ... 193
Table 13.6.2
Men’s participation in decision making by background characteristics ... 194
Table 13.7.1
Attitude toward wife beating: Women ... 195
Table 13.7.2
Attitude toward wife beating: Men ... 196
Table 13.8
Indicators of women’s empowerment ... 197
Table 13.9
Current use of contraception by women’s empowerment ... 198
Table 13.10
Women’s empowerment and ideal number of children and unmet need for family
planning ... 199
Table 13.11
Reproductive health care by women’s empowerment ... 199
Table 13.12
Early childhood mortality rates by women’s status ... 200
Figure 13.1
Number of decisions in which currently married women participate ... 192
14
FATHER’S PARTICIPATION IN FAMILY HEALTH CARE ... 201
Table 14.1
Care received by mother during pregnancy ... 202
Table 14.2
Preparation for delivery ... 203
Table 14.3
Father's contact with health provider about child’s mother’s health ... 204
Table 14.4
Father’s knowledge about amount to drink for children with diarrhea ... 206
Table 14.5
Father’s report on children’s vaccination... 207
15
ADULT AND MATERNAL MORTALITY ... 209
Table 15.1
Completeness of information on siblings ... 210
Table 15.2
Sibship size and sex ratio of siblings ... 211
Table 15.3
Adult mortality rates ... 211
Table 15.4
Maternal mortality ... 213
Table 15.5
Adult mortality probabilities ... 215
Figure 15.1
Trend in adult mortality rates age 15-49 (per 1,000 population), by sex,
IDHS 1997-2012 ... 212
Figure 15.2
Maternal mortality ratio (MMR) with confidence intervals for the five years
preceding the 2007 IDHS and the 2012 IDHS ... 214
Figure 15.3
Changes in adult female mortality rates and PMDF, IDHS 1994-2012 ... 215
APPENDIX A PROVINCIAL TABLES ... 221
Table A-2.1
Hand washing ... 221
Table A-2.3.1
Educational attainment of the female household population ... 222
Table A-2.3.2
Educational attainment of the male household population ... 223
Table A-3.1
Background characteristics of respondents ... 224
Table A-3.2.1
Educational attainment: Women ... 225
Table A-3.2.2
Educational attainment: Men ... 226
Table A-3.3.1
Literacy: Women ... 227
Table A-3.4.1
Exposure to mass media: Women ... 229
Table A-3.4.2
Exposure to mass media: Men ... 230
Table A-3.5.1
Employment status: Women ... 231
Table A-3.5.2
Employment status: Men ... 232
Table A-3.6.1
Occupation: Women ... 233
Table A-3.6.2
Occupation: Men ... 234
Table A-3.7.1
Health insurance coverage: Women ... 235
Table A-3.7.2
Health insurance coverage: Men ... 236
Table A-3.8.1
Use of tobacco: Women ... 237
Table A-3.8.2
Use of tobacco: Men ... 238
Table A-4.1
Number of men’s wives ... 239
Table A-4.2
Median age at first marriage by province ... 240
Table A-4.3
Median age at first sexual intercourse by province ... 241
Table A-4.4
Recent sexual activity: Women ... 242
Table A-5.1
Fertility by province ... 243
Table A-5.2
Birth intervals ... 244
Table A-5.3
Median duration of amenorrhea, postpartum abstinence and postpartum
insusceptibility ... 245
Table A-5.5
Median age at first birth ... 246
Table A-5.6
Teenage pregnancy and motherhood ... 247
Table A-6.1.1
Desire to limit childbearing: Women ... 248
Table A-6.1.2
Desire to limit childbearing: Men ... 249
Table A-6.2
Mean ideal number of children ... 250
Table A-6.3
Wanted fertility rates ... 251
Table A-7.1
Knowledge of contraceptive methods by province ... 252
Table A-7.2.1
Exposure to family planning messages through mass media:
Currently married women ... 253
Table A-7.2.2
Exposure to family planning messages through mass media: Men ... 254
Table A-7.3
Exposure to family planning messages through personal contact:
Currently married women ... 255
Table A-7.4
Contact of nonusers with fieldworkers/health providers about family planning ... 256
Table A-7.5.1
Current use of contraception by province: All women ... 257
Table A-7.5.2
Current use of contraception by province: Currently married women ... 258
Table A-7.6
Pill use compliance ... 259
Table A-7.7
Use of injectables ... 260
Table A-7.8
Need and demand for family planning among currently married women ... 261
Table A-8.1
Early childhood mortality rates by province ... 262
Table A-8.2
Perinatal mortality ... 263
Table A-9.1
Antenatal care ... 264
Table A-9.2
Components of antenatal care ... 265
Table A-9.3
Tetanus toxoid injections ... 266
Table A-9.4
Place of delivery ... 267
Table A-9.5.1
Assistance during delivery: the most qualified person ... 268
Table A-9.5.2
Assistance during delivery: The least qualified person ... 269
Table A-9.6
Timing of first postnatal checkup ... 270
Table A-9.7
Type of provider of first postnatal checkup for the mother ... 271
Table A-9.8
Timing of first postnatal checkup for the newborn ... 272
Table A-9.9
Type of provider of first postnatal checkup for the newborn ... 273
Table A-9.10
Problems in accessing health care ... 274
Table A-9.11
Complications during pregnancy ... 275
Table A-10.1
Child’s weight and size at birth ... 277
Table A-10.2
Vaccinations by province ... 278
Table A-10.3
Prevalence and treatment of symptoms of ARI ... 279
Table A-10.4
Prevalence and treatment of fever ... 280
Table A-10.5
Prevalence of diarrhea ... 281
Table A-10.6
Diarrhea treatment ... 282
Table A-10.7
Feeding practices during diarrhea ... 283
Table A-10.8
Knowledge of ORS packets or pre-packaged liquids ... 284
Table A-10.9
Disposal of children’s stools ... 285
Table A-11.1
Initial breastfeeding ... 286
Table A-11.2
Median duration of breastfeeding ... 287
Table A-11.3
Infant and young child feeding (IYCF) practices ... 288
Table A-11.4
Micronutrient intake among children ... 289
Table A-11.5
Micronutrient intake among mothers ... 290
Table A-12.1
Knowledge of AIDS ... 291
Table A-12.2
Knowledge of HIV prevention methods ... 292
Table A-12.3.1 Comprehensive knowledge about AIDS: Women ... 293
Table A-12.3.2 Comprehensive knowledge about AIDS: Men ... 294
Table A-12.4
Payment for sexual intercourse and condom use at last paid sexual intercourse ... 295
Table A-12.5
Self-reported prevalence of sexually-transmitted infections (STIs) and STIs
symptoms ... 296
Table A-12.6
Prevalence of medical injections ... 297
Table A-12.7
Comprehensive knowledge about AIDS and of a source of condoms among youth ... 298
Table A-12.8.1 Source of information on HIV/AIDS: Women ... 299
Table A-12.8.2 Source of information on HIV/AIDS: Men ... 300
Table A-13.1.1 Control over women’s cash earnings and relative magnitude of women’s
cash earnings: Women ... 301
Table A-13.1.2 Control over men’s cash earnings ... 302
Table A-13.2.1 Ownership of assets: Women ... 303
Table A-13.2.2 Ownership of assets: Men ... 304
Table A-13.3.1 Women’s participation in decision making ... 305
Table A-13.3.2 Men’s participation in decision making by provinces ... 306
Table A-13.4.1 Attitude toward wife beating: Women ... 307
Table A-13.4.2 Attitude toward wife beating: Men ... 308
Table A-14.1
Care received by mother during pregnancy ... 309
Table A-14.2
Preparation for delivery ... 310
Table A-14.3
Father’s contact with health care provider about wife’s health and pregnancy ... 311
Table A-14.4
Father’s knowledge about amount to drink for children with diarrhea ... 312
Table A-14.5
Father’s report on children’s vaccination... 313
APPENDIX B SURVEY DESIGN ... 315
Table B.1.1
Sample allocation by province ... 316
Table B.1.2
Expected number of respondents by province ... 317
Table B.2.1
Sample implementation: Women ... 318
Table B.2.2
Sample implementation: result of household interview: Women ... 319
Table B.2.3
Sample implementation: result of individual interview: Women ... 320
Table B.3.1
Sample implementation: Men ... 321
Table B.3.2
Sample implementation: result of the household interview: Men ... 322
APPENDIX C SAMPLING ERRORS ... 325
Table C.1
List of indicators for sampling errors, Indonesia DHS 2012 ... 327
Table C.2
Sampling errors: Total sample, Indonesia 2012 ... 328
Table C.3
Sampling errors: Urban sample, Indonesia 2012 ... 329
Table C.4
Sampling errors: Rural sample, Indonesia 2012 ... 330
Table C.5
Sampling errors: Aceh sample, Indonesia 2012 ... 331
Table C.6
Sampling errors: North Sumatera sample, Indonesia 2012 ... 332
Table C.7
Sampling errors: West Sumatera sample, Indonesia 2012 ... 333
Table C.8
Sampling errors: Riau sample, Indonesia 2012 ... 334
Table C.9
Sampling errors: Jambi sample, Indonesia 2012 ... 335
Table C.10
Sampling errors: South Sumatera sample, Indonesia 2012 ... 336
Table C.11
Sampling errors: Bengkulu sample, Indonesia 2012 ... 337
Table C.12
Sampling errors: Lampung sample, Indonesia 2012 ... 338
Table C.13
Sampling errors: Bangka Belitung sample, Indonesia 2012 ... 339
Table C.14
Sampling errors: Riau Islands sample, Indonesia 2012 ... 340
Table C.15
Sampling errors: Jakarta sample, Indonesia 2012 ... 341
Table C.16
Sampling errors: West Java sample, Indonesia 2012 ... 342
Table C.17
Sampling errors: Central Java sample, Indonesia 2012 ... 343
Table C.18
Sampling errors: Yogyakarta sample, Indonesia 2012 ... 344
Table C.19
Sampling errors: East Java sample, Indonesia 2012 ... 345
Table C.20
Sampling errors: Banten sample, Indonesia 2012 ... 346
Table C.21
Sampling errors: Bali sample, Indonesia 2012 ... 347
Table C.22
Sampling errors: West Nusa Tenggara sample, Indonesia 2012 ... 348
Table C.23
Sampling errors: East Nusa Tenggara sample, Indonesia 2012 ... 349
Table C.24
Sampling errors: West Kalimantan sample, Indonesia 2012 ... 350
Table C.25
Sampling errors: Central Kalimantan sample, Indonesia 2012 ... 351
Table C.26
Sampling errors: South Kalimantan sample, Indonesia 2012 ... 352
Table C.27
Sampling errors: East Kalimantan sample, Indonesia 2012 ... 353
Table C.28
Sampling errors: North Sulawesi sample, Indonesia 2012 ... 354
Table C.29
Sampling errors: Central Sulawesi sample, Indonesia 2012 ... 355
Table C.30
Sampling errors: South Sulawesi sample, Indonesia 2012 ... 356
Table C.31
Sampling errors: Southeast Sulawesi sample, Indonesia 2012 ... 357
Table C.32
Sampling errors: Gorontalo sample, Indonesia 2012 ... 358
Table C.33
Sampling errors: West Sulawesi sample, Indonesia 2012 ... 359
Table C.34
Sampling errors: Maluku sample, Indonesia 2012 ... 360
Table C.35
Sampling errors: North Maluku sample, Indonesia 2012 ... 361
Table C.36
Sampling errors: West Papua sample, Indonesia 2012 ... 362
Table C.37
Sampling errors: Papua sample, Indonesia 2012 ... 363
APPENDIX D DATA QUALITY TABLES ... 365
Table D.1
Household age distribution ... 365
Table D.2.1
Age distribution of eligible and interviewed women ... 366
Table D.2.2
Age distribution of eligible and interviewed men ... 366
Table D.3
Completeness of reporting ... 367
Table D.4
Births by calendar years ... 367
Table D.5
Reporting of age at death in days ... 368
PREFACE
As the world’s fourth most populous country, with 237 million people according to the 2010
Population Census, Indonesia attaches high priority on population issues and focuses on reviving
family planning program and empowering women, youth, and the elderly population. The Law
Number 52/2009 on Population and Family Development gives BKKBN new responsibility for
population management. BKKBN’s name was changed accordingly to the National Population
and Family Planning Board, maintaining the same acronym.
In 2012 the family planning program in Indonesia took on a new vision statement “Balanced
Population Growth by 2015”, while the main mission is to realize population
centered-development as well as small, happy and prosperous families. The main strategies include
enhancing partnerships with various agencies in different sectors and with regional governments.
Targeted strategies have been designed to meet the needs of different provinces, focusing on
those with large population and health vulnerabilities with an aim to accelerate the attainment of
MDGs in 2015.
The publication of the 2012 IDHS is well-timed since 2014 will be the final year of the
2010-2014 Mid-Term National Development Plan. Results of the 2012 IDHS are useful for the
evaluation of the achievements of the current population, family planning, and health programs
and serve as basis for developing the plan for the 2015-2019 period. The new development plan
will determine Indonesia’s course of development and the welfare of Indonesians in the next 5
years.
I would like to express my deepest gratitude to Statistics Indonesia (BPS), the Ministry of
Health (Kemenkes), National Development Planning Agency (Bappenas), the University of
Indonesia, and ICF International for their close cooperation in the preparation and finalization of
the survey report. I would also like to extend my gratitude to the United States Agency for
International Development (USAID) for providing technical assistance through ICF
International.
Jakarta, September 2013
Prof. Fasli Jalal MD, PhD
MILLENNIUM DEVELOPMENT GOAL INDICATORS
Millennium Development Goal Indicators by sex
Indonesia 2012
Value
Total
Goal Female Male
2. Achieve universal primary education
2.3 Literacy rate of 15-24 year olds1 97.8 95.8 96.8
4. Reduce child mortality
4.1 Under-five mortality rate (per 1000 live births)2 37 49 40
4.2 Infant mortality rate (per 1000 live births)2 28 39 32
4.3 Proportion of 1 year-old children immunized against measles 79.0 81.2 80.1
5. Improve maternal health
5.1 Maternal mortality ratio3 359
5.1 Percentage of births attended by skilled health personnel4 na na 83.1
5.2 Contraceptive prevalence rate5 61.9 na na
5.3 Adolescent birth rate6 48.4 na na
5.4a Antenatal care coverage: at least 1 visit by skilled health professional7 21.5 na na
5.4b Antenatal care coverage: at least 4 visits by any provider7 87.8 na na
5.5 Unmet need for family planning 11.4 na na
6. Combat HIV/AIDS, malaria, and other diseases
6.3 Percentage of population 15-24 years with comprehensive knowledge
of HIV/AIDS8 11.4 10.3 10.8
6.3 Percentage of children under 5 with fever who are treated with
appropriate antimalarial drugs9 0.8 0.8 0.8
na = Not applicable
1 Refers to respondents who attended secondary school or higher or who could read a whole sentence or part of a sentence 2 Expressed in terms of deaths per 1,000 live births and refers to a 10-year reference period preceding the survey. Mortality rates for
males and females combined refer to the 5-year period preceding the survey.
3 Expressed in terms of maternal deaths per 100,000 live births in the 5-year period preceding the survey 4 Among births in the five years preceding the survey
5 Percentage of currently married women age 15-49 using any method of contraception
6 Equivalent to the age-specific fertility rate for women age 15-19 for the 3-year preceding the survey, expressed in terms of births
per 1,000 women age 15-19
7 Includes doctor, midwives, and nurses 8
Comprehensive knowledge means knowing that consistent use of condoms during sexual intercourse and having just one partner can reduce the chance of getting the AIDS virus, knowing that a healthy-looking person can have the AIDS virus, and rejecting the two most common local misconceptions about AIDS transmission or prevention.
9
INTRODUCTION
1
1.1 G
EOGRAPHY
,
H
ISTORY
,
AND
E
CONOMY
he Republic of Indonesia, which consists of approximately 17,000 islands, is located between 6 degrees
north and 11 degrees south latitude, and from 95 to 141 degrees east longitude. The Indonesian
archipelago lies between Asia and Australia. It is bounded by the South China Sea in the north, the
Pacific Ocean in the north and east, and the Indian Ocean in the south and west. There are five major islands:
Sumatera in the west; Java in the south; Kalimantan straddling the equator; Sulawesi, which resembles the
letter “K”; and Papua bordering Papua New Guinea on the east. Two remaining groups of islands are Maluku
and Nusa Tenggara, running from Sulawesi to Papua in the north and from Bali to Timor in the south. Other
islands are small and mostly uninhabited. More than 80 percent of Indonesia’s territory is covered with water;
the land area is about 1.9 million square kilometers. The large number of islands and their dispersion over a
wide area has given rise to a diverse culture and hundreds of ethnic groups, each with its own language. This is
the basis of the national motto “Unity in Diversity.” Indonesia’s climate is tropical with two seasons. The dry
season extends from May to October, and the rainy season extends from November to April.
Indonesia is divided administratively into provinces. Since 2001, the number of provinces has
expanded from 26 to 33. The new provinces are Riau Islands, Bangka Belitung, Banten, West Sulawesi,
Gorontalo, North Maluku and West Papua. These new provinces formerly were part of Riau, South Sumatera,
West Java, South Sulawesi, North Sulawesi, Maluku province, and Papua, respectively. Each province is
subdivided into districts and municipalities. Altogether, there are 399 districts and 98 municipalities in
Indonesia. The next lower administrative units are subdistricts and villages. In 2012, there were 6,793
subdistricts and 79,075 villages in Indonesia. Each entire village is classified as urban or rural (BPS, 2012a).
Indonesia has been viewed as one of Southeast Asia's highly performing economies in recent decades.
The Indonesian economy grew rapidly during the 1980s and 1990s, but a financial crisis in 1997 slowed
economic growth.
Indonesia's economy is recovering. The per capita GDP increased steadily in the 2000s to
reach its highest level in Indonesian economic history of USD $846.8 billion in 2012. With a total population
of 238 million people in 2010, Indonesia’s per capita GDP was around USD $3,000. The increase in GDP will
accelerate development in a number of sectors (such as retail, automotive, and property), due to rising
consumer demand, and thus will promote economic growth. The Indonesian government has set a target GDP
of USD $5,000 for the year 2014
(http://www.indonesia-investments.com/finance/macroeconomic-indicators/gross-domestic-product-of-indonesia/item16).
In 1999, Law No. 22 on Regional Government (Pemerintahan Daerah) was enacted. The law gives full
autonomy to districts (Kota/Kabupaten). With some limited exceptions, the same law also makes the local
government responsible for all deconcentrated central government ministries at the province and district levels.
An important achievement of the Indonesian government is the improvement of the general welfare of
the population by ensuring the availability of adequate food, clothing, and housing, as well as providing
adequate education and health services. Data from the 1971 and 2010 Population Censuses and the 2011
National Socio-Economic Survey (Susenas) show that in the past 40 years Indonesia has undergone a major
improvement in the area of education. The literacy rate among persons age 10 and older increased from 61
percent in 1971 to 92 percent in 2011 (BPS, 1972 and BPS, 2012b).
The improvement in education is more pronounced among females. Whereas in 1971 school
attendance among children age 7-12 was 62 percent for males and 58 percent for females, the corresponding
rates in 2011 were 97 percent and 98 percent, respectively. From 1971 to 2011, the proportion of people age 5
and older who never attended school declined, while that of graduates at all levels increased. The proportion of
people who finished primary school increased from 20 percent in 1971 to 29 percent in 2011, while the
proportion of those who attended junior high school or higher education increased from 7 percent in 1971 to 50
percent in 2011. At all levels, the increase in education among females has been greater than that of males
(BPS, 1972 and BPS, 2012b).
1.2 P
OPULATION
According to the 2010 Population Census, the population of Indonesia was 237.6 million. This makes
Indonesia the fourth most populous country in the world after the People’s Republic of China, India, and the
United States of America.
An estimated 118.3 million people (50 percent of the population) lived in urban areas in 2010. In
2010, more than 87 percent of the Indonesian population was Moslem.
Indonesia’s population growth rate has declined in the last three decades. Between 1980 and 1990, the
average annual population growth rate was 1.98 percent. Between 1990 and 2000 the rate was 1.49, and then
1.44 percent between 2000 and 2010 (see Table 1.1).
Table 1.1 Basic demographic indicators
Demographic indicators from selected sources, Indonesia 1990-2010
Indicators
1990 census
2000 census
2010 census
Population (millions) 179.4 206.3 237.6 Growth rate (GR)1 (percent) 1.98 1.49 1.44
Density (pop/km2) 93 109 124
Percent urban 31 42 50
Reference period 1986-89 1996-99 2006-09
Crude birth rate (CBR)2 28 23 23
Crude death rate (CDR)3 9 8 9
Life expectancy4
Male 57.9 63.5 68.7
Female 61.5 67.3 72.6
1
Calculated using compound interest formula
2 Births per 1,000 population; CBR = 9.48968 + 5.55 TFR 3 Deaths per 1,000 population; CDR = CBR – GR per 1,000 4 Estimated using indirect estimation techniques
Source: BPS-Statistics Indonesia 1992, 2002, and 2012 (unpublished).