DESIGN OF LIFE CYCLE COST (LCC) ANALYSIS CSHARP BASED SOFTWARE TO INCREASE THE EFFECTIVENESS AND EFFICIENCY IN MACHINE MAINTENANCE
Indah Kurniawati1, Judi Alhilman2, Budi Laksono Putro3
1,2,3Industrial Engineering Undergraduate Study Program, Industrial and System Engineering Faculty, Telkom
University
[email protected], [email protected], [email protected]
Abstract
Globalisation era is era where technology becomes primary need for every sector in industry. Technology that usually used by manufacturer are robot, machine, information system/ technology, etc. Those technology can help the company to minimize defect and control the poduction time which is one of quality control system scope. One of quality control aspect is maintenance management which often become an issue in a company because it spend a lot of money. Thus, in this era most of company are challenged to find a method that make maintenance more efficient and effective, minimize cost and complexity. The method that suitable with this case is life cycle cost analysis. Unfortunately, most of company lack of industrial engineer in their maintenance department that cause life cycle cost can not be applied in those company, whereas life cycle cost analysis is method that can help the company to get the optimum lifespan of machine or equipment, and how many maintenance crew that needed in every maintenance activity for each machine which drive to the minimum overall cost that has to be paid during the lifespan of machine or equipment. The aim of this research is to build an application or software that can help the company and maintenance department to perform life cycle cost analysis. With this application, it is expected that many companies can push down their expenses and make the machine perform better.
Keywords: life cylce cost, LCC, csharp, C#, application, software, maintenance.
1. Introduction
Globalization era is era where competition among countries, industries, and companies are all open. Period development which more and more faster, drive the society to make the same pace with technology development. Nowadays, technology become very important thing in every sector of industry. Role of technology become primer needs or evenmore is like culture for every entity.
In manufacturing industry, technology which can be applied are robot, machine, or information system or technology. Those kind of technology can help the company to minimize and to control the production time and defect product. This is very related with quality control system, where there are some aspect, and one of the aspects is maintenance management.
Maintenance usually become an issue in the company, because maintenance likely spend a lot of money and sometimes the schedule of maintenance activity collide with production schedule. So that in this era where maintenance develop as fast as the time passed by and it become challenge for company, also method or tool is needed in order to do maintenance which more effective and efficien, so it can push down the cost and complexity.
Based on the explanation, maintenance very identical with cost and lifespan of the machine, this is appropriate with one of the method in maintenance management which is Life Cycle Cost. In order to facilitate the employee or the worker while doing the calculation of life cycle cost analysis, also minimise the time and cost, the calculation of life cycle cost analysis can be done with the help of information technology/ system.
2. Method
2.1 Life Cycle Cost
Life Cycle Cost is a calculation of estimation cost from the beginning until the completion of equipment or project as defined by analysis and estimation of total expense along the lifespan study or simply end to end cost that has to be paid so that equipment can operate as its function.
In this reearch, life cycle cost analysis used to define the optimum lifespan, amount of maintennace crew that provided to repair the failure of the machine or object. According to Barringer (1996), LCC has a model, where the model is a representation from a problem that can represent the real problem. In this research, the problem turn in to model through LCC approachment, which illustrate as follows:
Sustaining
Sustaining cost is cost that has to be paid because of ownership toward an equipment or machine during a certain period.
Operating Cost
Operating cost is cost that has to be paid because of operation of an equipment or machine in every period.
Maintenance Cost
Maintenance cost is cost that has to be paid because of maintenance activity toward that equipment or machine continously in every period during the operation cycle of the equipment.
Shortage Cost
Shortage cost is cost that has to be paid because of shortage of unit as a result of shortage of maintenance site crew to repair the equipment which broken.
Acquisition Cost
Acquisition cost is cost that has to be paid because initial purchasing of an equipment or system.
Purchasing Cost
Purchasing cost is overall cost that paid for purchasing an equipment or machine that needed in a system. For every different retirement age, it has different annual purchasing cost.
Population Cost
Population cost is cost that has to be paid in every period of ownership toward the equipment.
2.2 Distribution of Time to Repair and Failure
Distribution Identification have to know what kind of distribution that belongs to failure time and repair time of a machine or component as a purpose. The following distributions are statistics distribution that usually used as failure and repair distribution. [1]
1. Normal distribution or known as bell distribution because the curve looks like a bell. Normal distribution has two parameters which are μ and σ.
Followed by value of MTTF and MTTR = μ
2. Exponential distribution tend to represent the constant failure rate and independent toward time. Exponential distribution only has one parameter which is μ or λ.
Followed by value of MTTF and MTTR = 1 � = μ
means machine in its usefull stage (phase 2), or else β > 1 it means machine in its wear-out stage (phase 3) or old.
Followed by value of MTTF and MTTR = 𝛼Γ (1 + 1 𝛽)
2.3 Queue Theory
Queue system is association of customer, channel, an set of rule that settle customer arrival and processing of queue service problem where indicated by five components which are customer arrival pattern, service pattern, unit channel, system capacity to take the customer, and rule about how the customer served.
Queuing type that usually used in maintenance activity are single channel single phase, and multi channel single phase.
3. Designing System
Application or software that will be made is application to calculate life cycle cost analysis. There are some diagrams that made to represent both the business process and also how the system work.
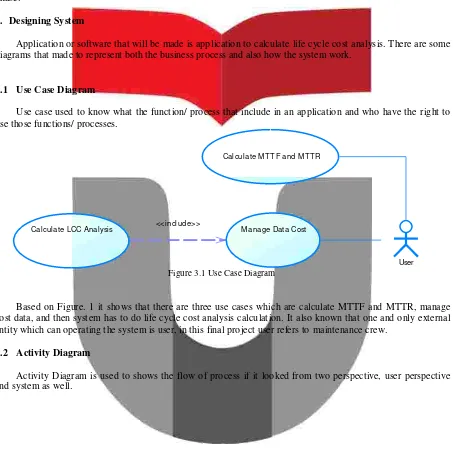
3.1 Use Case Diagram
Use case used to know what the function/ process that include in an application and who have the right to use those functions/ processes.
Cal cul ate MT T F and MT T R
Cal cul ate LCC Anal ysi s <<i ncl ude>> Manage Data Cost
Figure 3.1 Use Case Diagram
User
Based on Figure. 1 it shows that there are three use cases which are calculate MTTF and MTTR, manage cost data, and then system has to do life cycle cost analysis calculation. It also known that one and only external entity which can operating the system is user, in this final project user refers to maintenance crew.
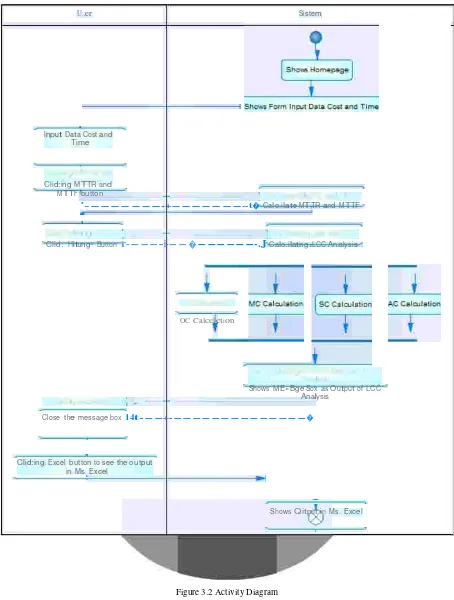
3.2 Activity Diagram
U,,er
Input Data Cost and
Time
Sistem
Clid:ing MTTR and MTTF button
'----+---t�Calo.ilate MTTR and MTTF
Clid: "Hitung•Button r------i---�---.J Calo.ilating LCC Analysis
OC Calceletion
Shows ME»Bge Sox as Output of LCC Analysis
Close the message box 14t---+----�
Clid:ing Excel button to see the output
in Ms. Excel
Shows Qitput in Ms. Excel
3.3 Data Flow Diagram
Data Flow Diagram (DFD) is diagram that used to illustrate the flow of the data, what the data that needed for each processes are, where the data and the result store is. Data Flow Diagram of this application/ software is in appendix.
4. Software Making and Testing
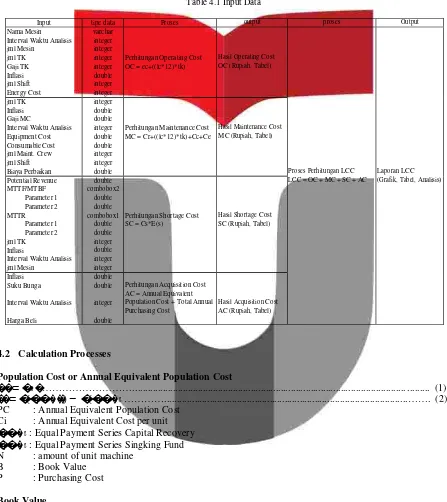
4.1 Input/Output Analysis
Population Cost or Annual Equivalent Population Cost
��=0
�
F : estimated salvage value of a unit L : estimated life of the unit
Salvage Value
F = P – (i x P) ……….………...……… (4) P : first cost of a unit
i : inflation
Annual Purchasing Cost
Annual Purchasing Cost =�(�|�, �, ��)*N ... ...… (5) P : Purchasing Cost
�|�, �, 𝑛 : Equal Payment Series Capital Recovery N : amount of unit machine
Annual Population Cost or Acquisition Cost
Annual population cost = annual purchasing cost + annual equivalent population cost
Operating Cost
�� = �� + (���𝑥 �𝑥 �ℎ𝑥 �𝑎��𝑥 12)……... .….… (6) OC : Operating Cost
TK : amount of operator N : amount of unit machine Sh : amount of shift per day Gaji : operator monthly salary Multiplied by 12 moth for annual cost
Maintenance Cost
�� = ��� + ��� + ��� + (�𝑥 �ℎ𝑥 �� 𝑥 12)…... … (7) MC : Maintenance Cost
Cr : Repair/replace cost Cc : Consumable Cost Ce : Equipment Cost M : Maintenance Crew Sh : amunt of shift per day
GM : maintenance crew monthly salary Multiplied by 12 moth for annual cost
Shortage Cost
SC = Cs [E(S)] ………...…...……. (8) SC : Shortage Cost
Cs : Shortage Cost per unit E(S) : expected number of units short
�(�) = ∑� 𝑛 𝑥�𝑛 ... (9)
N : amount of unit machine
n : amount of unit machine which broken Pn : Probability of machine broken
Pn = P0 x Cn…...………... (10)
�! (�)
��� = (�−��)!��!� �−𝑀 ... (11)
P0 : Probability 0 machine broken N : amount of unit machine n : amount of unit machine broken M : Maintenance Crew
λ : MTTR (Mean Time to Repair)
--r = amount of channel o--r maintenance c--rew
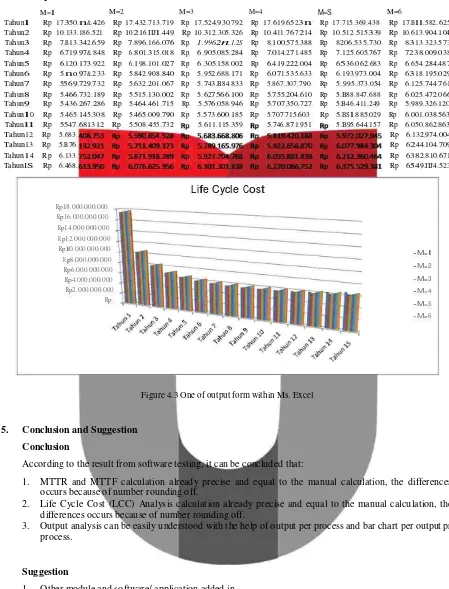
Form Output
M=l M=2 M=3 M=4 M=S M=6
Tahunl Rp 17350.n&.426 Rp 17.432.713.719 Rp 17.524.930.792 Rp 17.619.6523n Rp 17.715.369.438 Rp 17.Bll.582.625 Tahun2 Rp 10.133.186.521 Rp 10216.IIJl.449 Rp 10.312.305.326 Rp 10.411.767214 Rp 10.512.515339 Rp 10.613.904.104 Tahun3 Rp 7.B13.342.659 Rp 7.896.166.076 Rp 1.9962n.1.2S Rp 8.100.575.388 Rp 8206.535.730 Rp 8313.323.573
Tahun4 Rp 6.719.97&.848 Rp 6..801.315.018 Rp 6.905.085.284 Rp 7.014.271.485 Rp 7.125.605.767 Rp 7238.009.038
Tahun5 Rp 6.120.173.922 Rp 6..198.101.027 Rp 6.305.158.002 Rp 6.419.222.004 Rp 6536.062.683 Rp 6.654.284.487
Tahun6 Rp 5.no.97&.233 Rp 5.842.908.840 Rp 5.952.688.171 Rp 6.071.535.633 Rp 6.193.973.004 Rp 6318.195.029 Tahun7 Rp 5569.729.732 Rp 5.632.201.067 Rp 5.743.B84.833 Rp 5.867.307.790 Rp 5..995.373.054 Rp 6.125.744.761
Tahun8 Rp 5.466.732.189 Rp 5.515.130.002 Rp 5.627566.100 Rp 5.755.204.610 Rp 5.B88.847.688 Rp 6.025.472.066
Tahun9 Rp 5.436.267.286 Rp 5.464.461.715 Rp 5.576.058.946 Rp 5.707.350.727 Rp 5.B46.411.249 Rp 5.989.326.120
TahunlO Rp 5.465.145.308 Rp 5.465.009.790 Rp 5.573.600.185 Rp 5.707.715.603 Rp 5.BSl.885.029 Rp 6.001.038.563
Tahunll Rp 5547.681312 Rp 5.508.455.732 5.611.115.359 5.746..871.951 5.B95.644.157 Rp 6.050.862.863
Tahun12 Rp 5.683. Rp 6.132.974.004 Tahun13 Rp 5.B76. Rp 6244.104.709 Tahun14 Rp 6.133. Rp 6382.810.671 TahunlS Rp 6.468. Rp 6549.IIJ4.523
Life Cycle Cost
Rp18.000.000.000
Rp16.000.000.000
Rp14.000.000.000 Rp12.000.000.000
Rpl0.000.000.000 Rp8.000.000.000
Rp6.000.000.000
Rp4.000.000.000
Rp2.000.000.000
Rp·
•M=l
•M=2
•M=3
•M=4
•M=S
•M=6
Figure 4.3 One of output form within Ms. Excel
5. Conclusion and Suggestion Conclusion
According to the result from software testing, it can be concluded that:
1. MTTR and MTTF calculation already precise and equal to the manual calculation, the differences occurs because of number rounding off.
2. Life Cycle Cost (LCC) Analysis calculation already precise and equal to the manual calculation, the differences occurs because of number rounding off.
3. Output analysis can be easily understood with the help of output per process and bar chart per output pr process.
Suggestion
1. Other module and software/ application added in.
2. For the next research, it can be integrated with another maintenance management method such as Overall Equipment Effectiveness (OEE), Risk Based Maintenance (RBM), and Monte Carlo Simulation.
Bibliography:
[1] Soesetyo, I., & Bendatu, L. Y. (2014). Penjadwalan Predictive Maintenance dan Biaya Perawatan Mesin Pellet di PT Charoen Pokphand Indonesia - Sepanjang. 2-4.
[2] Sinisuka, N. I., & Nugraha, H. (2013). Life Cycle Cost Analysis on The Operation of Power Generation.
[3] Ebeling, C. (1997). Reliability and Maintability Engineering. London: McGraw-Hill International Edition.
[4] Anggriawan, A. (2015). Optimalisasi Umur BTS, Jumlah Maintenance Crew dan Penentuan Biaya Maintenance dengan Menggunakan Metode Life Cycle Cost (Studi Kasus: PT Telkomsel Indonesia). jurnal.
Appendix
Form Output Message Box
-
�
-
J
Berdasarkan perhitungan Life Cycle Cost (LC() maka untuk mesin pi biaya minimum yang didapat adalah Rp78453,126779661 dengan umur optimum mesin
=
1 dan jumlah maintenance crew atau teknisi yang dibutuhkan sebanyak S orangOK
DFD Level 0
User
Laporan LCC
1