Load Balancing at Emergency Departments
using
‘
Crowdinforming
’
Marcia R Friesen1, Trevor Strome2, Shamir Mukhi3, Robert McLoed1
1
Background: Emergency Department (ED) overcrowding is an important healthcare issue facing increasing public and regulatory scrutiny in Canada and around the world. Many approaches to alleviate excessive waiting times and lengths of stay have been studied. In theory, optimal ED patient flow may be assisted via balancing patient loads between EDs (in essence spreading patients more evenly throughout this system). This investigation utilizes simulation to explore “Crowdinforming” as a basis for a process control strategy aimed to balance patient loads between six EDs within a mid-sized Canadian city.
Methods: Anonymous patient visit data comprising 120,000 ED patient visits over six months to six ED facilities were obtained from the region’s Emergency Department Information System (EDIS) to (1) determine trends in ED visits and interactions between parameters; (2) to develop a process control strategy integrating crowdinforming; and, (3) apply and evaluate the model in a simulated environment to explore the potential impact on patient self-redirection and load balancing between EDs.
Results: As in reality, the data available and subsequent model demonstrated that there are many factors that impact ED patient flow. Initial results suggest that for this particular data set used, ED arrival rates were the most useful metric for ED ‘busyness’ in a process control strategy, and that Emergency Department performance may benefit from load balancing efforts.
1.
Background
1.1 Emergency Department Overcrowding
Emergency Department (ED) overcrowding, manifest in long patient wait times and excessive lengths of stay in hospital EDs, is a chronic public health concern in that it negatively impacts patient experiences and, potentially, their health outcomes, healthcare worker experiences, and system efficiencies. Reducing waiting times and potentially improving efficiencies can be fostered through the use of information and communication technologies in the delivery of services and resource management, as demonstrated by the prevalence of e-health initiatives that span the off-site delivery of care (telehealth), robotic surgery, mobile health applications, electronic medical records and region-wide records integration.
Patient wait times, excessive lengths of stay, and ED overcrowding receive considerable attention within healthcare administration and from the general public. Debates on how best to address these problems have been ongoing for several decades [1][2][3] and will likely continue into the foreseeable future. Factors related to ED overcrowding and excessive wait times are known to be complex. They include internal factors such as EDs that are too small, difficulties in transferring admitted patients out of the ED, staff shortages, and delays in consultative and diagnostic services; external factors include increasing patient volumes and increasing complexity and acuity of cases [4][5][6][7].
Many of the approaches that have been tried to reduce ED wait-times and lengths of stay involve addressing intra-ED processes. Familiar approaches include minor treatment streams
(‘fast-tracks’) for low-acuity patients [8][9][10], and re-conceptualization of the treatment
model [11], such as team triage [12]. It is also known that patient perceptions of wait times
and service delivery are important factors to consider [13].
Another approach to address these issues is controlling arrivals at EDs. For example, Emergency Medical Services (EMS) dispatchers may direct crews to a particular ED based on locale, patient acuity, and facility specialization. More recently, a pilot has been initiated in the region to transport stable and non-emergent patients to an urgent care facility as opposed to an ED; it is these patients who previously waited in an ED at the non-acute end of the triage scale [14]. This may have the effect of improving patient flow and helping to alleviate EMS offload delays and getting paramedics on the road faster.
1.2 Measures of Overcrowding for Modeling and Simulation
Modelling and simulation have been available to the study of the dynamics of emergency care for several decades, yet the resultant efforts are sparse and relate to many aspects of ED operations, including staff scheduling, patient flow, and departmental performance metrics [15][16][17]. Several studies also address patient loads in particular, although the underlying modelling methodologies and approaches are dissimilar from this work [18][19][20].
In model-building, researchers agree that usable and standardized definitions of overcrowding need to be established [21][22], as well as for the concepts inherent in
bed resources [24][26][27]. In all cases, it is clear that variables associated with crowding and busyness are complex and interact with one another, and efforts are focussed on building reliable conceptual frameworks [27]. In [24][25], patient arrival rates were used in quantifying measures of crowding and busyness, which this current work also supports.
This work develops a simulation model based on a process control strategy that relies on crowdinforming as an input; it is one of the first efforts at using real ED data in a feedback control manner to better understand the outcome of making real-time ED data available to the general public. In practical manifestation, such a strategy would provide patients with information to help with their decision to visit a hospital ED. In theory, actual patient loads at and between EDs may be balanced (resulting in streamlined patient flow), and patients’ perceptions of their ED experience may be enhanced as a result of improved patient flow due to the load-balancing effect of crowdinforming.
Simulations are an appropriate means of gaining this insight because potential impacts can be determined and evaluated without impacting real EDs or patients. When using actual patient data to feed a simulation, one must consider that the results may not generalize to other regions. If this investigation were to be replicated elsewhere, different and/or additional characteristics would need to be evaluated [21]. The use of simulation is justified; however, as our data appears consistent within the regional intuitions, so work to develop the model was undertaken.
The balancing of ED loads is a complex multifaceted problem; redirection of patients is just one piece of the solution. The patient redirection simulated here would be typical of patients with non-emergent conditions able to consult a web- or smart-phone based service that
provides insight into the “busyness’ of an ED prior to deciding upon which to attend. The
aspect being explored deals with using data that is becoming available, such that an informed decision can be made in the case of lower acuity patient self redirection.
1.3 Crowdinforming
The concept of Crowdinforming refers to the delivery of relevant information to the general public, which in non-critical cases can be accessed prior to a pending ED visit. This information is then used to decide which ED to attend. Crowdinforming is derived as a variant of the better-known concepts of crowdsourcing and crowdcasting, which recently have been used in biosurveillance applications [28][29]. One of the fundamental tenets of crowdsourcing is that the feedback loop needs to be closed, as information mined through crowdsourcing flows back to the crowd that generated it (crowdcasting), presumably to accrue benefit. Crowdsourcing has become a standard marketing practice enabled through the Internet and as such is becoming a familiar process from a user perspective.
This work contributes to efforts in understanding and reducing ED overcrowding: This work illustrates one potential avenue of contributing to this goal by simulating the effect of making information available to the public, allowing them a degree of informed choice on which ED to attend.
Overall, finding policies that balance loads among collaborating ED facilities is part of efforts in many systems that explicitly employ algorithms for that purpose. In addition, there is little counter evidence in any realm whereby an unbalanced system would behave in an optimal simulation as more analytical solutions are likely not to exist, certainly not with the ease of which a model and simulation can be developed.
2.
Methods
The objective of this exploratory study was to investigate the application of existing available data and emerging data feeds towards developing an auxiliary ED process control strategy. A further objective was to integrate crowd-informed data into the strategy, this will allow for the exploration of the potential effect (via simulation) of the process control strategy on the balancing of patient loads between hospital EDs. Patient load balancing was considered primarily as the relative equalization of patient loads between individual facilities (according
to respective capacities). Patient load balancing should also consider the ‘smoothing’ of
variability in patient loads at a facility over time (i.e. surge mitigation). However, this work considered primarily the inter-institutional impacts (vs. intra-institutional impacts) as a primary validation of the model.
The work progressed in three stages:
(1) statistical analyses of the data (descriptive statistics), to better understand the data and to test some intuitive expectations relative to variable relationships (section 2);
(2) the iterative development of a preliminary process control strategy, built upon crowdinformed parameters (section 3.1); and,
(3) the simulation of the process control strategy, and preliminary outcomes (section 3.2).
Data for this investigation were based on six months of patient visit data taken from the Emergency Department Information System (EDIS) of the health authority of a mid-sized Canadian city, spanning January through June 2009. The source included approximately 120,000 patient visits from six EDs. Data included gender and age of the patient, and timestamps of various milestones related to arrival, triage and registration, and discharge time. The data essentially comprise a trace file of events that have taken place. Initially and intuitively the authors expected the most meaningful input into a strategy for self-initiated patient redirection to be patient waiting times and length of stay.
the efficiencies between EDs (inter-institutional). The forthcoming, expanded data which include specific trajectories through a particular ED will potentially facilitate intra-institutional modeling efforts. Data were fully anonymized and blinded to ensure patient anonymity, and data handling and storage security measures were taken to ensure patient confidentiality. Any patient identifiers were removed prior to receipt of the data, and ED sites were masked by labels A through F.
For purposes of this initial investigation, all sites were treated equal in terms of bed capacity, although it is known that the health region consists of two larger tertiary centres and four community centres. This was done for modeling and visualization purposes only with the conjecture being that if load balancing was not achievable in this simplified modeling scenario, it is unlikely to be effective once varying capacities were included.
3.
Results and Discussion
3.1 Initial Data Analysis
Descriptive statistics were applied on the EDIS data set, calculating measures of central tendency and variability for various parameters. This was done to gain insights into basic variable relationships and to confirm the fidelity of the data.
Fundamental to the concept of patient load-balancing is a concept or metric of ‘busyness’ of
an ED, which is often manifest in circumstances of excessive patient wait times, facility overcrowding, and excessive lengths of stay. The preliminary analyses attempted to
conceptualize ED ‘busyness’ relative to a range of variables in the available data, in order to determine the most meaningful variable or combination of variables for further use in a process control strategy for this particular data.
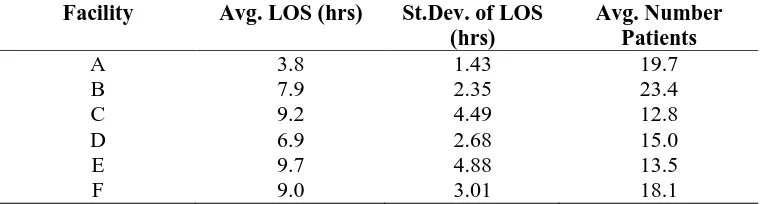
Table 1: Average Length of Stay and Average Number of Patients
Facility Avg. LOS (hrs) St.Dev. of LOS (hrs)
Avg. Number Patients
A 3.8 1.43 19.7
B 7.9 2.35 23.4
C 9.2 4.49 12.8
D 6.9 2.68 15.0
E 9.7 4.88 13.5
F 9.0 3.01 18.1
An intuitive approach to establishing a ‘busyness’ metric would be to consider associating
LOS with the number of patients waiting. This observation - in addition to being intuitive - has also been reported elsewhere [27]. The data facilitated initial investigations of a model that would fit a length of stay duration to the number of people waiting. In this manner when a redirection to another facility occurs, the original data are modified to reflect a reduced LOS at the facility the person would have initially chosen, as well as a slight increase in the LOS at the facility of chosen destination. This was the basis of the preliminary conjecture
that average LOS, as a function of patients waiting, would be a meaningful ‘busyness’ metric
and a meaningful variable in a process control strategy.
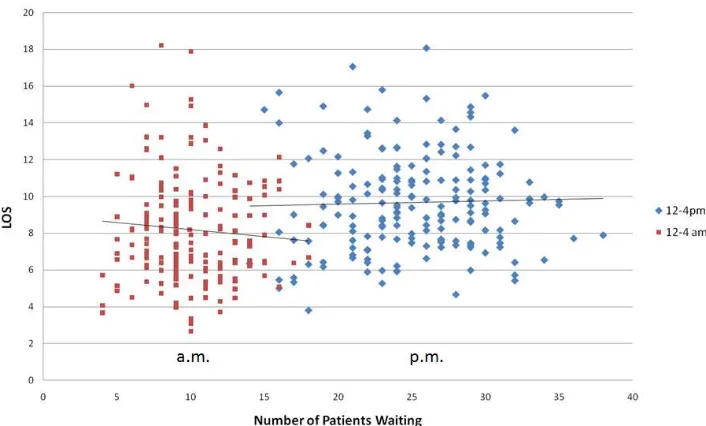
Figure 1: Average LOS at Facility B vs. Patients Waiting
Figure 1 shows a representative plot of this fit of average LOS and number of patients for Facility B, based on six months of EDIS data. There is no directly observable positive linear
relationship between number of patients waiting and the LOS (R2 = 0.008). This is
counter-intuitive and not as reported in [27]. This may reflect that during peak ED hours (between 10:00am and 10:00pm) there are increased staffing levels in the ED and ancillary
departments. Also, several sites operate Minor Treatment Areas (also known as “Fast
The initial exploratory strategy of directly using average LOS data as a control input would result in patients regionally being redirected to Facility A, with no concomitant reduction in length of stay at the remaining facilities. This is intuitively untenable, and the next analysis took time-of-day into account, to reflect time-varying healthcare worker resources (staffing levels).
With this inclusion, Figure 2 reflects the average LOS at Facility F between 0:00-4:00 AM and between 12:00-4:00 PM. Even though the LOS is comparable, the throughput is considerably higher during the day, assumed to be a consequence of increased staff, increased availability of ancillary services and a greater number of non-urgent patients.
Figure 2: Length of Stay at Facility F, 0:00-4:00 AM and 12:00-4:00 PM
Again, the anticipated positive linear relationship between patient load and LOS was not borne out by the data. The follow-on analysis refined the LOS estimates by stratifying triage scores. (Canadian EDs typically employ the Canadian Triage Acuity Scale, CTAS, which is a 5-point scale with 1 being most acute or serious and 5 being the least acute.) CTAS level 3 was chosen for analysis, as it captures the single largest group of patients (34% of all ED visits within the data). CTAS 3 also reflects the triage score most often assigned to patients presenting with influenza-like illness, and the issues of ED load-balancing (surge mitigation) become particularly relevant in outbreaks of ILI. Data were also culled for outliers, defined as data points more than three standard deviations removed from the mean.
The results analysing the Wait Time at an ED for a specific triage score (3) continued to discount a positive linear relationship between LOS and patient load, where this relationship was the basis of the preliminary conjecture. This is unfortunate from a control perspective, indicating that the number of patients in the ED is not necessarily the best measure of
“busyness”. It could be argued that a better measure of “busyness” may be more easily
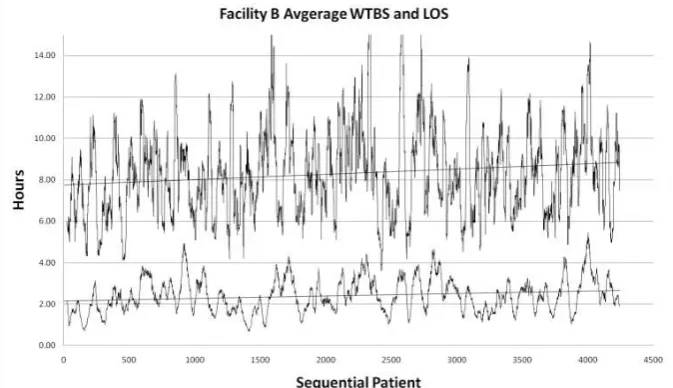
associated with a patient’s wait to be seen (WTBS). Although WTBS also seems intuitively reasonable, it unfortunately suffered from similar drawbacks as the LOS as a measure of busyness.
moderately correlated with coefficients ranging from 0.42 to 0.62. Figure 3 illustrates a running average WTBS and LOS at facility B with a 10-patient running average (as an average of those waiting and for display).
Figure 3: Average Waiting To Be Seen and Length Of Stay (running average) over a one
month period.
Based on these initial investigations, average LOS and average WTBS durations were discounted as possible control parameters. A known drawback is that neither average LOS nor WTBS is useful as a real-time control parameter in this data set, as these averages lag behind data that would be available at a given instant of time. Nonetheless, average LOS and average WTBS up to a point in time (running average) were investigated, with a correlation coefficient of 0.04 for the complete data set, and a correlation coefficient of 0.45 when controlled for triage scores.
In a further exploration of a meaningful metric of ‘busyness’, patient arrival rates and departure rates from an ED were considered and found to have some degree of exploitable
structure. Patient arrival rates’ influence on busyness was also supported by other researchers
Figure 4: Arrival and Departure Rates at Facility A.
The preceding discussion outlined efforts to obtain understanding of the data. Initial
conjectures that average LOS and WTBS would be meaningful metrics of ‘busyness’ and
thus meaningful variables in a process control strategy for the purpose of load balancing were not borne out by the data. Several other analyses were performed but not presented here, as they likewise discounted the original conjectures. A summary of the exploratory analysis is provided in Table II. It is acknowledged that these results are counter-intuitive and at times contrary to other published findings; however, these results are reflective of the particular data set used.
The approaches considered above illustrate the difficulty of developing a control strategy that
relies on straight forward estimates of ‘busyness’. Table II summarizes the interim results.
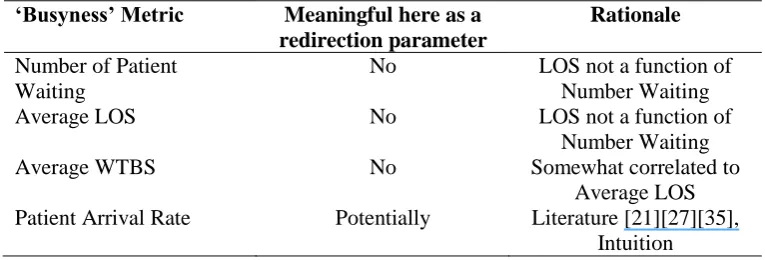
Table 2: Potential ‘busyness’ metrics and their utility in redirection
‘Busyness’ Metric Meaningful here as a
redirection parameter
Rationale
Number of Patient Waiting
No LOS not a function of Number Waiting
Average LOS No LOS not a function of
Number Waiting
Average WTBS No Somewhat correlated to
Average LOS Patient Arrival Rate Potentially Literature [21][27][35],
Intuition
algorithm (control strategy) then works from the trace file to see if throughput can be improved. During the process, the trace file is modified as if requests were sent to alternative services. In effect, this can be articulated as a system for simulating dynamic load balancing on various services produced using trace files of real service loads.
An additional consideration in using arrival rate as our “busyness” metric was derived from
[21] where the authors indicated that “autocorrelation in the models for wait time and LOS is
consistent with our intuition that process times are affected by prior patient arrivals” and that
“future work will focus on discrete event simulation modeling”. This is similar to the case presented here; we have data that appears consistent within the regional intuitions and are using the data as input to simulation. Further consideration also came from the literature
[27][35], where in particular number of patients from the ED was associated with the daily
mean length of stay for all ED patients [35].
3.2 Process Control Strategy Development built upon Crowdinforming
Based on the initial insights, a preliminary process control strategy upon which to apply a crowdinforming simulation was developed. Intuitively, LOS, WTBS, arrival rates, origin of enquiry, and ED capacity should lend themselves to a model for crowdinforming to be built
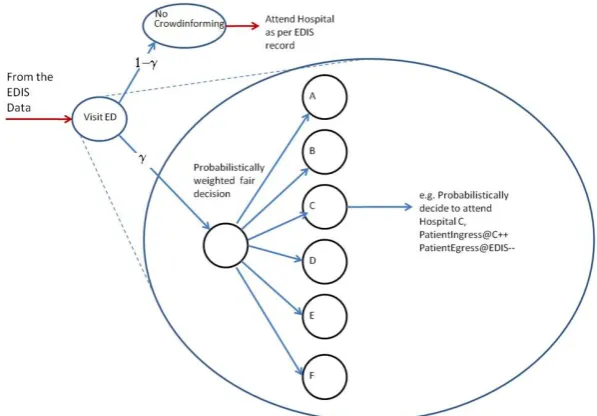
with increasing fidelity. However, it is crucial that ‘busyness’ metrics be extracted from real data, as they may be context-specific and/or counter intuitive as evidenced here. The model for patient decision making is a simple discrete event simulator, where each patient is individually governed by the stochastic decision process of Figure 5. The process of Figure 5 is essentially for fair weighted crowdinforming diversions. A person being modeled either proceeds to the ED they would have gone to normally or consults a service and makes a weighted fair decision as to which ED to attend. In this model they will probabilistically attend the least busy.
In conceptualizing ‘busyness’ in terms of patient arrival rates, some of the anticipated effects
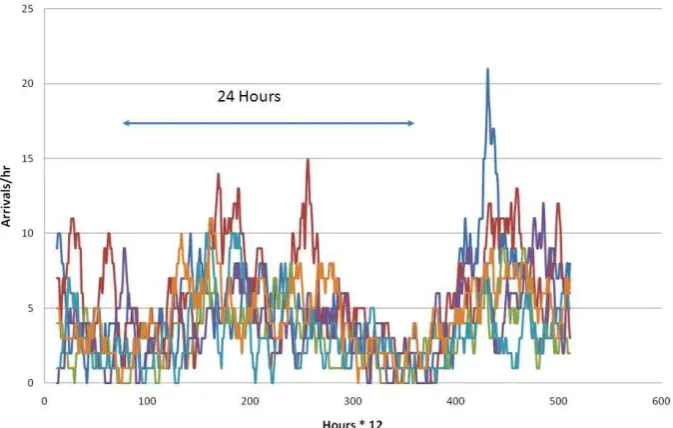
of patient-initiated redirection were observed. The redirection policy model was based on five minute intervals of data availability and updates. The redirection policy in this simulation was straight-forward: a percentage of patients (e.g. 75%) were set to consult the posted arrival rates and then probabilistically self-redirect to the facility with the lowest present arrival rate. Figure 6 illustrates the raw arrival rates at the six regional EDs. The horizontal axes in Figures 6 indicate serial 12-hour increments.
Figure 6: Arrival Rates at six Facilities with No Crowdinformed Redirection.
The main observation is that without any form of patient redirection modeled, there is a reasonable degree of diversity in the arrival rates at any particular facility. The spikes represent arrival surges at the individual facilities that have been conjectured to contribute to crowding and increased waiting times [22][36].
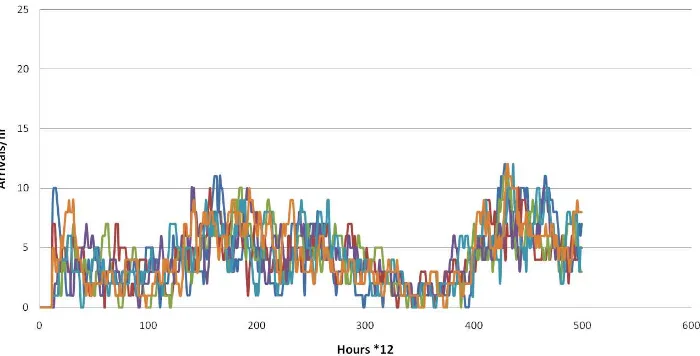
Figure 7: Arrival and Departure Rates at six Facilities with Weighted Fair Crowdinforming
Redirection (multiple passes).
As the data are time varying, samples from weighted fair redirection, sorting redirect and the raw trace file were transformed to the frequency domain (FFT) and digitally filtered, essentially removing the circadian fundamental. As the data clearly exhibited a circadian autocorrelation component, transformation to the frequency domain was the simplest means of its removal. More complicated analyses could have been undertaken but as we were only interested in the variance about the moving average, this was the most straightforward. This
allows one to estimate the variance from the periodic moving average. The standard deviation
arising from the inverse transform was approximately 0.41 for the raw trace file, 0.50 for the
weighted fair redirection and for Hospital B (selected arbitrarily). It was somewhat
unexpected that the weighed fair redirection performed more poorly in terms of variance than the original trace file, even though an element of load balancing appears evident from Figure 7. Figure 7 re-adjusts the trace file over several passes through the trace file to more fully represent the steady state associated with this control strategy as opposed to more transient behaviour as would be the case if the crowdinforming policy were instantly switched on.
In a more refined model to be explored in future work, the data would allow for an aspect of travel time to be considered, as an EDIS patient record can be configured to include prefixed postal code information (approximate neighbourhood of origin); for this study, the postal code was sanitized from the records. Also, although not investigated here, an exponential weighted moving average (EWMA) of arrival rates might improve the outcomes and be easily extracted as well.
At the time of writing, only one of the hospitals included in this study has an ED wait-times
display “dashboard” deployed in the ED waiting room. Currently, this dashboard displays the
Our model extends this notion of a wait-times dashboard and conjectures that in a reasonably short period of time, these data could be made available through a web service, such that an
individual would be able to query the hospital “dashboards” from an “ED Wait Times”
website over the internet with any browser, be it mobile cellular or wired. In addition, a text service could be established where a user would text a notable number (for example, 311EDWait) and receive a list informing of anticipated waits or load at various facilities.
In late 2009, real-time displays of the ED dashboard data were installed in the dispatch centre
of the city’s Fire and Paramedic Services, in order to facilitate pre-hospital re-direction of ambulances and emergency vehicles. However, when considering large-scale
crowdinforming to an entire city’s population, modelling and simulation provide an
exploratory investigation into the potential effects of a crowdinformed system, without the cost and potential disturbances to a system under endemic stress.
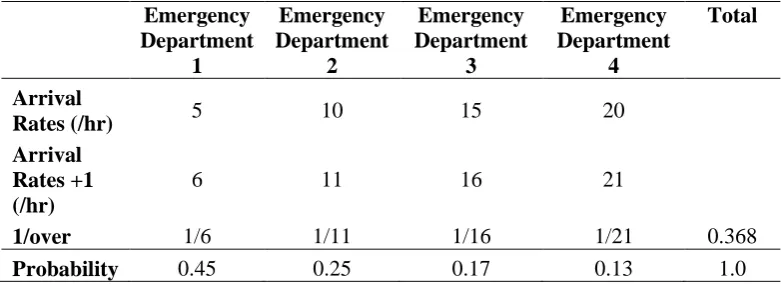
In this simulated crowdinforming scenario, a proactive decision is made by a relatively low-acuity patient who intends to visit a hospital ED for a non-emergent medical issue. In addition to the stochastic process of deciding upon going to an emergency department, each patient is also provided with estimates of load, proxied by patient arrival rates (for simulation purposes). These data are available and easily instrumented within the controls being modelled. As an illustration, assume there are four hospitals with average arrival rates of 5, 10, 15, and 20 patients/hr. In the model a potential patient would create a biased roulette wheel to guide their probabilistic decision once they have elected to go to an emergency department. The associated normalized probabilities associated with informed self-initiated redirection are shown in Table III. The arrival rates (Table III) would be provided by the hospitals and made available to the public through a web service, smart phone app or text
service as discussed above. The “Arrival Rates +1” models the impact of adding the
decision-making patient to each facility, as if the patient were attending all EDs. The table then calculates the probability of the individual patient actually going to the respective facilities. That is to say, the facility becomes a slightly less attractive destination if you choose to direct yourself there, in effect biasing that facility to be slightly busier. From a numerical perspective, it also prevents a division by zero in the event the arrival rate at a facility is zero arrivals/hour. In reality, the numbers are only for simulation purposes only. Conveyance of a selected ‘busyness metric’ (whatever it is) would have to be considerably more user friendly, such as number of signal reception bars as seen on a cell phone, or a red-yellow-green-light scale.
Table 3. Informed Emergency Department Self Redirect Probabilities
Ideally, Table III would combine estimates of travel time and patient load in an additive manner as a linear combination weighted appropriately as in equation (1). Within the general population, a person presented with statistical data would likely preferentially choose the facility with the lowest arrival rate, as people are typically not probabilistic in nature. If this were the case, the situation would by default look similar to where a simple sort was used for redirection. Additionally, equation (1) accounts for varying perceptions of equal durations of wait time: people may perceive 30 minutes travel time more favourably than 30 minutes of wait time, perhaps due to the psychology of the perception of control (actively driving a car vs. passively sitting in a chair).
In equation 1, N represents the number of ED facilities. A weighting has been assigned to reflect a probabilistic decision that incorporates both travel time and arrival rates. Here
reflects a person’s decision to consider redirection. The term weights the probabilistic
component associated with patient arrival rates as indicators of “busyness”. The term weights the probabilistic component associated with travel time associated with distance di, where di represents the distance to facility i. The parameter that would be crowdinformed
from a regional hospital authority would be the term associated with ‘busyness’. In this data set, the ‘busyness’ metric is patient arrival rates denoted i, wherei represents the arrival rate at facility i. If used in a mobile or web based application, the distance and estimated travel time can be extracted from many geolocation travel time estimation services readily available.
For example, if one were to discount travel time and only use the measure associated with busyness (i.e. patient arrival rates), =0. If the data as illustrated in Table III were then used, the person would choose ED1 with a probability of 0.45. If in addition,
i.e., was a 75% chance that the person would consider self redirection) the
probability of the person choosing ED1 would be 0.75*0.45 = 0.33. This would model approximately a 33% chance that the person would redirect to ED1.
This also presents an opportunity to introduce a capacity parameter as in equation 2. The nice feature about this type of measure is that it is relative between facilities. The capacity parameter would be arrived at experientially for each institution, although back-casting from available data may be a starting point. As capacity would is not subject to change at an institution for prolonged periods of time, its actual value in this simulation is arbitrary.
(1)
Using such a method, the patients make a probabilistic decision weighted by the least anticipated wait, inferred from the busyness of the EDs derived from the near real-time patient arrival rates. As a consequence, the overall surge seen between hospitals is dampened by the behaviour of informed individuals.
(2)
“busyness” probabilistically influences a person’s decision in attending a particular emergency department. The overall effect is that of a low pass filter, smoothing out the peaks and valleys in space and, to some extent, in time. Filtering in time is expected to result from incorporation of an estimate of travel time as indicated in Equation 1.
Although preliminary, this work represents one of the first modelled instances of the potential of crowdinforming in providing a policymaker with a simulation to aid decision support. The decision would be to create public access to "dashboard" type information that is currently
available in emergency departments or electronic records. The publicly available “dashboard”
would be accessible via the web or 3G smartphone. Crowdinforming serves to filter the simulated patient surges at a given facility by balancing patient load between facilities (to
each facility’s respective capacity). As the win-waiting-room “dashboards” are a relatively new concept currently under evaluation it is unlikely that exactly the same data would be presented to a patient considering self redirection at this time.
3.4 Limitations
The model is preliminary and currently uses one metric – patient arrival rates – as an
indicator of ‘busyness’ and as the basis for crowdinforming. Intuitively expected metrics such as the number of patients waiting as well as average LOS were not found to be effective as an input into a process control strategy for patient redirection. Additional statistical analysis needs to be carried out on the trace file data, to facilitate a refinement of the model to account for the interplay of multiple variables. Additionally, forthcoming EDIS data will provide further breakdowns of various waiting and treatment phases, which will facilitate a
more precise model. It is unlikely that a simple unified model of “busyness” across all EDs
across varying hospital authorities would suffice, particularly in scenarios where some
indication of real time “busyness” is to be fed back to the general community.
A further significant limitation associated with research of this nature is that stochastic models of behaviour have to be estimated. Modelling social dynamics is a difficult and messy problem; however, insights garnered from simulation and modelling are nonetheless useful and would be used in support of an otherwise best-guess decision.
or in the case of a broken arm or wrist whether a physician were on site who would be able to set the break.
The present framework appropriately considers system-wide impacts with simplified assumptions on respective ED capacity, prior to intra-institutional simulation and other institutional refinements. The framework developed here allows policies to be simulated and evolved, adding a qualitative assessment to decisions that may otherwise be experiential or best intent. This work is one of the first demonstrations of the crowdinforming intervention as a variant of the broader concept of crowdsourcing, and it demonstrates the role that similar technologies which provide crowdinformed decisions will continue to play in the future.
It is important to note that this work did not set out to develop a model to fit observed data,
nor to develop a ‘busyness’ model of an ED. The objective was to develop a process control
strategy built on crowdinforming, and in doing so, a meaningful metric of ‘busyness’ is
required, which was expected to be somewhat self evident. Thus, this work included an exploration into the data in order to define a meaningful metric for this data set. This exploration is a pre-requisite to the development of a meaningful process control strategy for
crowdinforming. The work implied that the input parameters (in this case, a ‘busyness’
metric) may be ‘data-unique’ and must be defined and verified for each respective data set. Furthermore, the validity of patient arrival rates as an input parameter has not been
established definitively; however, the work did indicate that other parameters are –
surprisingly –not necessarily a good metric within this particular data set within this problem
domain.
This study was limited to data from one regional health authority. Specific results of similar analyses at other regions would likely be different. A limitation of modeling is that the
assumption of ‘busyness” (wait time and LOS) is consistent with our intuition that process times are affected by prior patient arrivals.
These limitations imply that data collected from a multiple-ED system have to be carefully considered as issues and conditions at other regions are likely to be different (as they are, often, between EDs within the same region). However, as data become more widely available, there will be increased opportunity and additional tools available for its analysis
and improved interpretation of causality concerning “busyness”. Similar considerations also
apply to the feedback control strategy one may be interested in. Fortunately, there are an increasing number of modeling and simulation tools and methods readily amenable to this type of policy modeling.
Ideally for patient self redirection one of the means of providing a meaningful “busyness”
As previously mentioned, this problem domain is very complex with myriad variables. As data systems improve, and the ability to extract consistent and meaningful data from these systems follows suite, a more detailed insight into the complexities of ED operations will be
gleaned from the data. As more data is available, investigators will be able to exploit Stein’s paradox where an estimate of “busyness” is made more accurate when three or more
parameters are estimated simultaneously. These parameters may be apparently unrelated, but for example could include arrival rates as discussed above augmented with the number of paramedics waiting for their patients to be seen by an ED doctor.
A final limitation of the model presented here is that since the input was extracted from real arrival rates at various facilities (trace file), there is not a directly observable output such as resulting average LOS as a consequence of the redirection. The indirect output is a reduction in arrival spikes associated with arrivals without patient self-redirection, as compared to the arrivals associated with patient self-redirection. Although the modelled process is stochastic, the underlying principle is that of negative feedback control system thereby balancing the ED loads across facilities and attenuating arrival spikes.
4.
Conclusions
This work illustrates the role that data-driven modelling can play in developing policy or supporting public health decisions. The investigation derives a preliminary process control strategy upon which to model the effects of self-initiated patient redirection on hospital
patient loads. The work illustrates how one specific intervention – that of proactive
information dissemination or crowdinforming – can potentially provide a degree of process
control in the form of patients’ self-initiated re-direction, resulting in load balancing at emergency departments. The work illustrates that meaningful strategies rely on appropriate
data- or context-specific choices in the variable or variables chosen as metrics of ‘busyness’
and consequently to their broadcast through crowdinforming. The results of this investigation are not intended to be specific recommendations for a regional health authority, but rather illustrate a flexible framework around which applications of this type can be better evaluated and their potential outcomes assessed. The benefit of simulation is to allow a policy or decision maker to gain insight into what may occur and be better prepared than in the implementation of a crowdinforming policy without modeling or simulation.
The preliminary model was derived from simple statistical analyses of the available EDIS data, in order to test support for preliminary conjectures. As the initial conjectures were discounted by the data, the model was refined. The application of a stochastic patient decision process representative of crowdinforming was demonstrated to contribute to load balancing at individual hospital emergency departments. The evidence for the findings was the trace file data associated with real ED visits within a regional health authority, and the
balancing of arrival rates as a consequence of self redirection when a metric of ED ‘busyness’
is presented to the public. It was noted however, that although loads were being balanced across the facilities, the simulation did not indicate any alleviation in the variance associated with the arrival rates. In this regard, an increase in variability may detrimentally contribute to the patient flow within the various EDs.
Future work will include the utilization of running averages of the WTBS time, LOS and arrival rates once more data become available, as well as multiple regression analysis to learn
more about predictor variables and a dependent “busyness” variable. Preliminary analysis
estimate of “busyness”. The stochastic decision process and control model would remain the same.
Competing interests
The authors declare that they have no competing or conflicting interests.
Acknowledgement
[1] D.A. Thompson, P.R. Yarnold, D.R. Williams, & S.L. Adams, Effects of actual waiting
time, perceived waiting time, information delivery, and expressive quality on patient
satisfaction in the emergency department, Ann Emerg Med, 28, 657-665, 1996.
[2] A. Mortimore & S. Cooper, The "4-hour target": emergency nurses' views, Emerg Med
J, 24, 402-404, 2007.
[3] S. Trzeciak & E.P. Rivers,Emergency department overcrowding in the United States:
an emerging threat to patient safety and public health, Emerg Med J, 20, 402-405, 2003.
[4] M.W. Cooke, S. Wilson, J. Halsall & A. Roalfe, Total time in English accident and
emergency departments is related to bed occupancy, Emerg. Med. J., 21, 575-576,
2004.
[5] M. Lyons, R. Brown & R. Wears, Factors that affect the flow of patients through
triage, Emerg Med J, 24, 78-85, 2007.
[6] R. Dunn, Reduced access block causes shorter emergency department waiting times:
An historical control observational study, Emergency Medicine, 15(3), 232-238, 2003.
[7] R.W. Derlet & J.R. Richards, Overcrowding in the nation’s emergency departments:
Complex causes and disturbing effects, Ann Emerg Med, 35(1), 63-68, 2000.
[8] M.W. Cooke, S. Wilson, & S. Pearson, The effect of a separate stream for minor
injuries on accident and emergency department waiting times, Emergency Medicine
Journal, 19, 28-30, 2002.
[9] T.C. Chan, J.P. Killeen, D. Kelly & D.A. Guss, Impact of Rapid Entry and Accelerated
Care at Triage on Reducing Emergency Department Patient Wait Times, Lengths of
Stay, and Rate of Left Without Being Seen, Ann Emerg Med, 46(6), 491-497, 2005.
[10] M.J. Schull, A. Kiss, & J.P. Szalai, The Effect of Low-Complexity Patients on
Emergency Department Waiting Times, Ann Emerg Med, 49(3), 257-264, 2007.
[11] O. Miro, M. Sanchez, G. Espinosa, B. Coll-Vinent, E. Bragulat & J. Milla, Analysis of
patient flow in the emergency department and the effect of an extensive reorganization,
[12] F. Subash, F. Dunn, B. McNicholl & J. Marlow, Team triage improves emergency
department efficiency, Emerg. Med. J. 21, 542-544, 2004.
[13] D.A. Thompson, P.R. Yarnold, S.L. Adams, A.B. Spacone, How accurate are waiting
time Perceptions of patients in the emergency department?, Ann Emerg Med, 28,
652-656, 1996.
[14] http://www.cbc.ca/canada/manitoba/story/2010/12/07/mb-ambulances-misericordia-health-centre-winnipeg.html#ixzz17XH7WGjK
[15] C.E. Saunders, P.K. Makens & L.J. Leblanc, Modeling emergency department
operations using advanced computer simulation systems, Ann Emerg Med,18(2),
134-140, 1989.
[16] R.A. Kilmer, A.E. Smith & L.J. Shuman, An Emergency Department Simulation and a
Neural Network Metamodel, J Society for Health Systems, 1997.
[17] M.M. Gunal & M. Pidd, Understanding accident and emergency department
performance using simulation, Proc of the 38th Conf on Winter Simulation, Monterey,
CA, 2006.
[18] M. Draeger, An emergency department simulation model used to evaluate alternative
nurse staffing and patient population scenarios, Proceedings of the 24th Conference on
Winter Simulation, Arlington, VA, 1992.
[19] S. Takakuwa & D. Katagiri, Modeling of patient flows in a large-scale outpatient
hospital ward by making use of electronic medical records, Proceedings of the 39th
Conference on Winter Simulation, Washington D.C., 2007.
[20] G.R. Hung, S.R. Whitehouse, C. O’Neill, A. Gray & N. Kissoon, Computer modeling of patient flow in a pediatric emergency department using discrete event simulation,
Pediatric Emergency Care, 23(1), 5-10, 2007.
[21] P.V. Asaro, L.M. Lewis & S.B. Boxerman, The Impact of Input and Output Factors on
Emergency Department Throughput. Acad Emerg Med, 14: 235–242.
doi: 10.1197/j.aem.2006.10.104, 2007.
[22] S.J. Weiss, R. Derlet, J. Arndahl et al., Estimating the degree of emergency department
overcrowding in academic medical centers: results of the National ED Overcrowding
Study (NEDOCS), Acad Emerg Med, 11, 38–50, 2004.
[23] M.L. McCarthy, D. Aronsky, G.D. Kelen, The measurement of daily surge and its
relevance to disaster preparedness, Acad Emerg Med, 13(11), 1138-1141, 2006.
[24] T.J. Reeder, H.G. Garrison, When the safety net is unsafe:real-time assessment of the overcrowded emergency department, Acad Emerg Med, 8, 1070–1074, 2001.
[25] L.I. Solberg, B.R. Asplin, R.M. Weinick, D.J. Magid, Emergency department crowding: consensus development of potential measures, Ann Emerg Med, 42, 824–834, 2003.
[26] S.L. Bernstein, V. Verghese, W. Leung, A.T. Lunney, I. Perez, Development and validation of a new index to measure emergency department crowding, Acad Emerg Med, 10, 938–942, 2003.
[27] M.L. McCarthy, S.L. Zeger, R. Ding, S.R. Levin, J.S. Desmond, J. Lee, D. Aronsky,
Crowding delays treatment and lengthens emergency department length of stay, even
among high-acuity patients, Ann Emerg Med., 54(4), 511-513, 2009.
[28] Song, C., Z. Qu, N. Blumm, and A-L. Barabási, Limits of Predictability in Human
Mobility, Science, 327 (5968), 1018, 2010. [DOI: 10.1126/science.1177170]
[29] J. Howe, The Rise of Crowdsourcing, Wired, June 2006,
http://www.wired.com/wired/archive/14.06/crowds.html. Retrieved 2010-2-18.
[30] P. Sprivulis & B. Gerrard, Internet-accessible emergency department workload
information reduces ambulance diversion, Prehospital Emergency Care, 9(3), 285-291,
2005.
[32] http://www.fiercehealthcare.com/story/patients-use-smartphone-apps-find-nearest-er/2010-11-23
[33] B. Adini, R. Cohen, D. Laor, A. Israeli, Can patient flow be effectively controlled? Health Policy Plan. (2011) czr002 first published online January 27, 2011 doi:10.1093/heapol/czr002
[34] M. Noeth, P. Ratn, F. Mueller, M. Schulz, B. R. de Supinski, ScalaTrace: Scalable
compression and replay of communication traces for high-performance computing, J Parallel and Distributed Computing, 69(8), 696-710, August 2009,
DOI:10.1016/j.jpdc.2008.09.001
[35] N.K. Rathlev, et al., Time Series Analysis of Variables Associated With Daily Mean
Emergency Department Length of Stay, Ann of Emerg Med, 49(3), 265-271, March 2007, DOI: 10.1016/j.annemergmed.2006.11.007.
[36] J.L.Wiler, et al., Optimizing Emergency Department Front End Operations, An