THE IMPACT OF FISCAL DECENTRALIZATION TO INTERREGIONAL
ECONOMICS GROWTH AND INCOME DISTRIBUTION IN INDONESIA
By
Azwardi, Anna Yulianita, Sukanto *
ABSTRACT
This research is aimed to define the Impact of Central Government Expenditure in APBN and Regional Government Expenditure in APBD to Interregional Economics Growth and Income Distribution in Indonesia. The method used in the research is “Output Multiplier” and “Income Multiplier” based on Interregional Social Accounting Matrix 2007 which is developed by using Non-survey Method.
Based on the result of research, it is defined that the value of Java total multiplier is influenced higher than outer Java (96.043 > 35.478; 48.525 > 10.683). All value of Interregional Multiplier outer Java-Java is higher than Java-outer Java (0.00053 > 0.00001; 0.000724 > 0.00132; 0.00025 > 0.00014). The value of Java Intraregional multiplier is higher than outer Java (0.08625 > 0.02054; 82.73716 > 15.22092; 0.05040 > 0.01405; 48.36464 > 10.41725).
The Routine Expenditure of Central Government and Regional Government is influenced making Income Multiplier for households higher than Development Expenditure (0.10062 > 0.0020; 0.1009 > 0.0020; 0.1024 > 0.0046; 0.1020 > 0.0046). The value of Interregional income multiplier outer Java-Java is higher than Java-outer Java for both Governments and Expenditures (0.0110 > 0.00024; 0.6094 > 0.0008; 0.0082 > 0.0003; 0.6094 > 0.0008). Based on the number of Intraregional Income Multiplier, so outer Java household got higher impact compared by Java, except the development expenditure of central government (0.10135 > 0.10038; 0.00181 > 0.00125; 0.1011 > 0.1005; 0.0018 < 0.00125).
The Output Multiplier Value of both Micro region in 2007 has relatively same types, in which the development expenditure is causing the impact higher than the routine expenditure, except in outer Java in which the development expenditure is causing the impact to output lower than the routine expenditure (33.270 > 9.994; 33.2703 > 6.7842; 0.2924 > 0.1161; 0.2924 < 12.0496). The development expenditure and the routine expenditure in Intraregional Java make output multiplier higher than Intraregional outer Java (9.9706 > 0.0580; 33.1956 > 0.1462; 6.0225 > 6.0248; 33.1956 > 0.1462). In both micro regions, the highest output multiplier impact accepted by manufacture sector followed by utilities, services, agriculture, and mining sectors.
Key Words: The Impact of Central Government and Regional Expenditure,
ABSTRAKSI
Penelitian ini bertujuan untuk menganalisis Dampak Pengeluaran Pemerintah Pusat dalam APBN dan Pengeluaran Pemerintah Daerah dalam APBD terhadap pertumbuhan Ekonomi antardaerah dan Distribusi Pendapatan di Indonesia. Metode yang digunakan dalam penelitian ini adalah Multiplier Output antardaerah berdasarkan Neraca Sosial Ekonomi 2007 yang dikembangkan dengan menggunakan Metode Non-survei.
Berdasarkan hasil penelitian, diketahui bahwa nilai total multiplier Jawa lebih tinggi dari luar Jawa (96,043> 35,478; 48,525> 10,683). Semua nilai multiplier antar Jawa-luar Jawa lebih tinggi daripada luar Jawa-Jawa (0,00053> 0,00001; 0,000724> 0,00132; 0,00025> 0,00014). Nilai multiplier antar Jawa lebih tinggi dari luar Jawa (0,08625> 0,02054; 82,73716> 15,22092; 0,05040> 0,01405; 48,36464> 10,41725).
Pengeluaran Rutin Pemerintah Pusat dan Pemerintah Daerah menyebabkan Multiplier pendapatan rumah tangga lebih tinggi dari Pengeluaran Pembangunan (0,10062> 0,0020; 0,1009> 0,0020; 0,1024> 0,0046; 0,1020> 0,0046). Nilai multiplier pendapatan antardaerah luar Jawa-Jawa lebih tinggi dari Jawa-luar Jawa baik untuk pengeluaran rutin dan Belanja (0,0110> 0,00024; 0,6094> 0,0008; 0,0082> 0,0003; 0,6094> 0,0008). Berdasarkan jumlah Multiplier pendapatan antardaerah, ternyata rumah tangga luar Jawa mempunyai dampak yang lebih tinggi dibandingkan dengan Jawa, kecuali pengeluaran pembangunan pemerintah pusat (0,10135> 0,10038; 0,00181> 0,00125; 0,1011> 0,1005; 0,0018 <0,00125).
Nilai Multiplier pendapatan dari kedua wilayah tersebut pada tahun 2007 memiliki tipe yang relatif sama, di mana pengeluaran pembangunan menyebabkan dampak yang lebih tinggi dari pengeluaran rutin, kecuali di luar Jawa ternyata pengeluaran pembangunan menyebabkan multiplier pendapatan lebih rendah dari pengeluaran rutin Pengeluaran pembangunan dan pengeluaran rutin di Jawa intraregional menghasilkan multiplier pendapatan lebih tinggi dari antardaerah luar Jawa (9,9706> 0,0580; 33,1956> 0,1462; 6,0225> 6,0248; 33,1956> 0,1462). Pada kedua wilayah mikro, dampak multiplier pendapatan tertinggi diterima oleh sektor manufaktur diikuti oleh pelayanan publik, jasa, pertanian, dan sektor pertambangan.
Budget policy established by the Central Government through the State Budget
and Local Government through the Budget will affect the transfer of resources, incidence
and output effects (Musgrave, 1959; 205-231). Significant budgetary role, particularly in
financing development budgets cause problems in the regional autonomy is still much
debated by the regions.
This phenomenon arises because so far in Indonesia there are vertical fiscal
imbalance and horizontal fiscal imbalance, so that eventually lead to disparities among
regions (regional Inequality), especially between Java and outside Java (Tirta Hidayat,
1992; 271-273; Luky Eko Wuryanto, 1996; 173-179; Pande Raja Silalahi, 2000; 87-101;
Sjafrijal, 2000; 11-16).
Enactment of Law No. 22 Year 1999 which was then replaced by Act No. 32 of
2004 and Act No. 25 of 1999 which was replaced by Act No. 33 of 2004 brought a huge
impact on the economy of the region (Tulus Tambunan, 2001).
Research on the impact of fiscal decentralization on economic performance
among regions using interregional Social Accounting Matrix is still relatively limited,
among others, to Indonesia conducted by Hidayat and Damayanti (1992), Luky Eko
Wuryanto (1996) and Azwardi (2007).
Research conducted by Luky Eko Wuryanto with the object transfer before the
regional autonomy (block Inpres and Spesipic Inpres), whereas the study by Azwardi
(2007) in the context of the state budget and 2001 budget years after the region
autonomy.
To answer the impact of fiscal decentralization required a comprehensive study
by including factors of production, the institutions that form the central government and
local governments, households and firms as well as the activities of production or output
markets, to include all activities contained in the overall economy using Social
Accounting interregional approach Interregional Social Accounting Matrix (IRSAM).
In a study earlier Azwardi (2007) using Table IRSAM 2001, which in this research
study will be developed by building Table IRSAM in 2007, so the impact of the
implementation of fiscal decentralization on economic growth and income distribution
among regions after seven years of implementation of regional autonomy in a more real
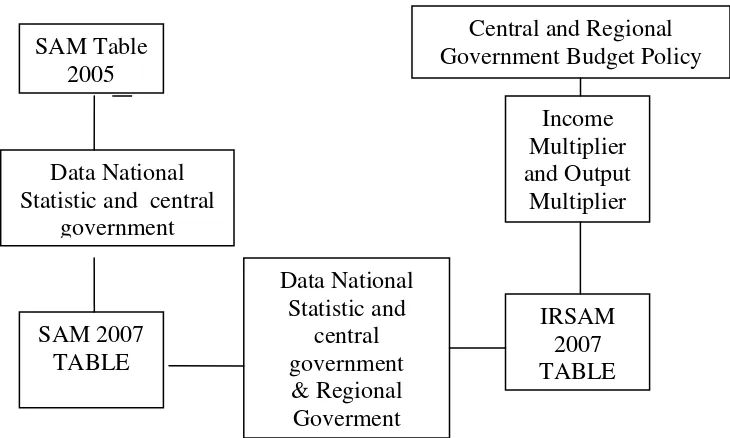
2. Conceptual Frame
Table 1. Research Framework
Table SAM aims to provide a comprehensive illustration of the initial distribution
of consumption, income and consumer good production factors, producers and
government in an economy. Such information is useful to know the economic growth,
income distribution, welfare and the evaluation of various economic performance
(Wuryanto, 1996; 83-84).
SAM table shows the activity of production that can be classified according to the
skills of workers, types of capital, and land classification. The results show factor income
distribution income sources for each calculation of institutions that are divided based on
socio-economic groups, which are companies, and government. In Table SAM double
entry principle used in making the Social Accounting Matrix, which is equal to revenue
expenditure.
SAM has a high capacity as a model of economic analysis. Multiplier analysis
can be implemented by making the inverse matrix A, so the multiplier obtained by
accounting and priced fixed price multiplier that can be used to analyze the impact of a
policy towards socio-economic conditions. Table SAM can be divided into two types,
namely the Social Accounting Matrix for a single economy and Inter Regional Social
Accounting Matrix or IRSAM which tends to give you a traffic inter-area economy.
IRSAM
Statistic and central
Multi-Regional and Inter Regional I-O (Miller-Blain, 1985). The basic structure making
IRSAM in principle a merger of Multi-Regional SAM each area to be done IRSAM or
breakdown of the national SAM IRSAM using regional indicators, and expect to be
known interregional feedback effects resulting from an applied policy (Thorbecke, 1998;
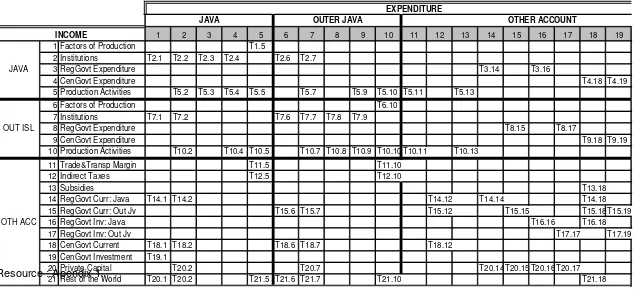
Table 1.
Structure IRSAM 2007 Table
Resource : Apendix 1.
1 2 3 4 5 6 7 8 9 10 11 12 13 14 15 16 17 18 19 1 Factors of Production T1.5
2 Institutions T2.1 T2.2 T2.3 T2.4 T2.6 T2.7
3 RegGovt Expenditure T3.14 T3.16
4 CenGovt Expenditure T4.18 T4.19
5 Production Activities T5.2 T5.3 T5.4 T5.5 T5.7 T5.9 T5.10 T5.11 T5.13 6 Factors of Production T6.10
7 Institutions T7.1 T7.2 T7.6 T7.7 T7.8 T7.9
8 RegGovt Expenditure T8.15 T8.17
9 CenGovt Expenditure T9.18 T9.19
10 Production Activities T10.2 T10.4 T10.5 T10.7 T10.8 T10.9 T10.10 T10.11 T10.13 11 Trade&Transp Margin T11.5 T11.10
12 Indirect Taxes T12.5 T12.10
13 Subsidies T13.18
14 RegGovt Curr: Java T14.1 T14.2 T14.12 T14.14 T14.18 15 RegGovt Curr: Out Jv T15.6 T15.7 T15.12 T15.15 T15.18 T15.19
16 RegGovt Inv: Java T16.16 T16.18
17 RegGovt Inv: Out Jv T17.17 T17.19
18 CenGovt Current T18.1 T18.2 T18.6 T18.7 T18.12 19 CenGovt Investment T19.1
20 Private Capital T20.2 T20.7 T20.14 T20.15 T20.16 T20.17 21 Rest of the World T20.1 T20.2 T21.5 T21.6 T21.7 T21.10 T21.18
OTHER ACCOUNT EXPENDITURE
JAVA
INCOME
OUT ISL
OTH ACC
3. Result and Analysis
Based on the results of the study (2007) found that: First, the total value of the
multiplier is bigger than Java Outside Java (96.043> 35.478, 48.525> 10.683, except for
the total value of the multiplier factor of production higher than that of Java, Java
(11.892> 6.404); Second, the entire value of interregional multiplier Outside
Java-Java-Java is bigger than Outside Java-Java-Java (0.00053> 0.00001; 0.000724> 0.00132, 0.00025>
0.00014; Third, variations in the value of intraregional multiplier are relatively similar to
Java Outside Java, although the value of intraregional multiplier is bigger than Java
Outside Java (0.08625> 0.02054, 82.73716> 15.22092, 0.05040> 0.01405, 48.36464>
10.41725).
Based on empirical results of this research note that the total multiplier of Java is
bigger than Java when compared with previous research. Also tends to shrink the
multiplier value if compared with previous research.
Based on these annotations can be stated that economic structure among
regions in Indonesia during the period of 1990-2007 has been amended, particularly in
terms of total multiplier.
In the year 2007 based on the value of intraregional and interregional showed a
pattern that is almost not different relative to previous years, except for institutions
outside of Java, intraregional value is relatively higher compared with Java. These
changes occurred along with the implementation of regional autonomy and fiscal
decentralization, in which the central government's affairs handed over to local
governments.
In the year 2007 routine expenditures made by central and local governments
tend to provide a multiplier on household income greater than expenditures for
development (0.10062> 0.0020, 0.1009> 0.0020, 0.1024> 0.0046.This condition is in
stark contrast when compared with research in 2001, the year 1990 and year 1985,
where the income multiplier greater development spending compared with routine
expenditures.
Interregional income multiplier value-Java Outside Java is bigger than Outside
Java-Java for both types of government and the two types of expenditure, (0.0110>
0.00024, 0.6094> 0.0008, 0.0082> 0.0003, 0.6094> 0.0008). But the difference between
the two interregional in research in 2001 and in 2007 was relatively smaller. This
condition implies that if there was an increase in government spending outside of Java,
Based on the number of intraregional income multiplier of Java, then the
household obtained a greater impact when compared with the outside of Java, except
for central government development expenditure (0.10135> 0.10038, 0.00181> 0.00125;
0.1011> 0.1005 ; 0.0018 <0.00125). When viewed according to the value of intraregional
multiplier on household income micro areas of Java, the biggest impact received by
rumahtangga West Java, while outside of Java, Sulawesi received by the household.
When compared with the results of research in 2001, the biggest impact for households
accepted by the Outer Java Sumatra.
When compared with the year 2001, the second multiplier output value of the
micro region in year 2007 had a relatively similar pattern, which provides development
spending much greater impact than routine expenditures, except for outside of Java,
where the expenditure of development impact on output is much smaller than with
routine expenditures (33.270> 9.994; 33.2703> 6.7842, 0.2924> 0.1161; 0.2924
<12.0496).
Development expenditures and expenditures on intraregional Java routine
provides output multiplier larger than intraregional Outside Java (9.9706> 0.0580;
33.1956> 0.1462, 6.0225> 6.0248; 33.1956> 0,1462). In both regions the largest
micro-impact multiplier output is received by the manufacturing sector followed by the sectors
of utilities, services, agriculture and mining.