64
Genotoxicity, haematological and growth performance of the African catfish
Clarias gariepinus
fingerlings fed walnut
Tetracarpidium conophorum
leaves
to substitute for rice bran
Simeon Oluwatoyin Ayoola*, Adebola Afolashade Bamiro
Department of Marine Sciences, University of Lagos, Lagos State, Nigeria. *Corresponding Author: email: sayoola@unilag.edu.ng, soaayoola@yahoo.com
ABSTRACT
A plant has become a preferred source of protein for fish species in aquaculture. A twelve-week feeding trial was carried out in order to assess the effect of feeding walnut leaves on haematological and biochemical parameters as well as the genotoxicity level on Clarias gariepinus fingerlings as a bio-indicator of their health status and overall response of the fish towards the experimental diets. One hundred and fifty fingerlings of Clarias gariepinus of mean weight 6.90±0.2g were stocked randomly as ten fish per tank (52.5 X 33.5 X 21 cm3) in triplicate. Fish were fed to satiation and the water changed every day to maintain good
water quality. Five experimental diets with 40% crude protein each were formulated; the control, without the test ingredient and the other four diets (test diets1, 2, 3 and 4) contained 25%, 50%, 75% and 100% inclusion respectively. The Control diet had the highest mean weight gain (P < 0.05) (118.8±17.3) among the entire group. A similar pattern was observed in specific growth rate. The least significant (P < 0.05) feed conversion ratio was recorded by the Control diet(0.68±0.03), the diet also recorded the best protein efficiency ratio (3.53±0.23).The genotoxicity test shows that some Micronucleus of the test diets were normal, lobed and binucleated nucleus compared to the Control diet. The fish fed with T. conophorum
showed a significant difference in haematological values when compared to the values of fish fed the control diet. The fish fed with T. conophorum showed a significant difference in biochemical value when
compared with control diet. There was a reduction in the biochemical values of the fish fed T. Conophorum
with Cholesterol (2.20±0.05) Albumin (8.35±0.21) and Triglyceride (0.98±0.13) compared with the values of fish fed with the control diet with cholesterol (3.81±0.07) Albumin (12.35±2.33) and Triglyceride (7.29±7.02). It was concluded that using T. Conophorum leaves as feed for Clarias gariepinus enhances the growth of the fish. Therefore, partial replacement of feed T. Conophorum should be encouraged.
Keywords: Bio indicator; Genotoxicity; Utilization; Clarias gariepinus; Walnut leaves
INTRODUCTION
Aquaculture has evolved as the fastest growing food-producing sector and developed as an important component in food security (Ibrahem et al., 2010). Over the past decades, aquaculture has grown consistently in response to an increasing demand for fish as a source of protein globally (Akinrotimi et al., 2007). This is because the total production from commercial fishing activities in the world has reached its peak and fish catch now reduces on a constant basis. In fact, aquaculture has become the fastest growing food production sector of the world, with an average annual increase of about 10% since 1984 as compared to 3% increase for livestock meat and 1.6% increase for capture fisheries (FAO, 1997).
Therefore, in order to attain more economically, sustainable, environmentally friendly and viable production, research interest has been directed towards the evaluation and use of nonconventional sources of plant protein (Tacon, 1990). In fish culture, nutrition plays an important role in the maintenance of a healthy and marketable product. During the last decade, there has been a marked increase in the use of extruded diets for feeding fish. These diets have superior water stability, better-floating properties and a higher energy than pelleted diets (Hilton et. al., 1981). The main effects on fish are an increase in fish growth and an improvement in feed conversion (Robert et al., 1993). Fish is one of the sources of proteins, vitamins, and minerals, and it has essential nutrients required for supplementing both infants and adults diet (Abdullahi et al.,
65
2001). In Nigeria, fish is eaten fresh and smoked and form a much-cherished delicacy that cut across socio-economic, age, religions and educational barriers (Adebayo et al., 2008).
The African mud catfish (Clarias gariepinus) is an economically important cultured fish species in Nigeria for its excellent biological characteristics such as fast growth, popular taste, and high economic value, and therefore become a very popular species for aquaculture worldwide (Muchlisin et al., 2010). Several studies have shown that plant protein sources have high potentials for supplying fish with required protein needed for their maximum productivity (Hasting, 1976; Abidin et al., 2006; Nwanna et al., 2008). The inclusion of plant protein sources in the ration of fish requires investigation on limiting factors in the plant ingredients such as high crude fibre content and anti-nutritional factors as earlier investigations on some plants have shown that their excessive inclusion in the feed may result in slower growth rates and general poor performance of cultured fish species (Cho et al., 1976; Francis et al., 2001; Alegbeleye et al., 2001; Nwanna et al., 2008).
Walnut leaf can be used as a growth promoter and it's known to have the ability to improve the absorptive capacity of the intestine via structural alteration (Oladiji et al., 2010). Fish haematology is gaining increasing importance in fish culture because of its importance in monitoring the health status of fish (Hrubec et al., 2000). Haematological characteristics of most fish have been studied with the aim of establishing normal value range and deviation from it may indicate a disturbance in the physiological process (Rainza-paiva et al., 2000).Changes in enzymes profiles are important toxicity indices (biomarkers) and have been used to assess the biochemical and physiological health of vital organs (tissues) in fishes (Van der Oost et al., 2000; Gabriel and George, 2005).
A research was carried out by Bello et al. (2013), on the Investigation into the healing properties of walnut (Tetracarpidium conophorum) leaf and onion (Allium cepa) bulb residues in Clarias gariepinus. Walnut leaf has been safely used through the centuries as a home remedy for skin conditions. High concentrations (up to 10%) of astringent compounds called tannins account for most of the healing qualities in walnut leaf preparations and proof more advantage over other herbal plants.
The study evaluated the effect of dietary inclusion levels of a walnut leaf (WL) and onion bulb (OB) residues on dermal wound healing of Clarias gariepinus. Research has not been carried out on the use of walnut leaves as a replacement of rice bran in fish feed for Clarias gariepinus. The objectives of this study are to determine the effect of walnut leaves on the growth of Clarias gariepinus and the effect of walnut leaf in the blood of Clarias gariepinus, protein utilization and carcass composition as well as genotoxicity. This study will examine the utilization of walnut leaves for sustainable fish production.
MATERIALS AND METHODS
Experimental design
66
into powder using Hammer mill and stored in a dry labelled container. A small quantity was taken to Jagdee Laboratory, Ibadan, Oyo state.
Experimental procedure and setup
The fishes were put in plastic tanks (52.5 x 33.5 x 21 cm3) under standard condition; Temperature (27.5 - 29.5oC), dissolved oxygen (4.5 -4.8 mg/l), and pH (7.3 - 8.0). The fish were allowed to acclimatize for two weeks in plastic tanks, and fed with 2 mm Coppens feed (40 % crude protein) to satiation before the commencement of the experimental work.
After the two weeks of acclimatization, the fish were sorted by size and reweighed using a digital scale (Camry EK 5055) and the averaged weight was measured. A total of 150 catfish fingerlings were randomly stocked into the tanks at the rate of ten (10) fish per tank using a scoop net, on the bases of their body weight into fifteen tanks in triplicate, with an average weight of 6.90 g per fish. Suitable conditions were maintained by cleaning the tanks and constant changing of water took place every day. Each of the tanks was cleaned by washing the tanks properly with detergent and rinsed with salt solution water, then dried, filled with water and were stocked with 10 fingerlings. Water was filled to the 15cm height of the container which is about 2/3 of the volume of each tank. Water was continuously supplied from a borehole at the back of the experimental site. The water level was maintained at a level of 15cm throughout the experimental period. Five experimental diets with 40% crude protein each were formulated; the control, without the test ingredient and the other four diets (test diets1, 2, 3 and 4) contained 25%, 50%, 75% and 100% inclusion respectively. The test fish were fed for 12weeks.The mean weight gain of the specimen in each of the experiments tanks were obtained at the end of every week. The tanks were labelled Co, T1, T2, T3, and T4 each having triplicates. The tanks labelled represent each of the feeding regimes.
The initial weight of the fish in each tank was determined at the beginning of the experiment and recorded and afterward, they were weighed weekly using the weighing scale Camry EK5055 Max. 5kg/11lb d=1g/0.05oz).
Parameters
Mean weight gain (MWG)
The weight Gain was calculated using the formula: Weight gain (g) = Wf -Wi Where: Wf = Final average weight (g), Wi= Initial average weight (g) Feed conversion ratio (FCR)
This is the amount of unit weight of feed the fish was able to convert to flesh. FCR = Average food supplied (g)
Body weight gain (g) Protein efficiency ratio (PER)
This was calculated from the relationship between the increment in weight of fish (i.e. weight gain of fish) and protein consumed.
PER = Mean weight gain (g) Protein Intake (%) Specific growth rate (SGR)
SGR = (Loge W1 (g) – Loge W2 (g) × 100 T2 - T1 (day)
67
Daily growth rate (DRG)
DRG (g day-1) = Weight gain (g) T2 – T1 (day) Protein intake (PI)
Protein intake was calculated using the formula: PI= feed intake x ppercentages of protein in the diet.
Gross food conversion efficiency (GFCE)
This was calculated as the reciprocal of the FCR expressed as a percentage as follow: GFCE = 1 x 100
FCR
Percentage weight gain per week (PWG)
PWG= Final weight - Initial weight x 100 Initial weight
Nitrogen metabolism (Nm)
The Nitrogen metabolism is determined by the formula: Nm = (0.549) (b-a) h
2
Where, a=initial weight of fish (g), b =final weight of fish (g), h = experimental period of experiment (day)
Determination of water quality parameters
The water pH was measured with a Phillip meter (model pH-009 111), with a glass electrode. The electrodes were standardized using buffer solution and washed with distilled water. It was thereafter washed with the sample water to be tested, dipped into the water and pH was read on the scale. Dissolved Oxygen (DO) was measured with DO meter (MODEL EUTECH DO 600), water temperature was determined by simple mercury in glass thermometer, calibrated in centigrade (oC). It was immersed in the plastic tank for about five minutes and the level of the mercury was read on the graduated glass tube.
Extraction of blood from fish
The fishes were taken from each tank using a small hand net and each of the fish was held firmly then placed belly upward to show the ventral region using a dry towel. The blood was extracted from close to the anal region and also around the caudal peduncle with the aid of a 2cm3 plastic syringe and the blood was dispensed immediately into Ethylene Diamine Tetracetic Acid (EDTA) anticoagulant bottle to prevent clotting for the haematological studies. Blood samples were collected via the caudal vein puncture as described by Kori-Siakpere et al. (2005) into labelled ethylene diamine tetra-acetic (EDTA) bottles and sterile plain sample bottles.
Haematological analysis
The blood sample of fish taken at random from each tank was collected in both syringe and heparinized bottles for haematological assay and taken to Haematology Laboratory, Department of Clinical Science, Lagos Teaching Hospital. Haemoglobin (Hb), red blood cells (RBC), white blood cells (WBC) and packed cell volume (PCV) were analyzed. Mean Corpuscular Haemoglobin Concentration (MCHC), Mean Corpuscular Haemoglobin (MCH) and Mean Corpuscular Volume (MCV) were calculated according to the formulae given by Dacie and Lewis (2001).
Biochemical analysis
68
centrifugation from the lithium heparinised samples were stored at 200C until analysed. The plasma was analysed for Triglyceride, Urea, Creatinine, Alkaline phosphate (ALP), Total protein, Cholesterol, and Albumin, Aspartate Aminotransferase (AST), Alanine Aminotransferase (ALT).Cholesterol and Triglycerides were also determined using enzymatic colorimetric test. Genotoxicity
A single drop of blood is placed on the surface of a clean and grease-free microscope slide at a distance of 2 cm from one end. The blood smear is created by carefully extending this drop of blood in a uniform fashion with the edge of a second slide held at a 45º angle to the first. Once prepared, the blood smear slide is dried by gently waving it in the air (Conroy, 2009).
Proximate analysis
The proximate composition of fish carcass taken from each treatment tank after the experiment was analysed. The crude protein, crude fat, ash, NFE, moisture content and dry matter were determined according to the Association of Analytical Chemists Method (AOAC, 1990). Data Analysis
The data obtained were statistically evaluated using student test. The data were subjected to one-way analysis of variance (ANOVA). The data include mean, standard deviation, while the means were compared for significant differences using Duncan's multiple range tests using statistical package for the social sciences (SPSS) 10 packet programs.
RESULTS
Proximate composition of the experimental diet
Tables 1 and 2 shows the percentage composition of the experimental feeds. The experimental feed was formulated with varying inclusion levels of walnut leaves at 0%, 25%, 50%, 75%, and 100%. The proximate composition of Tetracarpidium conophorum leaves in percentage are crude protein is 29.75%, The Percentage Ash, Crude Fibre, Crude Fat, Moisture And Nitrogen Free Extract(Carbohydrate CHO) were 10.8 %,16.28%,6.90%,7.7% and 28.07%.
Proximate composition of the carcass
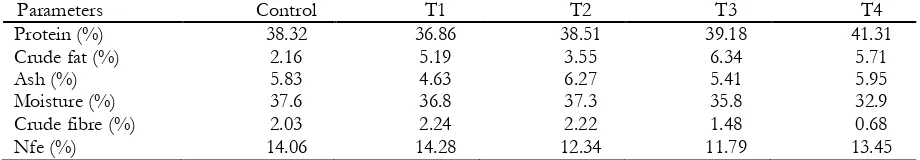
The proximate composition of the carcass of Clarias gariepinus after 12weeks of the experiment was determined and represented in Table 4.The Test diet 4 (100% of T. conophorum) had the highest protein content of 41.31 and test diet 1(25% of T. conophorum) had the lowest protein content of 36.86.The highest crude fat content was in the carcass fed with Test diet 3 (75% of T .conophorum) while the lowest fat content was in carcass fed with Test diet 2(50% of T. conophorum). Ash content was highest in carcass fed with Test diet 2 (50% of T. conophorum. While the lowest was in carcass fed with Test diet 1 (25% of T. conophorum). Moisture content was highest in the carcass fed with the Control diet and lowest in carcass fed Test diet 3 (75 % of T. conophorum). Crude fiber was highest in the carcass fed with Test diet 1 (25% of T. conophorum) and lowest in the test diet 4(100% of T. conophorum). NFE composition was highest in carcass fed with Test diet 1 (25% of T.conophorum) and lowest in carcass fed Test diet 3 (75 % of T.conophorum) Water quality parameters
69
Table 1. Feed composition of experimental diet used in this study
Ingredients Co (g) T1 (g) T2 (g) T3 (g) T4 (g)
Table 2. Proximate composition of Tetracarpidium conophorum leaves
Table 3. Water quality parameters of the experimental tanks
Parameters Ranges Mean and Standard
Deviation
Table 4. Proximate composition of carcass of C. gariepinus fed Tetracarpidium conophorum leaves
Parameters Control T1 T2 T3 T4
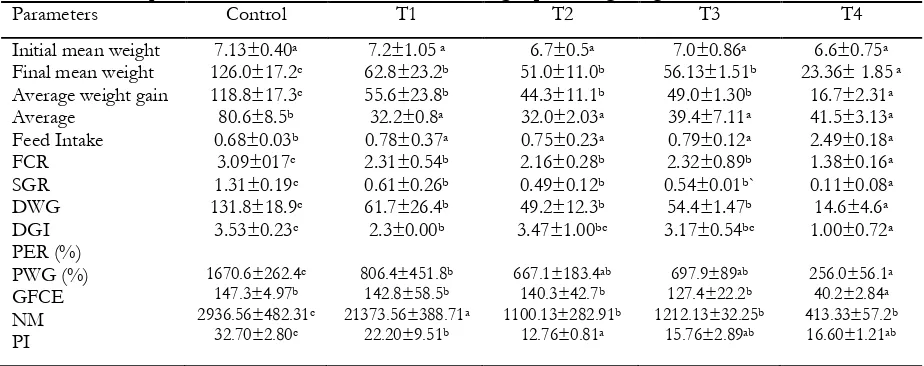
The growth parameters and nutrient utilization of Clarias gariepinus fed with T. conophorum at different levels of inclusion are shown in Table 5. The initial weight of the experimental fish was not significantly different (P >0.05) from each other. The final weight of the experimental fish in
70
T2, T1, and T3 were not significantly different (P>0.05) from each other but they were significantly different from (P<0.05) from the final weight of fish in T4 and Co (control diet).The highest average weight gain of fish (118.8±17.3g) was recorded in fish fed with the control diet while the least weight gain (16.7±2.31g) was recorded in fish fed Test diet 4 (100% of T. conophorum). The fish in tank T2, T1 and T3 have average weight gain were not significantly different (P >0.05) from each other but they were significantly different (P<0.05) from fish in T4 and Co .Similar pattern was recorded for the Specific Growth Rate (SGR) of the experimental fish. The highest SGR (3.09±017) was recorded for the fish fed with the control diet while the least was recorded by fish fed with Test diet 4 (100% of T. conophorum) (1.38±0.16). There was no significant difference (P >0.05) between the Specific Growth Rate of the fish in Tank fed with T2, T1, and T3 but they were significantly different (P<0.05) from fish in T4 and Co. Although the fish fed with the Control diet ate more feed compared to the Test diets. There was no significant difference (P >0.05) between the Average feed intake of the fish in Tank fed with T2, T1, and T3 but they were significantly different (P<0.05) from fish in T4 and Co.
The highest Food Conversion Ratio (FCR) (2.49±0.18) was recorded by fish fed with Test diet 4 (100% of T. conophorum) while the lowest and the best FCR was recorded in fish fed with the Control Diet (0.68±0.03). The FCR of the fish were significantly different (P<0.05) from each other. The Daily weight Gain (DWG) range value recorded had its highest (1.31±0.19) in fish fed the Control diet and lowest value (0.11±0.08) in fish fed with Test diet 4 (100% of T. conophorum).There was a significant difference (P<0.05) between the Control diet and the fish fed with Test diet 4 (100% of T. conophorum).The highest protein intake, (32.70±2.80) was recorded in fish fed with the control diet. There was no significant difference (P >0.05) between fish in T3, T2, and T4 but they were significantly different (P<0.05) from fish fed with the Control diet and T1 (25% of T. conophorum). The Protein Efficiency Ratio (PER) (3.53±0.23) was highest in the fish fed with the Control diet. There was no significant difference (P >0.05) between fish fed with the Control diet, T2, and T3 but they were significantly different (P<0.05) from fish fed with T1 and T4.The fish fed with the control diet had the highest Nitrogen metabolism value (2936.56±482.31) and fish fed with Test diet 4 (100 % of T. conophorum) had the lowest value (413.33±57.2).
Table 5. Growth parameters and nutrients utilization of C. gariepinus fingerlings fed with the various diet.
Parameters Control T1 T2 T3 T4
71
Haematological and biochemical compositions
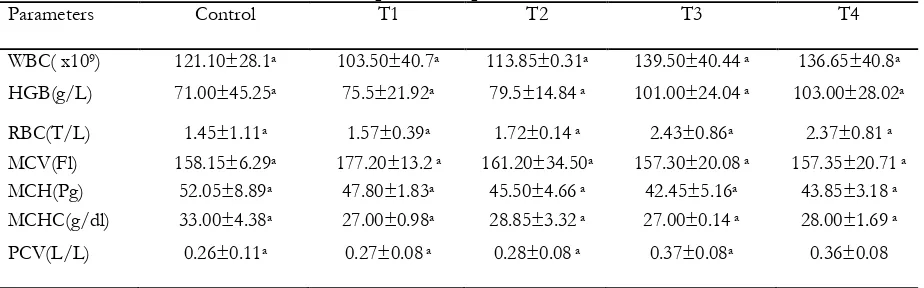
The haematological studies for the fish in all the treatment tanks showed from the White blood cell(WBC), Erythrocytes (RBC), Haemoglobin (Hb), Mean Corpuscular Volume(MCV), Mean Corpuscular Haemoglobin (MCH), Mean Corpuscular Haemoglobin (MCHC), Haematocrit or Packed Cell Volume (HCT/PCV) shows that there was no significant difference (P >0.05) among the tanks (Table 6).
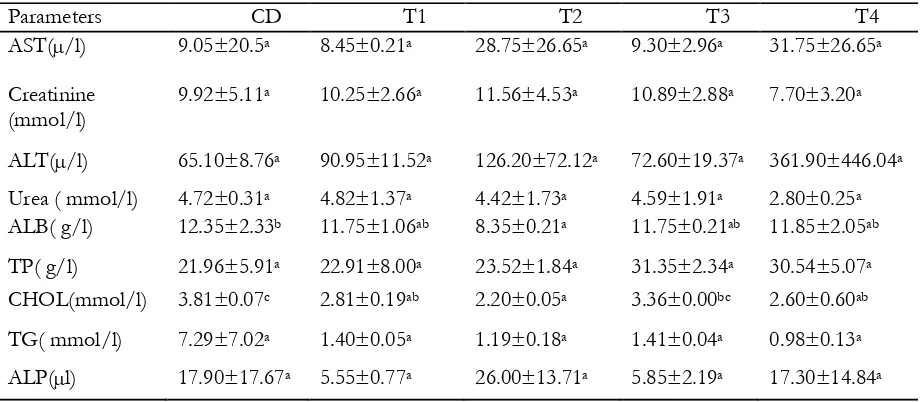
The plasma biochemical was analyzed for each of the experimental tanks and the result is represented in Table 7. The Aspartate Aminotransferase (AST) had its highest value 31.75±26.65 (µ/l) in T4 (100% of T. conophorum) and lowest value 8.45±0.21 (µ/l) in T1 (25 % of T. conophorum) and Significant difference (P >0.05) was not observed between the tanks. The highest level 11.56±4.53 (mmol/l) of Creatinine was recorded in T2 (50 % of T. conophorum) and lowest level 7.70±3.20 (mmol/l) was recorded in T4 (100% of T. conophorum).Alanine Aminotransferase (ALT) highest level of 361.90±446.04 (µ/l) was recorded in T4 (100 % of T.conophorum) and the lowest level of 65.10±8.76 (µ/l) in the Control diet.The urea level had its highest value 4.82±1.37 in T1 (25% of T. conophorum). And lowest level of 2.80±0.25 was recorded in T4 (100 % of T. conophorum). The Cholesterol level mean value range from 2.20±0.05 at T2 (50 % of T. conophorum) to the highest value of 3.81±0.07 in the Control feed but they were significantly different from each other. The Albumin has its lowest value as 8.35±0.21 in T2 (50 % of T. conophorum) and 12.35±2.33 in the control diet as its highest. There was no significant difference (P>0.05) between T1, T3, and T4 but they were statistically different (P<0.05) from the Control Diet and the T2 (50 % of T. conophorum).
Table 6. Haematological parameters of Clarias gariepinus fingerlings fed different levels of Tetracarpidium conophorum leaves.
Parameters Control T1 T2 T3 T4
WBC( x109) 121.10±28.1a 103.50±40.7a 113.85±0.31a 139.50±40.44 a 136.65±40.8a HGB(g/L) 71.00±45.25a 75.5±21.92a 79.5±14.84 a 101.00±24.04 a 103.00±28.02a
RBC(T/L) 1.45±1.11a 1.57±0.39a 1.72±0.14 a 2.43±0.86a 2.37±0.81 a MCV(Fl) 158.15±6.29a 177.20±13.2 a 161.20±34.50a 157.30±20.08 a 157.35±20.71 a MCH(Pg) 52.05±8.89a 47.80±1.83a 45.50±4.66 a 42.45±5.16a 43.85±3.18 a MCHC(g/dl) 33.00±4.38a 27.00±0.98a 28.85±3.32 a 27.00±0.14 a 28.00±1.69 a
PCV(L/L) 0.26±0.11a 0.27±0.08 a 0.28±0.08 a 0.37±0.08a 0.36±0.08
72
Table 7. Biochemical compositions of Clarias gariepinus fingerlings fed different levels of Tetracarpidium conophorum leaves
Means with the same superscripts along the vertical row are not significantly different (p>0.05).
Genotoxicity activity
The fish fed with the Control diet, the normal erythrocytes was observed and it contains the elliptical nuclei with a small non –refractive circular particles lying in the cytoplasm and resembling a nucleus with respect to staining properties were considered as normal micronucleus. For the Test diet1 (100% of T. conophorum) and Test diet 2 (50% of T. conophorum) the erythrocytes showed that some of the nuclei were normal while few nuclei clearly deviated from the normal shape having cells with two nuclei of approximately same size and staining pattern and staining intensity and within the same cytoplasmic boundary and were considered as binucleated. Deviations from the normal shaped were also observed in Test diet 3 (75% of T. conophorum) and Test diet 4 (100% of T. conophorum)having binucleated cells, lobed -which have is an evagination of the nuclear membrane having several lobes and some of the nuclei had normal shapes.
DISCUSSION
The feeding trials revealed that Clarias gariepinus responded to all the diets irrespective of their composition, however it showed that the inclusion of T. conophorum affected the palatability of the diets which was observed by slow feeding response; this could be attributed to the taste or the smell of the feed. The Total feed intake was highest in the Control diets as seen in Table 6.The fish fed with the control diet also had the lowest and best FCR which showed that it was able to covert the feed fed into fish flesh while the Test diet 4( 100% of T. conophorum) showed a poor Feed conversion rate. Poor PER (1.00±0.72) was observed in Test diet 4 (100 % of T. conophorum) this could be attributed to the formation of a poorly digestible complex between phytic acid and protein, which could result in reduced bioavailability of minerals other than zinc. The complex so formed could impair protein digestibility through the formation of phytic acid-protein complexes or inhibition of digestive enzymes secretion (Robaina et al., 1995). Better growth and nutrient utilization were achieved at relatively low inclusion level compared to the high incorporation of the test ingredient.
Parameters CD T1 T2 T3 T4
AST(µ/l) 9.05±20.5a 8.45±0.21a 28.75±26.65a 9.30±2.96a 31.75±26.65a
Creatinine (mmol/l)
9.92±5.11a 10.25±2.66a 11.56±4.53a 10.89±2.88a 7.70±3.20a
ALT(µ/l) 65.10±8.76a 90.95±11.52a 126.20±72.12a 72.60±19.37a 361.90±446.04a
Urea ( mmol/l) 4.72±0.31a 4.82±1.37a 4.42±1.73a 4.59±1.91a 2.80±0.25a
ALB( g/l) 12.35±2.33b 11.75±1.06ab 8.35±0.21a 11.75±0.21ab 11.85±2.05ab
TP( g/l) 21.96±5.91a 22.91±8.00a 23.52±1.84a 31.35±2.34a 30.54±5.07a
CHOL(mmol/l) 3.81±0.07c 2.81±0.19ab 2.20±0.05a 3.36±0.00bc 2.60±0.60ab
TG( mmol/l) 7.29±7.02a 1.40±0.05a 1.19±0.18a 1.41±0.04a 0.98±0.13a
73
The water quality parameters of the experimental setup were similar and within the optimum range recommended for the culture of C. gariepinus by Omitoyin (2006) when he worked on the Haematological changes in the blood of C. gariepinus juveniles fed with poultry litter.
According to Munkittrick and Leatherland (1983), haematocrit reading is valuable in determining the effect of stressors on the health of fish. The significant increase observed with increased test ingredient showed that the fish were not stressed from the test ingredient inclusion. Haemoglobin is a sophisticated oxygen delivery system that provides the desired amount of oxygen to the tissues under a wide variety of circumstances (Voet and Voet, 1990). According to Blaxhall and Daisley (1973), the determination of haemoglobin can be a good indicator of anemic conditions in fish with the recorded values in the present study; it showed that the fish did not suffer from any form of anemia. The increase observed in the two parameters (packed cell volume and the haemoglobin) may be due to high activity in the fish, according to Weiss and Wardrop (2010); fish with high activity will need more oxygen invariably having the need for increased PCV and haemoglobin.
However, these parameters decrease in the presence of anti-nutritional factors (Osuigwe et al., 2007). According to Ayoola et al. (2013) in the chemical evaluation and nutritive values of Walnut leaves; it was reported that the walnut leaves contain anti-nutritional factors (Alkaloids, saponins, and tannins). The tannins reduce blood cholesterol (Basu et al., 2007). Hence the reduction in the values of PCV and Hb observed in this study could be attributed to the presence of these anti-nutritional factors. This study corroborates the work of earlier researchers who reported a decrease in hematocrit and haemoglobin content with an increased level of ingredients (Blom et al., 2001). There was no significant difference (p>0.05) between the haematological values of fish fed with the control diet and the test diets this is in agreement with the work done by Ominiyi et al (2002). Gabriel et al. (2004) further reported no significant differences in the haematological values for apparently healthy C.gariepinus before and after acclimatization which was similar to the observation in this study.
The increase in the White Blood Cell (WBC) in the fish fed the T3 and T4 (75% and 100% of T. conophurum respectively) is attributed to the increased production of leucocytes in the haematopoietic tissue of the kidney perhaps the spleen, this agreed with work of Omitoyin (2006). The increase may also be as a result of an increase in leucopoiesis as a means of combatting stressor in the body system of the fish, similar findings were recorded by Gabriel et al. (2004) in C. gariepinus under confinement due to acclimated for 7 days. These changes in white blood cell have been reported to play important roles in the assessment of the state of health of C.gariepinus (Ezeri, 2001; Gabriel et al., 2004).The increase in the red blood cell and haemoglobin concentration may be attributed to the increase in the size of the fish as a result of growth in the fish. This is in agreement with Ayoola et al. (2013) who reported that both the haemoglobin contents and Erythrocyte counts (red blood cell) tend to increase with length and age of the fish.
Aspartate aminotransferase (AST) help in amino acid degradation and biosynthesis (WHO, 2003). Therefore, the significant change in the ALT, AST, and ALP might be impairment in the fish internal organ most especially the kidney. Total protein values were slightly lower than those reported by (Ayoola, 2011) and also the values were slightly lower than those reported by Omitoyin (2005), this may be due to the environmental condition of the rearing facilities and Handling.
74
treated groups compared to the Control, Similar findings were reported by Choudhury et al. (2005). The control diet had normal micronuclei while there were deviations from the normal shape in the fish fed with the test diets, some of the nuclei were mostly normal and some had abnormalities such as the binucleated and lobed nucleus, this is as a result of chromosome dysfunction. Hence the nucleus should be considered as indicators of structural genomic changes.
CONCLUSIONS
The result of this study revealed that the walnut leaves at 100 % inclusion affected the overall health status of the fish. This result seems to have a link with palatability of the diets which caused reduced feed, and also due to the presence of anti-nutritional properties of the walnut leaves. A processed walnut leaves with the extraction of the anti-nutritional factors might boost up the overall performance of the fish. However, since walnut leaf is more available and relatively cheaper, it could be recommended that partial replacement walnut leaf in the diet of C. gariepinus at 25% inclusion level would aid fish productivity.
REFERENCES
Abdullahi, S.A., D.S. Abolude, R.A. Ega. 2001. Nutrient quality of four ovens dried freshwater catfish in Northern Nigeria. J. Trop. Biosci. pp: 70. Keeping qualities of a scaly fish Tilapia, Oreochromis niloticus smoked with two energy sources. African Journal of General. Agriculture, 4(2):113-117.
Abidin, M.Z., R. Hashim, A.S.C. Chong. 2006. Influence of dietary protein levels on growth and egg quality in broodstock female bagrid catfish(Mystus nemurus Cuv. & Val.. Aquaculture Research, 37: 416-418.
Adebayo-Tayo, B.C., Onilude, A.A. , U.G. Patrick. 2008. Mycofloral of smoke-dried fishes sold in Uyo, Eastern Nigeria. World Journal of Agricultural. Science, 4(3):346-350.
Akinrotimi, O.A., U.U. Gabriel, D.O. Bekibele, D.N. Onunkwo, P.E. Anyawu. 2007. Locally produced fish feed, potentials for aquaculture development in Sub–Saharan. African Journal Agricultural Research, 2(7):287–295.
Alegbeleye, W.O., A.O. Oresegun, O.M. Omitoyin, 2001. Use of Bambara groundnut (Vigna subterranean) meal in the diets of Heteroclarias fingerlings. Moor Journal of Agriculture Research, 2: 54–59.
Ayoola P.B., O.E. Onawumi, O.P. Faboya, 2013. Chemical evaluation and nutritive values of African walnut leaf (Plukenetia conophora Mull.arg.). International Journal of Herbal Medicine, 1(3): 122-126.
Ayoola, S.O. 2011. Haematological characteristics of Clarias gariepinus (Burchell, 1822) juvenile's fed with poultry hatchery waste. Iranica Journal of Energy and Environment, 21: 18-23.
Basu, S.K., J.E. Thomas, N. Acharya, 2007. Prospects for growth in global nutraceutical and functional food markets: a Canadian perspective. Australian Journal of Basic Applied Science, 1(4): 637-649.
Bello, O.S., B.O. Emikpe, A.K. Olaifa, F.E. Olaifa. 2013. An investigation into the healing properties of walnut (Tetracarpidium conophorum) leaf and onion (Allium cepa) bulb residues in Clarias gariepinus. Archivos de Medicina Veterinaria, 45: 291-297.
75
Blaxhall, P.C., K.W. Daisley. 1975. Haematological assessment of the health of freshwater fish: a review of selected literature. Journal of Fish Biology, 4:593- 604.
Blom, J.H., K.J. Lee, J.Richard, K. Dabrowski, J. Ottobre. 2001. Reproductive efficiency and maternal offspring transfer of gossypol in rainbow t rout (Oncorhynchus mykiss) fed diets containing cottonseed meal. Journal of Animal Science, 79: 1533–1539.
Choudhury, D.A, N.P. Pal, S.C Murkejee. 2005. Dietary yeast RNA supplementation reduces mortality by Aeromonas hydrophilia in rohu juveniles. Fish Shellfish Immunology, 19: 281-291. Cho, C.I., S.J. Slinger, H.S. Bayley. 1976. Influence of level and type of dietary protein and of the
level of feeding and feeding utilization of rainbow trout. Journal Nutrition, 106(11):1547– 1556.
Dacie, J.V., S.M Lewis.2001. Practical haematology, 9th edition. Churchill Livingstone, London. 633pp.
Ezeri, G.N. 2001. The haematological response of Clarias gariepinus to bacterial infection and prophylactic treatment with antibiotics. Journal Aquacultural Science, 16: 22-24.
FAO. 1997. Food and Agriculture Organization of the United Nations. Review of the State of World Aquaculture. FAO Fisheries Circular No. 886, Rev. 1. Rome, Italy.
Francis, G.H., S.H. Mar, K.L. Becker, 2001. Antinutritional factors present in plant-derived alternative fish feed ingredients and their effects on fish. Aquaculture, 199 (3-4): 197-228. Gabriel, U.U., A.I George. 2005. Plasma enzymes in Clarias gariepinus exposed to chronic levels of
Roundup (glyphosate). Environmental Ecology, 23 (2): 271–276.
Gabriel, U.U., G.N.O. Ezeri, O.O. Opabunmi. 2004. Influence of sex, source health status and acclimation on the haematology of Clarias gariepinus (Burch, 1822). African Journal Biotechnology, 3: 463-467.
Hasting, W.H. 1976. Nutritional requirements and field technology in advances in aquaculture paper presented at the F.A.O. Technical Conference on Aquaculture, Kyoto Japan. 75p. Hilton, J.W., S.J. Cho, C.Y. Slinger. 1981. Effect of extrusion processing and stream pelleting diets
on pellet durability pellet water absorption and physiological response of rainbow trout, (Salmogairdneri R.). Aquaculture,25: 185-194.
Hrubec, T.C., J.L. Cardinale, S.A Smith. 2000. Haematology and plasma chemistry reference intervals for cultured tilapia (Oreochromis hybrid).Veterinary Clinical Pathology, 29: 7-12 Ibrahem, M.D., M.J. Fathi, S.H. Mesalhy, A.M.A. El-Aty. 2010. Effect of dietary supplementation
of insulin and vitamin C on the growth, haematology, innate immunity, and resistance of Nile tilapia (Oreochromis niloticus). Fish and Shellfish Immunology, 29: 241-6.
Kori-Siakpere, O., J.E.G. Ake, E. Dodge. 2005. Haematological characteristics of the African Snakehead, Parachacuna Obscura. African Journal of Biotechnology, 4(6): 527-530.
Maharrey, A.U. 2005. Effect of Malic acid on growth performance, carcass characteristics and feed efficiency in broiler chickens. International Journal of Poultry Science, 4(10):781-786.
Muchlisin, Z. A., N. Nadiya, N.W. Nadiah, M. Musman, M.N. Siti-Azizah. 2010. Preliminary study on the natural extenders for artificial breeding of African catfish Clarias gariepinus (Burchell, 1822). AACL Bioflux, 3(2):119124.
Munkittrick, K.R., J.F Leatherland. 1983. Haematological values in feral goldfish, Carasiusauratus L., as indicators of the health of the population. Journal of Fish Biology, 23:153-161.
76
Oladiji, A.T., T.P. Abodunrin, M.T Yakubu, 2010. Some physicochemical characteristics of the oil from Tetracarpidium conophorom (Mull. Arg.) Nigerian Journal of Biochemistry and Molecular Biology, 22 (2): 93-98.
Omitoyin, B.O. 2006. Haematological changes in the blood of Clarias gariepinus (Burchell 1822) juveniles fed poultry litter. Livestock Research for Rural Development, 18: 162.
Omoniyi, I.O., A.O. Agbon, S.A Sodunke. 2002.Effect of the lethal and sublethal concentrations of tobacco leaf dust extract on leaf weight and haematological changes in Clarias gariepinus. Journal of Applied Science and Environmental Management, 6 (2): 37-41.
Omotoyin, B.O. 2005. Problems and prospects of fish feed production in Nigeria. Invited Technical Paper presented at the USAID aquaculture Marketing Stakeholder Forum Held at University of Ibadan Conference Centre on 13th December 2005, pp:3.
Osuigwe D.I., C.J.O. Nwosu, I. Ogun 2007. Preliminary observations on some haematological parameters of juvenile Heterobranchus longifilis fed different dietary levels of raw and bioledjackbean (Canavalia ensiformis) seed meal. Conference on International Agricultural Research for Development, Tropentag, University of Kassel-Witzenhausen and University of Göttingen, October 9-11, 6 pp. ,http: / /www. tropentag.de/ 2007/ abstracts/ full/ 356.pdf.
Raina-Paiva, M.J., C.M. Ishikawa, A.A. Das-Eiras, N.N. Felizardo. 2000. Haematological analysis of Pseudoplatystoma fasciatum in captivity. Aqua 2000.Responsible aquaculture in the new millennium. Nice, France. May 2-6 2000. European Aquaculture Society Special Publications, 28: 590.
Robaina, L., M.S. Izquierdo, F.J. Moyano, J. Socorro, J.M. Vergara, D. Montero, H. Fernandez-Palacros. 1995. Soybean and lupin seed meals as protein sources in diets for gilthead sea bream (Sparusaurata) nutritional and histological implications. Aquaculture, 130: 219–233. Robert, N.R., J.C. Le-Gouvello, F.W. Mauviot, P.U. Arroyo, S.J. Kaushik. 1993. Use of extruded
diets in intensive trout culture: effects of protein to energy on growth, nutrient utilization and on flesh and water quality. In Kaushik, S. J., Laque, P. (Eds.). Fish Nutrition in Practice. Les Colloques No. 61.INRA edn.Versailles Codex, France. 497-500pp.
Tacon, A.G. 1990. Standard methods for the nutrition and feeding of farmed fish and shrimp. Argent Laboratories Press, Washington DC. 454p.
Van-der Oost, R.M., A.I. Satumalay, N.E. Vermeulen. 2000.Validation of inland water pollution assessment using biomarker response in caged carp (Cyprinus carpio). Marine Environmental Research, 50:431-432.
Voet, F.R., J.G. Voet. 1990. Biochemistry. John Wiley and Sons, New York, USA. pp. 425-457. Weiss, DJ., KJ Wardroup. 2010. Schalm’s veterinary haematology in 6th edition. A John Wiley and
Sons, Ltd, Publication, England.
World Health Organisation (WHO). 2003. Technical report series. Diet, Nutrition and the prevention of Chronic Disease. World Health Organisation, Geneva.