ESS Extension of Social Security
Fiscal space and the extension of social protection:
Lessons learnt from developing countries
Bolivia, Botswana, Brazil, Costa Rica, Lesotho, Namibia,
Thailand and South
Africa
Fabio Durán-Valverde
José Francisco Pacheco
ESS Paper N°33
Global Campaign on Social Security and Coverage for All
International Labour Office
Copyright © International Labour Organization 2012 First published 2012
Publications of the International Labour Office enjoy copyright under Protocol 2 of the Universal Copyright Convention. Nevertheless, short excerpts from them may be reproduced without authorization, on condition that the source is indicated. For rights of reproduction or translation, application should be made to ILO Publications (Rights and Permissions), International Labour Office, CH-1211 Geneva 22, Switzerland, or by email: [email protected]. The International Labour Office welcomes such applications.
Libraries, institutions and other users registered with reproduction rights organizations may make copies in accordance with the licences issued to them for this purpose. Visit www.ifrro.org to find the reproduction rights organization in your country.
ILO Cataloguing in Publication Data
Durán-Valverde, Fabio; Pacheco, José Francisco
Fiscal space and the extension of social protection: lessons learnt from developing countries: Bolivia, Botswana, Brazil, Costa Rica, Lesotho, Namibia, Thailand and South Africa. Durán-Valverde; Pacheco; International Labour Office, Social Security Department. - Geneva: ILO, 2012
xv. 178 p. (ESS paper, No. 33)
ISSN: 1020-9581; 1020-959X (online)
International Labour Office; Social Security Dept
social protection / social security / social security financing / fiscal policy / Bolivia / Botswana / Brazil / Costa Rica / Lesotho / Namibia / Thailand / South Africa
02.03.1
The designations employed in ILO publications, which are in conformity with United Nations practice, and the presentation of material therein do not imply the expression of any opinion whatsoever on the part of the International Labour Office concerning the legal status of any country, area or territory or of its authorities, or concerning the delimitation of its frontiers.
The responsibility for opinions expressed in signed articles, studies and other contributions rests solely with their authors, and publication does not constitute an endorsement by the International Labour Office of the opinions expressed in them.
Reference to names of firms and commercial products and processes does not imply their endorsement by the International Labour Office, and any failure to mention a particular firm, commercial product or process is not a sign of disapproval.
ILO publications and electronic products can be obtained through major booksellers or ILO local offices in many countries, or direct from ILO Publications, International Labour Office, CH-1211 Geneva 22, Switzerland. Catalogues or lists of new publications are available free of charge from the above address, or by email: [email protected]
Visit our web site: www.ilo.org/publns
Contents
Page
List of acronyms ... ix
Foreword ... xiii
Acknowledgements ... xv
1. Introduction ... 1
2. Fiscal space and social protection: Summary of lessons learnt... 5
2.1. Information sources ... 5
2.2. Brief overview of the countries... 6
2.3. General economic and fiscal conditions and their relation to fiscal space for social protection ... 10
2.4. Trends and lessons learnt ... 13
2.4.1. Main characteristics of social protection programmes... 13
2.4.2. Mechanisms for creating fiscal space: Practical evidence ... 14
2.4.3. Fourteen lessons learnt ... 17
3. Bolivia: Financing the extension of social protection through taxes on hydrocarbons ... 23
3.1. Country profile ... 23
3.2. Bolivia's social protection system ... 24
3.2.1. Contributory benefits ... 24
3.2.2. Non-contributory benefits ... 24
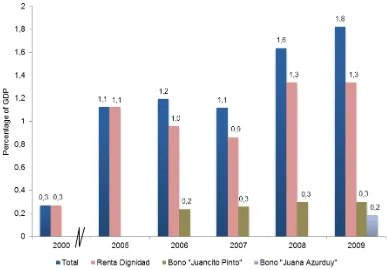
3.3. Renta dignidad: Universalizing old-age pensions ... 25
3.4. Coverage indicators ... 26
3.5. How fiscal space was created to finance the extension of non-contributory coverage? 28 3.6. Fiscal space and the sustainability of investment for development ... 31
3.7. Impact of new social investment in Bolivia ... 32
3.8. Lessons learnt ... 33
4. Botswana: Creating the basis for improved social protection ... 35
4.1. Country profile ... 35
4.2. Social protection policy ... 43
4.2.1. Organization and coverage ... 43
4.2.2. Social protection financing and expenditure ... 47
4.2.3. Pensions ... 50
4.3. Considerations regarding the creation of fiscal space ... 51
4.4. Policy considerations and lessons learnt ... 53
4.4.1. Policy considerations ... 53
iv ESS-33
5. Brazil: Increasing fiscal space through social contributions ... 57
5.1. Country profile ... 57
5.2. Social investment ... 58
5.3. Overview of the Brazilian social protection system ... 59
5.3.1. Social insurance programmes ... 59
5.3.2. Universal health system ... 60
5.3.3. Social assistance... 61
5.4. Fiscal space for social protection ... 64
5.4.1. The 1988 Constitution and fiscal space ... 64
5.4.2. Gross tax burden: The role of social contributions ... 65
5.4.3. Rural pensions ... 66
5.5. Temporary tax on financial transactions ... 67
5.6. Fiscal space, economic growth and development ... 68
5.7. What about creating fiscal space for development?... 70
5.8. Lessons learnt ... 72
6. Costa Rica: Prioritizing fiscal space for social protection ... 75
6.1. Country profile ... 75
6.2. Social protection programmes and social spending ... 80
6.3. Contributory social security programmes: The Costa Rican Social Insurance Fund (CCSS) ... 83
6.4. Non-contributory pensions ... 85
6.5. Poverty reduction initiatives ... 86
6.5.1. Initial efforts to reduce poverty in Costa Rica: FODESAF ... 86
6.5.2. The Bono de vivienda housing programme ... 87
6.5.3. The Comedores escolares school meals programme ... 87
6.5.4. The Avancemos conditional cash transfer programme ... 87
6.5.5. The CEN-CINAI programme... 88
6.5.6. Coverage rates of the main poverty reduction initiatives... 88
6.6. Fiscal space for social protection in Costa Rica ... 89
6.7. Challenges and lessons learnt ... 89
6.7.1. Challenges ... 89
6.7.2 Lessons learnt... 91
7. Lesotho: Taking advantage of good economic conditions and strong political will to increase social protection ... 95
7.1. Country profile ... 95
7.2. Social protection programmes: Initiatives and financing ... 100
7.2.1. Social protection programmes ... 100
7.2.2. Social programme financing ... 101
7.2.3. Old-age pension scheme ... 103
7.3. Fiscal space for social protection ... 104
7.4. Challenges and lessons learnt ... 106
7.4.1. Challenges ... 106
7.4.2. Lessons learnt... 106
8. Namibia: When politics overcomes limited resources ... 109
8.1. Country profile ... 109
8.2. Social protection: Programmes and public spending ... 114
8.2.1. Social spending and expenditure on social protection ... 114
8.2.2. Old-age pensions ... 118
8.2.3. Contributory social security system ... 118
8.2.4. Other social assistance initiatives ... 119
8.2.5. The basic income grant ... 120
8.3. The creation of fiscal space in Namibia ... 121
8.4. Challenges and lessons learnt ... 122
8.4.1. Challenges ... 122
8.4.2. Lessons learnt... 123
9. South Africa: Social protection for integration ... 125
9.1. Country profile ... 125
9.2. Social protection: Programmes and investment ... 130
9.2.1. Social assistance programmes ... 133
9.2.2. Social insurance programmes ... 135
9.3. The creation of fiscal space for social protection ... 137
9.4. Challenges and lessons learnt ... 138
9.4.1. Challenges ... 138
9.4.2. Lessons learnt... 139
10. Thailand: A hybrid strategy for achieving universal coverage in health care ... 141
10.1. Country profile ... 141
10.2. Social protection programmes and social spending ... 145
10.2.1. Contributory social security schemes ... 145
10.2.2. Non-contributory social programmes ... 148
10.2.3. Expenditure on social protection... 149
10.2.4. Filling the gap in the healthcare sector: The Universal Coverage Scheme ... 151
10.3. The construction of fiscal space for social protection... 152
10.4. Challenges and lessons learnt ... 155
10.4.1. Challenges ... 155
10.4.2. Lessons learnt... 155
References ... 157
vi ESS-33 List of tables
Table 1. Decline in debt servicing and ODA flows by country, 2005-2008 ... 12
Table 2. Increments in social spending and social protection spending (as a multiple of the initial year) ... 12
Table 3. Matrix of programmes (by country) ... 13
Table 4. Matrix of fiscal space strategies (by country) ... 15
Table 5. Bolivia: Social protection coverage indicators, 2000-2009 ... 27
Table 6. Botswana: Social protection programmes ... 44
Table 7. Brazil: Evolution of the coverage of the pension system ... 60
Table 8. Costa Rica: Key socioeconomic indicators, latest available year ... 80
Table 9. Costa Rica: Contributory and non-contributory programmes ... 81
Table 10. Lesotho: Main social indicators ... 99
Table 11. Lesotho: Social protection programmes ... 100
Table 12. Namibia: Socioeconomic conditions ... 113
Table 13. Namibia: Social protection programmes ... 114
Table 14. South Africa: Socioeconomic indicators, various years ... 130
Table 15. Thailand: Main social indicators ... 144
Table 16. Thailand: Social protection programmes ... 145
Table 17. Thailand: Contributory rates under the Social Security Fund as a percentage of insurable earnings ... 147
Table 18. Thailand: Social protection benefits and sources of financing ... 153
List of figures Figure 1. Human Development Index, countries analyzed in the study ... 7
Figure 2. GDP per capita 2009 and GDP growth by country (1995-2009, PPP terms) ... 7
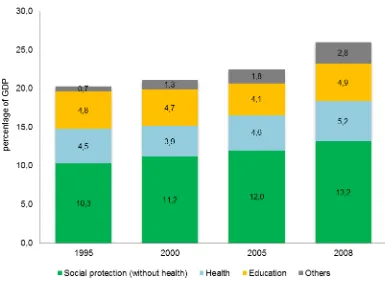
Figure 3. Social spending and social protection as a percentage of GDP (2005-2008) ... 8
Figure 4. Social spending and social protection expenditures as a percentage of total government expenditure (2005-2008)... 9
Figure 5. Public spending and fiscal revenue, 2005-2008 (percentage of GDP) ... 10
Figure 6. Net changes in fiscal revenue and public expenditure in percentage points of GDP ... 11
Figure 7. Relationship between social security expenditure and HDI (latest available year) ... 14
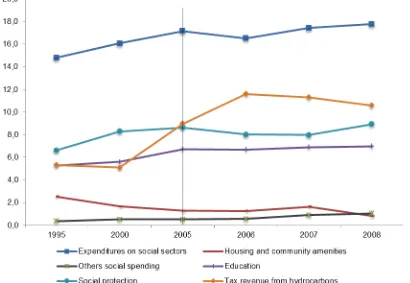
Figure 8. Bolivia: Total tax revenue and hydrocarbons tax revenue, as a percentage of GDP (1990-2008) ... 29
Figure 9. Bolivia: Social expenditure as a percentage of GDP and revenue from taxes on hydrocarbons (1995 – 2007) ... 30
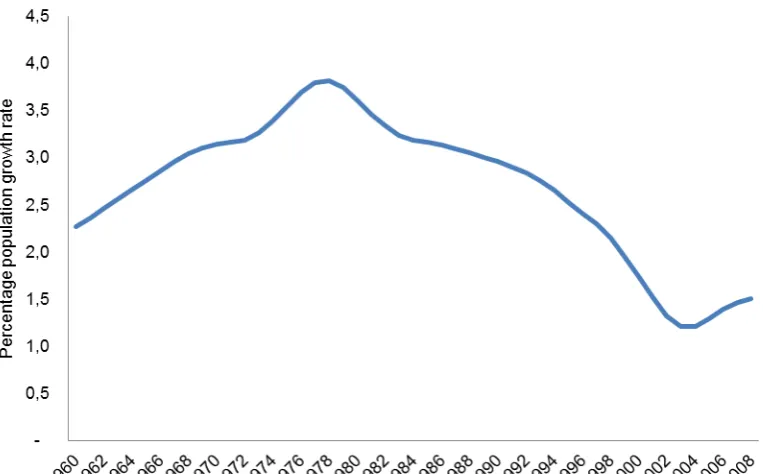
Figure 10. Bolivia: Trend of spending on social assistance programmes as a percentage of GDP 31 Figure 11. Botswana: Historical population growth rates, 1960-2008 ... 35
Figure 12. Botswana: Population pyramid, 2010 ... 36
Figure 13. Botswana: Long-term GDP and GDP per capita growth rates, 1960-2010 ... 37
Figure 14. Botswana: Structure of the economy by sector ... 37
Figure 15. Botswana: Diamond exports as a percentage of total exports, 2001-2008 ... 38
Figure 16. Botswana: Fiscal revenue and public expenditure as a percentage of GDP, 1991-2008 ... 39
Figure 17. Botswana: ODA as a percentage of gross national income, 1960-2008 ... 40
Figure 18. Botswana: External debt and debt service, 1975-2007 ... 41
Figure 19. Botswana: Poverty rates in Botswana, several years ... 42
Figure 20. Botswana: Human development index, 1980-2007 ... 42
Figure 21. Botswana: Infant mortality, 1980-2008 ... 43
Figure 22. Botswana: Public social expenditure as a percentage of GDP and of total public expenditure, 2000-2008 ... 48
Figure 25. Botswana: Structure of expenditure on social protection, 1991-2008 ... 50
Figure 26. Brazil: Evolution of social expenditure as a percentage of GDP ... 58
Figure 27. Brazil: Insured contributors to the pension system as a percentage of EAP ... 59
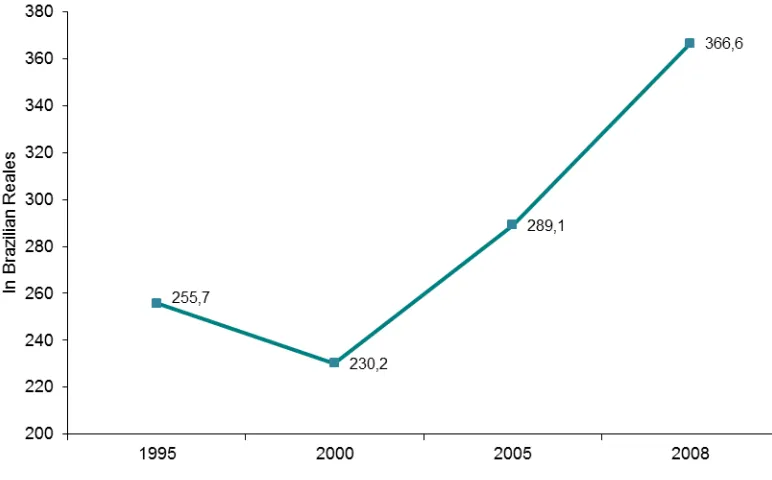
Figure 28. Brazil: Real per capita public expenditure on health (R$, 1998=100) ... 61
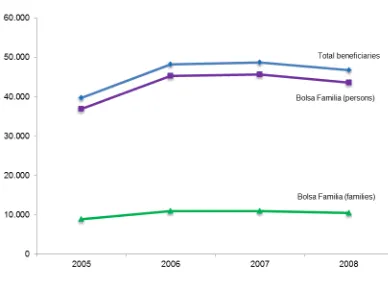
Figure 29. Brazil: Coverage of social assistance programmes (thousands) ... 63
Figure 30. Brazil: Fiscal revenue (including social contributions) and social contributions, as a percentage of GDP ... 65
Figure 31. Brazil: CPMF as a percentage of social protection expenditure and GDP ... 67
Figure 32. Costa Rica: Population growth rate, 1960-2010 ... 75
Figure 33. Costa Rica: Population pyramids, 1995, 2010 and 2025 (projected) ... 76
Figure 34. Costa Rica: GDP per capita, 1960-2008 ... 77
Figure 35. Costa Rica: Government expenditure and revenue, several years ... 78
Figure 36. Costa Rica: Debt service as a percentage of total exports, 1977-2008 ... 79
Figure 37. Costa Rica: ODA flows as a percentage of GNI, 1960-2008 ... 79
Figure 38. Costa Rica: Social spending as a percentage of GDP, 1990-2009 ... 82
Figure 39. Costa Rica: Composition of social spending, 1990-2009 ... 82
Figure 40. Costa Rica: Average participation of social protection categories, 2000-2009 ... 83
Figure 41. Costa Rica: Social contributions as a percentage of GDP and of expenditure on social protection, 1990-2009 ... 84
Figure 42. Costa Rica: Contributory health insurance and pension coverage, as a percentage of the economically active population (EAP), 1990-2009 ... 85
Figure 43. Costa Rica: old-age coverage by contributory and non-contributory old-age pensioners (people over 65 years of age), 1990-2009 ... 86
Figure 44. Costa Rica: Poor beneficiaries as a percentage of the target population, by programme, 2007 ... 88
Figure 45. Costa Rica: Percentage of beneficiaries who are not part of the target group, by programme, 2007 ... 90
Figure 46. Lesotho: Population growth rate, 1960-2008 ... 95
Figure 47. Lesotho: Public revenue and expenditure as a percentage of GDP (5-year periods, 1990-2008) ... 96
Figure 48. Lesotho: Structure of tax revenues, 2008 ... 97
Figure 49. Lesotho: Structure of public expenditure, 2004 and 2008 ... 97
Figure 50. Lesotho. External debt and total debt service in Lesotho, 1975-2008 ... 98
Figure 51. Lesotho: ODA as a percentage of GNI, 1966-2008 ... 99
Figure 52. Lesotho: Composition of social spending as a percentage of GDP, 2005-2008 ... 102
Figure 53. Lesotho: Expenditure on social protection as a percentage of GDP, 2005-2008 ... 103
Figure 54. Lesotho: Composition of social protection expenditure, 2009 ... 104
Figure 55. Namibia: Population growth rate, 1960-2010 ... 109
Figure 56. Namibia: Population pyramids for 2010 and 2030 ... 110
Figure 57. Namibia: GDP per capita, 1980-2008 (US$ current) ... 111
Figure 58. Namibia: Tax revenues and public spending as a percentage of GDP (several years) . 111 Figure 59. Namibia: External debt as a percentage of GDP, 2003-2008 ... 112
Figure 60. Namibia: Official development assistance as a percentage of GNI, 1985-2008 ... 113
Figure 61. Namibia: Public social expenditure, 2005-2008 ... 115
Figure 62. Namibia: Composition of social expenditure as a percentage of GDP, 2005-2008 ... 116
Figure 63. Namibia: Expenditure on social protection as a percentage of total public spending, 2005-2008 ... 117
Figure 64. Namibia: Health, contributory social security and social assistance as a percentage of GDP, 2005-2008 ... 117
Figure 65. South Africa: Total population 1960-2010 ... 125
Figure 66. South Africa: Population pyramids, 2000, 2010 and 2025 ... 126
Figure 67. South Africa: GDP per capita in US$, 1960-2010 ... 127
Figure 68. South Africa: Fiscal revenue and expenditure, 2000-2008 ... 128
viii ESS-33 Figure 71. South Africa: Social spending, 2000-2008 ... 131 Figure 72. South Africa: Composition of social spending as a percentage of GDP, 2000-2008 ... 132 Figure 73. South Africa: Real per capita spending on social protection programmes in Rands,
2000-2008 ... 132 Figure 74. South Africa: Coverage rates of the state old-age pension programme, selected years 134 Figure 75. Thailand: Population growth rate, 1960-2009 ... 141 Figure 76. Thailand: GDP per capita in current US$, 1960-2009 ... 142 Figure 77. Thailand: Total revenue, total expenditure and the fiscal balance as a percentage of
GDP, 1995-2008 ... 143 Figure 78. Thailand: Total debt service as a percentage of total exports, 1975-2008 ... 143 Figure 79. Thailand: ODA flows as a percentage of GNI, 1960-2008... 144 Figure 80. Thailand: Cost per beneficiary in selected social protection programmes, 2006-2008 149 Figure 81. Thailand: Social spending as a percentage of GDP and of public spending,
2005-2009 ... 150 Figure 82. Thailand: Social spending by category, 2005-2009 ... 150 Figure 83. Thailand: Health, social insurance and social assistance expenditure as a percentage
of GDP, 2005-2009 ... 151 Figure 84. Thailand: UC budget as a percentage of GDP and of the government budget,
List of acronyms
AfDB African Development Bank
AFP Pension Fund Administrators
AIDS Acquired immune deficiency syndrome
APC African Pioneer Corps (Lesotho)
APS Autoridad de Fiscalización y Control de Pensiones y Seguros (Bolivia–
Audit authority and control of pensions and insurance)
ART Antiretroviral treatment
BAIS Botswana AIDS impact survey
BCCR Banco Central de Costa Rica (Costa Rica Central Bank)
BFTU Botswana Federation of Trade Unions
BIG Basic income grant (Namibia)
BONOSOL Bono Solidario (Bolivia)
BPOPF Botswana Public Officers Pension Fund
CBO Community-based organizations
CBS Central Bureau of Statistics (Namibia)
CCSS Caja Costarricense del Seguro Social (Costa Rican Social Insurance Fund)
CCT Conditional cash transfer
CEF Caixa Econômica Federal (Brazil - Federal Economic Bank)
CELADE Latin American and Caribbean Demographic Centre
CEN-CINAI Early childhood programme (Costa Rica)
COIDF Compensation for Occupational Injuries and Diseases Fund (South Africa)
CONAI Comisión Nacional de Asuntos Indígenas (Costa Rica–National Commission of Indian Affairs)
CPMF Contribuição "Provisória" por Movimentação Financeira (Brazil–Financial transactions provisional contribution)
CSG Child Support Grant (South Africa)
CSLL Contribuição Social sobre o Lucro Líquido (Brazil–Social Contribution on Net Income)
x ESS-33 DG Disability Grant (South Africa)
DTH Direct tax on hydrocarbons (Bolivia)
EAP Economically Active Population
ECF Employee’s Compensation Fund (Namibia)
ECLAC Economic Commission for Latin America and the Caribbean
FAO Food and Agriculture Organization
FCC Fondo de Capitalización Colectiva (Bolivia - Collective Capitalization Fund)
FODESAF Fondo de Desarrollo Social y Asignaciones Familiares (Costa Rica - Fund for Social Development and Family Allowances)
FONABE Fondo Nacional de Becas (Costa Rica - National Scholarship Fund)
GDP Gross Domestic Product
GEP Government Employees Pension (South Africa)
GEPF Government Employees Pension Fund (South Africa)
GNI Gross national income
GPF Government Pension Fund (Thailand)
HDI Human development index
HIV Human immunodeficiency virus
IBGE Instituto Brasileiro de Geografia e Estatística (Brazilian Institute of Geography and Statistics)
ILO International Labour Organization
IMAS Instituto Mixto de Ayuda Social (Costa Rica - Joint Social Welfare Institute)
IMF International Monetary Fund
IMR Infant mortality rates
INAMU Instituto Nacional de las Mujeres (Costa Rica - National Institute of Women)
INSS National Social Insurance Institute (Brazil)
IPEA Instituto de Pesquisa Econômica Aplicada (Brazil - Institute of Applied Economic Research)
IRIF Inter-Regional Inequality Facility (South Africa)
IU Unemployment insurance (South Africa)
LDC Least developed countries
LEI Life expectancy index
LHDA Lesotho Highlands Development Authority
MDG Millennium Development Goals
MDS Ministério do Desenvolvimento Social e Combate à Fome (Brazil - Ministry of Social Development and Fight against Hunger)
MFDP Ministry of Finance and Development Planning (Botswana)
MFDP Ministry of Finance and Development Planning (Lesotho)
MGECW Ministry of Gender Equality and Child Welfare (Namibia)
MHI Mandatory health insurance
MHSS Ministry of Health and Social Services (Namibia)
MIDEPLAN Ministerio de Planificación Nacional y Política Económica (Costa Rica - Ministry of National Planning and Economic Policy)
NGO Non-governmental organization
NHSO National Health Security Office (Thailand)
NSSF National Social Security Fund (South Africa)
OAP Old-age pension programme
OECD Organisation for Economic Co-operation and Development
ODA Official development assistance
PANI Patronato Nacional de la Infancia (Costa Rica - National Foundation for Children)
PLHIV People living with HIV/AIDS
PPP Purchasing power parity
PSTWF Private-School Teachers’ Welfare Fund (Thailand)
RHVP Regional Hunger and Vulnerability Programme
SASSA South African Social Security Agency
SENARC Secretaria Nacional de Renda de Cidadania (Brazil - National Secretariat on Citizenship Income)
xii ESS-33 SMG Special maintenance grant (Namibia)
SSC Social Security Commission (Namibia)
SSF Social Security Fund (Thailand)
SSPAM Adult Health Insurance (Bolivia)
SSW Social security and welfare (South Africa)
STPA Short-term plan of action for orphans (Botswana)
SUMI Universal Mother and Child Health Insurance (Bolivia)
SUS Sistema Único de Saúde (Brazil - Unified Health System)
TPS Total public spending
UBIG Universal Basic Income Grant (South Africa)
UC Universal Coverage Scheme (Thailand)
UDAPE Social and Economic Policy Analysis Unit (Bolivia)
UN United Nations
UNDP United Nations Development Programme
UNFPA United Nations Population Fund
UNGASS United Nations General Assembly Special Session
UNICEF United Nations Children's Fund
UNPD United Nations Procurement Division
VAT Value added tax
WB World Bank
WCF Workmen’s Compensation Fund (Thailand)
WDI World Development Indicators
WFP World Food Programme
Foreword
This paper focuses on the analysis of experience in creating fiscal space for the extension of social protection. This study was undertaken within the framework of the STEP/Portugal Project, whose purpose is to promote the extension of social protection.
The paper presents the results of studies conducted in eight developing countries that successfully extended social protection including floors for national social protection systems in recent years. The studies seek to identify the strategies that were adopted to finance the extension of social protection and how the necessary fiscal space was created.
The creation of fiscal space is a highly complex issue, which transcends purely economic issues. Decisions on the extension of social protection are made in specific national contexts set by idiosyncratic cultural, demographic, economic, social and political circumstances. The findings and lessons learned from this study must be considered within these specific frameworks.
Based on the country analyses, this paper shows that the selected countries were able to extend one or more components of their social protection systems by typically using a combination of diverse strategies to create fiscal space. Some strategies are common to several countries, while other strategies can only be applied in particular national contexts.
The paper demonstrates that developing countries are able to create fiscal space to extend social protection and that investment in human development generates high returns in terms of social and economic development.
We hope that the evidence presented in this paper can be useful for countries aiming to implement social protection floors and build-up comprehensive social security systems.
Michael Cichon Director
Acknowledgements
1.
Introduction
Financing is a centrepiece for the design of strategies for the implementation of universal social protection systems. Without adequate and sustainable financing, government interventions in this field will have difficulty in achieving their ultimate goals. For this reason, the pursuit of fiscal space to finance the extension of social security is an issue that lies at the heart of the concerns of policy makers in social protection.
The ultimate goal of the ILO's Global Campaign on Social Security and Coverage for All is the development of comprehensive, consistent and properly coordinated social security systems that can provide universal protection against social risks throughout an
individual’s life cycle. This was one of the key findings of the International Labour
Conference in 2011, in the framework of the extension of social protection and national efforts to create social protections floors.
Because of their nature, decisions to ensure the sustainability of financially comprehensive social protection systems transcend the field of social protection. They call for nationwide strategies that include taxation within the framework of the economic system as a whole.
Throughout the years, the issue of fiscal space has been the subject of intense analysis and debate in various areas of public policy. In recent times, the agenda for the financing of human development, in particular the establishment of the Millennium Development Goals (MDGs), has sparked renewed interest in the problem of generating fiscal space to finance policies linked to the MDGs. The issue also extends to other fields of analysis related to the concept of "development" and the role of social protection, both as an instrument for fighting poverty and as an objective of the welfare society.
This report seeks to make a specific contribution in the field of creation of fiscal space for the extension of social protection, in order to provide an analytical view of the experience of countries in different parts of the world, so that other countries can understand better the processes involved.
There is a close link between the feasibility of extending social protection and the economic and political capacity of a country to generate sustainable resources that render the public funding of such initiatives viable in the long term.
Fiscal resources are limited and the process by which they are generated and distributed among the various public policy objectives, including social protection, is both technically and politically complicated. In the developing world, the challenge of financing social security is increasingly difficult, given the "natural" constraints imposed both by the limited capacity of the economy and by specific local factors related to social, historical and cultural characteristics.
From a fiscal standpoint, the challenge of creating fiscal space has two facets. On the one hand, a government's ability to generate new internal or external resources on a sustainable basis, by modifying either the source or level of funding, is necessarily limited. On the other hand, the State must use these resources in the most efficient way possible to achieve its welfare goals.
2 ESS-33 directed towards social protection. The financing of social protection therefore entails a complex decision making process in which the political dimension carries a very significant weight.
Taking into account all these complex factors, the precarious situation of social security coverage, particularly in the developing world comes as no surprise. It is estimated that more than 80 per cent of the world’s population does not have any social security protection at all. In sub-Saharan Africa and South Asia, it is estimated that only between 5 and 10 per cent of the workforce is protected by social security. Even in industrialized countries, the coverage of contributory social security schemes does not extend to the entire economically active population. This situation is also reflected in the existence of major national and regional disparities in the level of public investment in social protection. According to the World Social Security Report 2010-11, while European countries spend between 20 and 30 per cent of GDP on social security, investment in Africa ranges from 4 to 6 per cent (ILO, 2010a).
For the ILO, an institution inspired by the principles of social justice and by strategic objectives that explicitly address the development and extension of social protection, the issue of fiscal space is paramount; virtually all decisions relating to the extension of social protection also involve corresponding decisions relating to the generation of fiscal space.
This report addresses some of the practical experiences of developing countries that have engaged in a major process of extending social security. Inter alia, the report highlights the efforts of Brazil and Costa Rica to extend social insurance coverage in urban and rural areas. In the Brazilian case, the process was accompanied by measures to rebuild and increase efficiency in the allocation of expenditure among social programmes.
When the debate on the implementation of a social protection floor focuses on extending the coverage of non-contributory schemes financed by non-labour-based revenue, the main decisions focus on the availability and sustainability of existing resources (general taxation and earmarked taxes), the level of priority of social protection spending and the reorganization of existing programmes in order to optimize efficiency. This report therefore also addresses the interesting developments in this area of Bolivia, Botswana, Lesotho, Namibia, South Africa and Thailand.
This report does not attempt to quantify the fiscal space requirements of financing social protection. Instead, it analyses the practical experience of some developing countries that have had a degree of success in extending social protection. From an analysis of national experiences, it seeks to develop a set of lessons, conclusions and recommendations related to the creation of fiscal space, taking into account the major advances achieved and practical challenges encountered by these countries in creating fiscal space for extending social protection.
The experiences discussed here show that it is conceivable to build social protection floors in developing countries. In addition, such experiences have shown that there is no single recipe for creating fiscal space to finance social protection, and that each national context has singularities determined by its historical, political, economic and cultural characteristics. That said, the lessons learnt are very useful for identifying some common perspectives and strategies that could be adapted to other developing countries.
studies (Bolivia, Botswana, Brazil, Costa Rica, Lesotho, Namibia, South Africa and Thailand). Broadly speaking, the case studies observe the following structure: profile and background, description of the main elements of the social protection system, size and main characteristics of coverage, level of financing and expenditure, national strategies to achieve fiscal space for investment in social protection, the sustainability of these strategies and their likely impact on poverty and welfare.
2.
Fiscal space and social protection:
Summary of lessons learnt
This section summarizes the main facts and lessons derived from the analysis of eight countries (Bolivia, Botswana, Brazil, Costa Rica, Lesotho, Namibia, South Africa and Thailand). The summary contains some good news for policymakers in other countries who are interested in implementing something similar in their countries.
At this point, attention can be drawn to two conclusions. The first is that the creation of sustained fiscal space for social protection is feasible and there are multiple options for expanding this fiscal space. This is not a merely Utopian idea. As will be observed in the rest of this report, policymakers are not restricted to one or two options only; on the contrary, there is a considerable range of options to explore. The necessary tools are at hands, and even the poorest countries considered in this study achieved extraordinary results. On the other hand, their various experiences also show that there is no single recipe for raising the level of social protection financing. Although these countries have several points in common, the decisions adopted by governments depend on the social, political, economic and cultural environment of each nation. In other words, the best strategy has a strongly idiosyncratic component.
2.1. Information sources
Developing countries face difficulties in collecting uniform and statistically comparable information on social protection expenditure, largely because of the different definitions and criteria used for measuring the expenditure components. Given these difficulties, this study endeavours to collect, systematize and analyse the data on social protection in order to reduce the methodological problems associated with its definition and measurement. The information provided here is the exclusive responsibility of the authors.
In this report, the terminology “social security” and “social protection” are interchangeable. Accordingly, reference is made to “social protection” as having the following aspects: (1) interchangeable with “social security” or (2) as “protection”
provided by social security in case of social risks and needs.
Following a broad definition of social protection, the statistical definition used throughout this report to measure social protection expenditure is based on the functional definition of the ILO (Scholz, Cichon and Hagemejer, 2000), considering three categories: expenditure from contributory programmes (social insurance), spending on non-contributory programmes (for social assistance or universal programmes), and public spending on health. By function, social protection expenditure (cash benefits or benefits in-kind) includes health care, sickness, disability, survivors, employment injury, old-age, family and children, labour market programmes, housing, basic education (primary school, cash benefits, and benefits in-kind), and food and nutrition (food aid, food stamps, food subsidies). In developing countries, it is customary to classify benefits according to local needs and customs.
6 ESS-33 Família) and for the community. In the case of South Africa, social protection expenditure comprises health expenditure, which covers outpatient services, hospital services, research and development of health, public health services, outpatient care and other unspecified health expenditure, expenditure on contributory programmes, which includes social insurance and unemployment protection, and expenditure on social assistance to protect the elderly, veterans, the disabled, to promote care and attention for dependents and to provide child support, inter alia.
The information sources used in this report include both primary and secondary sources. In the particular case of information on social protection expenditure, primary sources were used. For example, the data from Bolivia, Brazil, Costa Rica, Lesotho, Namibia and Thailand were extracted from the annual statistics published by the finance ministries of each country. The information for South Africa comes from Statistics South Africa (Stats SA), a government agency. For information on Botswana, the main source is the annual reports presented by the Central Bank. Other information that does not refer to social protection, such as macroeconomic, fiscal and demographic statistics, was collected from the databases and publications of institutions in each country (finance ministries, central banks, social security institutions, statistical agencies and other public agencies), as well as from the online databases of international organizations such as the World Health Organization (WHO), International Labour Organization (ILO), United Nations Development Programme (UNDP), Economic Commission for Latin America and the Caribbean (ECLAC), World Bank (WB), International Monetary Fund (IMF), Organization for Economic Cooperation and Development (OECD), African Development Bank (AFDB) and Asian Development Bank (ADB).
2.2. Brief overview of the countries
The eight case studies are a sample of highly heterogeneous countries. There are three Latin American countries, one Asian and four African countries, with populations ranging from 2-5 million inhabitants (Namibia, Lesotho, Botswana and Costa Rica), to around 10 million (Bolivia) to over 50 million (South Africa, Thailand and Brazil).
Figure 1. Human Development Index, countries analyzed in the study
Source: UNDP 2009.
By size of the economy, Brazil ranks among the top 10 economies in the world and is the biggest economy in the group, followed by Thailand and South Africa (see figure 2). In terms of GDP per capita, the top four countries are Botswana, Brazil, Costa Rica and South Africa (all with a GDP per capita above US$10,000 in PPP terms); at the bottom of the group we find poor economies like Lesotho (US$1,613) and Bolivia (US$4,426). Thus, the sample contains a group of economies at very different stages of economic development and institutional maturity and with very different political models.
With respect to GDP growth, one can identify three groups of countries. A first group, to which Botswana, Costa Rica and Namibia belong, presented an average annual growth rate above 4 per cent between 1995 and 2009. A second group comprises Bolivia, Lesotho, South Africa and Thailand, with average growth rates in the range of 3.0 to 3.9 per cent. Brazil lagged behind the other countries with an average GDP growth rate of 2.9 per cent, partially attributable to low rates during the 1990s crisis.
Figure 2. GDP per capita 2009 and GDP growth by country (1995-2009, PPP terms)
8 ESS-33 Between 2005 and 2008, social spending averaged 21.3 per cent of GDP 1 while social protection (including health expenditures) averaged 14.6 per cent. Overall, two in every three dollars spent in the social sector were allocated to social protection initiatives, a clear indication of the political will to support social protection initiatives. In comparison to regional levels, three countries (Brazil, Costa Rica and Lesotho) show coefficients above the regional figure (see figure 3). According to the ILO´s World Social Security Report 2010-2011, social security expenditures (including health) accounted for 9.7 per cent of GDP in Latin America, 8.7 per cent in sub-Saharan Africa and 12 per cent in Asia and the Pacific (ILO, 2010a, Table 8.1).
Figure 3. Social spending and social protection as a percentage of GDP (2005-2008)
Source: Individual country data based on ministries of finance, housing, education of each country, central bank (Botswana), national statistical offices, ECLAC (2010a), IMF (2010b), World Bank (2010) and WHO 2010b.
As a share of total public expenditure, social spending accounted for an average of 56.6 per cent of GDP. Costa Rica ranks at the top of the list of countries with roughly 72.1 per cent of public spending going to social expenditure (see figure 4). Botswana´s share of expenditure on the social sector (46.2 per cent) ranks at the bottom of the list. About half of social expenditure went to social protection initiatives, with great variations between Brazil (51,7 per cent) and Botswana (15 per cent).
Figure 4. Social spending and social protection expenditures as a percentage of total government expenditure (2005-2008)
Source: Individual country data based on ministries of finance, housing, education of each country, central bank (Botswana), national statistical offices, ECLAC (2010a), IMF (2010b), World Bank (2010) and WHO 2010b.
10 ESS-33 Figure 5. Public spending and fiscal revenue, 2005-2008 (percentage of GDP)
Source: Individual country data based on ministries of finance, housing, education of each country, central bank (Botswana), national statistical offices, ECLAC 2010a, IMF 2010b, World Bank 2010.
2.3. General economic and fiscal conditions and their relation to fiscal
space for social protection
The sample of eight countries selected for this study shows that the creation of fiscal space for social protection purposes requires a combination of economic growth, macroeconomic priority, political support and other complementary strategies.
The relationship between social investment and economic growth is of paramount importance, as the literature on the subject has established that growth is critical for increasing social budgets. When assessing the annual growth rates of GDP and social spending in the countries studied, the evidence shows that the average GDP growth rate (3.0 per cent) closely paralleled the annual increments in social spending (2.9 per cent). Social protection tended to grow at the faster pace of 3.4 per cent per year, an indication that this category gained considerable support that increased its overall participation over time.
Figure 6. Net changes in fiscal revenue and public expenditure in percentage points of GDP.
Source: Individual country data based on ministries of finance, housing, education of each country, central bank (Botswana), national statistical offices, ECLAC 2010a, IMF 2010b, World Bank 2010.
The establishment of complementary strategies to create fiscal space for social protection is also one of the features that characterized this group of countries. The report explored two main strategies. Under the first strategy, the reduction of the total debt and then debt service (especially public debt ratios) were one of the main channels utilized to create fiscal space by allowing the Government to free resources for social protection purposes. All the countries in the study achieved substantial reductions in this way. Looking at the decline in the ratio of total debt service as a percentage of total exports, Botswana, Bolivia, Lesotho and South Africa experienced a reduction in their debt servicing coefficients of over 54 per cent from their 1995 levels. More modest but still significant cuts in debt servicing were observed in Brazil, Costa Rica and Thailand.
12 ESS-33 Table 1. Decline in debt servicing and ODA flows by country, 2005-2008
Country Net decline in debt servicing (%) ODA flows as a percentage of GNI
Costa Rica 24.4 0.1
Thailand 33.8 0.2
Brazil 37.8 0.0
South Africa 54.4 0.3
Lesotho 58.8 6.2
Bolivia 61.6 8.7
Botswana 82.2 1.4
Namibia NA 3.6
Source: World Bank, 2010.
Macroeconomic priority and fiscal priority (i.e. political commitment) to increase social protection spending is better approached by considering the share of government expenditure assigned to the relevant programmes. In general, social spending accounted for an average of 40.9 per cent of total public spending compared to social protection's 26.4 per cent. 2 These figures alone reflect the strong commitment of the governments to finance social protection programmes. However, macroeconomic and fiscal priority has to be assessed over time in order to determine whether this high level of investment is the result of a cumulative process or, on the contrary, reflects a decreasing participation in public budgets.
Table 2 shows that all the countries analyzed increased their rate of social spending and of social protection spending as a percentage of GDP compared with the initial year of analysis. Only in the case of Lesotho did spending on the social sector remain the same. In general, social protection expenditure benefitted more from the increments in total social spending. For those countries with available data for 2005-08, total social spending grew on average by a multiple of 1.15 and social protection by a multiple of 1.5. Thailand led the increments in social protection spending thanks to its aggressive universal healthcare programme that provides health services to over 50 per cent of the population and has helped the country to cover more than 94 per cent of the population.
Table 2. Increments in social spending and social protection spending (as a multiple of the initial year)
Country Social spending Social protection spending
Lesotho 2005-2008 1.2 1.8
Namibia 2005-2008 1.1 1.2
Botswana 1995-2008 1.1 1.5
South Africa 2000-2008 1.2 1.3
Brazil 1995-2008 1.3 1.2
Thailand 2005-2008 1.4 1.6
Bolivia 1995-2007 1.4 1.7
Costa Rica 1995-2009 1.5 1.4
Source: Individual country data based on ministries of finance, housing, education of each country, central bank (Botswana), national statistical offices, ECLAC (2010a), IMF (2010b), World Bank (2010) and WHO (2010b).
2 Weighted average by size of the economy. Simple average of spending on social sectors as a
Finally, political commitment was approached in terms of how much any expansion in fiscal expenditures was used to cover social or social protection programmes. Excluding Botswana and Costa Rica, about 55 per cent of the total increments in public spending was spent on financing social spending and 85 per cent of that additional social spending was allocated to social protection initiatives. These results are a clear indication of the increasingly important participation of social spending and social protection spending in the agenda of the governments included in the study.
2.4. Trends and lessons learnt
2.4.1. Main characteristics of social protection programmes
Before addressing the strategies for creating fiscal space, a brief mention should be made of the type of programmes that have benefited most from the creation of fiscal space in the countries studied. The matrix in table 3 shows that education, health and social benefit programmes received priority in every single country. In this context, priority means either that the programmes account for a high proportion of GDP or that they have expanded considerably in the last decades. In most cases, education is the single most important social subsector, with budgets exceeding 5 per cent of GDP. Even in Lesotho, which reduced the share of education spending in GDP, the current level of expenditure is still over 10 per cent of GDP.
Table 3. Matrix of programmes (by country)
Type of programme Bolivia Botswana Brazil Costa Rica Lesotho Namibia South Africa Thailand
Health and nutrition X X X X X X X X
Education X X X X X X X X
Old age pension X X X X X X X X
Other social security benefits (maternity, disability, survivors, etc.)
X X X X X X X X
Conditional cash transfers X X X Unconditional cash
transfers
X X X X X
Housing X X X X
Social security benefits (including disability benefits, survivors and employment injury, sickness and maternity allowance and family allowances, but not health insurance and old-age pensions) also appear in all countries as part of the portfolio of social protection entitlements. However, one should be cautious about these components, because the scope of the benefits offered differ substantially from one country to another. For instance, South Africa and Bolivia offered a full range of benefits while Lesotho concentrates on disability benefits and other pensions.
14 ESS-33 Poverty reduction programmes also appear on the list of initiatives that experienced a considerable increment in their budget as a result of expanded fiscal space. There is, however, a marked trend in the approaches adopted in the different regions. In Latin America conditional cash transfers prevailed as the preferred option, while in Africa the popular alternative was unconditional transfers, particularly cash transfers to highly vulnerable groups such as children, the elderly, orphans and people living with HIV.
Although housing expenditure also appears in practically all the cases, the overall trend is to reduce the share of housing programmes in social spending. In some cases, including Botswana and Lesotho, housing programmes accounted for over 3 per cent of GDP but they have now declined, in some cases by 50 per cent of their initial share. In short, housing initiatives exist but they play a less important part in social strategies as a whole.
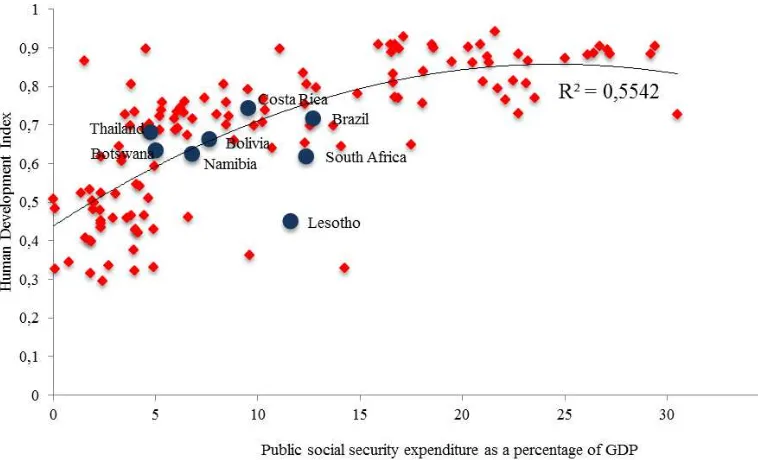
A straightforward conclusion can be drawn from the above which is important to highlight, namely that investing efficiently in social programmes definitely pays off. Figure 7 presents the relationship between social security expenditure (as a percentage of GDP) and the HDI. The evidence shows that there is a positive correlation between the two variables, and that increasing expenditure on social security yields important gains in the overall circumstances of the population as measured by the HDI.
Figure 7. Relationship between social security expenditure and HDI (latest available year)
Source: UNDP 2011; ILO 2010a.
2.4.2. Mechanisms for creating fiscal space: Practical evidence
negotiations with multinational companies in Botswana and from risky political moves such as the abolishment of the army in Costa Rica to the reduction of other social spending programmes to increase social protection outlays.
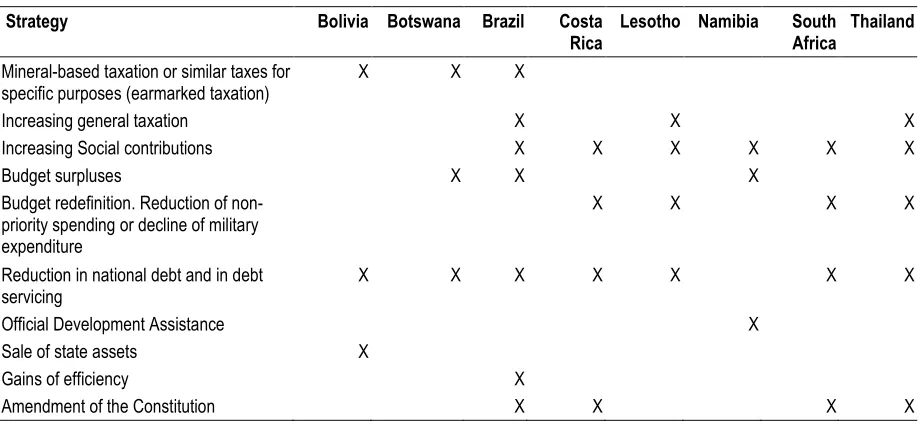
Several features are apparent in table 4. First, not one of the single strategies adopted sought to increase fiscal space for social protection alone. The mix of strategies is clear, as is the fact that countries do not base their social protection financing on just one source of funds. Diversification is the key for sustainability, and such is the strategy that was followed by most of the countries covered in this report.
Table 4. Matrix of fiscal space strategies (by country)
Strategy Bolivia Botswana Brazil Costa
Rica
Lesotho Namibia South
Africa
Thailand
Mineral-based taxation or similar taxes for specific purposes (earmarked taxation)
X X X
Increasing general taxation X X X
Increasing Social contributions X X X X X X
Budget surpluses X X X
Budget redefinition. Reduction of non-priority spending or decline of military expenditure
X X X X
Reduction in national debt and in debt servicing
X X X X X X X
Official Development Assistance X
Sale of state assets X
Gains of efficiency X
Amendment of the Constitution X X X X
Earmarked taxation based on natural resources. In countries that have the advantage of possessing natural resources, as do Bolivia and Botswana, taxes on their exploitation is a viable alternative, especially when countries renegotiate the terms on which operations have been performed in the past. The developing world is full of countries with immense natural resources but carry a heavy burden of poverty from generation to generation.
Increasing general taxation. Three of the countries studied, Brazil, Lesotho and Thailand, achieved impressive increases in general taxation, which shows that this is also a feasible path. It is noteworthy that such policies are implemented over a relatively long term and must be accompanied by other relevant policies within a framework of macroeconomic and fiscal discipline.
Social contributions. As a way of creating fiscal space, generating funding through social contributions is by its nature associated with the extension of contributory social security. Most of the countries studied – Brazil, Costa Rica, Lesotho, Namibia, South Africa and Thailand – increased financing significantly via social contributions. Brazil, for example, which greatly expanded its social security coverage in both urban and rural areas, established a special tax on financial transactions to finance the universal health care system. As in Brazil, Costa Rica's social contributions account for the highest share of the funds used to finance its social protection programmes. In both countries, social contributions are closely associated with the introduction of innovations to encourage the formalization of the labour market and to expand the coverage of contributory social security. This kind of innovation explains in large part the progress made in generating fiscal space.
16 ESS-33 such as Costa Rica, Lesotho, South Africa and Thailand, the governments reduced spending in certain areas that they did not considered a priority or where funding could be reduced, Lesotho, for instance, opted to reduce the participation of expenditure on education in total government spending. In Costa Rica and Thailand, military spending fell or (in Costa Rica) was completely eliminated many years ago.
Africa accounted for 1.1 per cent of the world´s military spending, but in sub Saharan Africa, according to data published by the Stockholm International Peace Research Institute (2010), this amounted to 1.9 per cent of GDP (US$17.4 billion). Just in the group of countries analyzed, military expenditure ranged from 1.3 to 3.5 per cent of GDP.
Reduction of debt service. Another interesting feature is the active role that the reduction in total debt and debt service played in expanding the fiscal space for extending social protection. All the countries experienced a major reduction in their debt burdens, especially public debt, and in the corresponding debt service payments. As a result, more resources were allocated to the social sector, as in Thailand where almost a third of the resources thus freed went to social programmes.
Official development assistance (ODA). ODA was not a significant source of funds for social initiatives in the countries analyzed. In every case, whether the level of ODA declined or increased, it still accounted for only a small proportion of GNI. Moreover, of the total external assistance received only a fraction was allocated to social protection. As a result, ODA did not play a critical role, which shows that an endogenous strategy of social protection financing is possible even in developing countries.
Constitutional channel. This refers to the practice observed in many cases of defining social spending either fully or partially in the Constitution, thereby obliging governments to consider certain programmes as priority initiatives for the nation and therefore to expand their budgets. Explicit reference is made to education, health and social security financing in the Constitutions of Brazil, Costa Rica, South Africa and Thailand. In the case of Costa Rica, expenditure on education cannot be lower than 6 per cent of GDP, and in Brazil, South Africa and Thailand the Constitution includes health and social security in the rights of the citizen. It is thus possible to ensure a minimum level of social spending by tying future political decisions to a predetermined framework.
Gains in efficiency. One way of releasing resources, which can then be channelled to social security, is to reduce costs by improving the effectiveness of the money spent. The experience of Brazil, where both the structure of cash transfer programmes and the criteria and mechanisms of resource allocation were revised in order to improve targeting, shows that it is feasible to save costs by restructuring social transfers.
2.4.3. Fourteen lessons learnt
Lesson 1
Macroeconomic stability and fiscal discipline are essential to expand the fiscal space. The experiences of Botswana, Brazil, Lesotho and Thailand show that all that can be done to maintain macroeconomic stability by applying principles of fiscal prudence, will eventually bring benefits in terms of creating fiscal space and its sustainability. In Botswana, the new resources generated by the diamond mining agreements were used prudently by the Government, so as not to jeopardize the fiscal situation. Brazil was able to combine macroeconomic stability with social inclusion policies based on high levels of social investment, which helped boost demand for domestic consumption; an important part of its success rested on monetary policy and fiscal responsibility. In Botswana and
Lesotho, despite the rapid growth in tax collection, governments didn’t embark on a similar expansion of public spending, so the resulting cumulative surplus made it possible not to sacrifice the budget for social protection to any great expect during the recent economic crisis. Thanks to prudent fiscal policy and notable social spending priorities, Thailand, despite a modest performance in terms of tax collection, was able to reallocate resources to strengthen its universal health strategy. This experience also shows that creating fiscal space for a particular purpose can be achieved by reallocating resources from less efficient to more efficient sectors or categories of expenditure.
Lesson 2
Economic growth is important, but it is not always the main determinant in creating fiscal space for the extension of social protection. The analysis of fiscal space creation does not bear out the belief that it is dependent on exceptional economic growth. Brazil and Costa Rica, which are very different in both size and economic characteristics, are proof that the right combination of economic growth (even if moderate) and inclusive policies aimed at generating funds give good results. Costa Rica took advantage of a sustained policy to strengthen the social sector institutions in the 1960s and 1970s; especially social insurance and non-contributory cash transfers programmes. South Africa shows that social protection spending can be substantially increased even if the country's economic performance is moderate. Likewise, Thailand's poverty reduction policies allowed the Government to lower the level of financing of its social assistance programmes.
Namibia is an excellent illustration of the mechanisms available to countries with moderate macroeconomic and fiscal performance. None of the macroeconomic factors usually associated with the creation of fiscal space were in any way outstanding. Production grew at a moderate rate and was not transformed into a higher level of fiscal revenue, as had been expected. From a macroeconomic standpoint, average economic growth was far below the dynamic rates of countries such as Botswana and Mozambique, where average GDP growth exceeded 8 per cent per year. In addition, the Government decreased its participation in the economy and by 2008 the level of taxation and expenditure was considerably lower than in 1991, just after Independence. Nonetheless, the Government was able to generate a fiscal surplus in the second half of the 2000s, an indication of the highly prudent fiscal policy.
Lesson 3
18 ESS-33 true in contexts such as that of South Africa where the Government operates under very restrictive fiscal conditions, usually accompanied by a fiscal deficit. If public funds grow just at a moderate rate and external aid is limited, then the critical decision involves modifying the composition of public spending by increasing the budget of priority sectors as against that of other sectors. In Lesotho, the Prime Minister and the key political parties demonstrated a strong political commitment to approve and proceed with the allocation of more funds to existing programmes, to open up additional fiscal space by implementing new social programmes and to reform existing mechanisms that were not financially sustainable in the long term.
However, there is always some degree of competition for any new fiscal space when it comes to investing in development. In a world characterized by scarcity of resources and by opportunity costs, social protection is just one among many possible uses of fiscal resources. This is particularly true when the new fiscal space is created by increasing taxation. Then, once fiscal space has been generated, the process of "allocating" the new fiscal space among alternative uses responds to complex social criteria in which many forces play a part. Factors that play an important role in such decisions include a country's idiosyncrasy, its culture, its political situation, its history, the interests of power groups and the distribution of political and economic power among them, to name just a few.
Lesson 4
Fiscal space for extending social protection is a highly political matter. Decisions such as reducing (in Thailand) or eliminating (in Costa Rica) the army, or renegotiating the revenue from the exploitation of hydrocarbons (in Bolivia) explain certain major changes in the financing of social protection. In Bolivia, the decision involved a series of highly complex, and sometimes antagonistic, political processes involving the various stakeholders. The outcome, however, was the creation of a truly universal social pension system in a country with one of the highest levels of poverty in South America. In Brazil, heated political battles were fought for years over the advantages or disadvantages of creating a tax on financial transactions, which eventually played a key role in financing and consolidating the universal health system until social contributions based on financial transactions were finally abolished and replaced by other sources of income.
Lesson 5
Social contributions are an effective tool for generating fiscal space. This conclusion is crucial in terms of the economics of social protection financing. Fiscal space for social security is quite specific because, unlike other areas of investment for development, social insurance (usually based on payroll contributions) has been a source of financing from the very inception of social security systems. Depending on the particular social security model adopted, social contributions can play an important role in explaining the size of fiscal space generated by the country as a whole. In many countries, especially in the industrialized world, it is difficult to imagine a social security scheme without its specific sources of financing based on social contributions. Several of the developing countries studied also provide positive evidence of the feasibility of generating a significant proportion of fiscal space through social contributions. Apart from Brazil and Costa Rica there are nations in Latin America (Argentina, Chile, Colombia, Panama, Uruguay) where it would be unthinkable today to envisage a sustainable system of social protection without the resources generated from social contributions.
Lesson 6
informality. The interventions to extend social security to independent workers and to extend effective coverage to micro and small enterprises would generate fiscal space regardless of general taxation policies.
Innovations in the creation of fiscal space by increasing coverage or the collection of social contributions can bring very significant returns. In Brazil there have been innovations both in fiscal instruments and in social policy. From the standpoint of the country's social protection system, some of the most important innovations include the introduction of the
rural “semi-contributory” pension scheme, the use of taxes on financial transactions to
generate resources from the formal economy, improvements in the administrative and institutional framework of the social contribution collection system, and measures to facilitate and increase the tax coverage and social security of micro and small enterprises.
Case studies of Brazil and Costa Rica provide evidence contrary to the neoclassical argument that increased levels of social contributions may cause greater informality. Costa Rica has one of the highest rates of nominal and effective social contributions in all Latin America, yet, along with Chile and Uruguay, it has one of the lowest rates of informality. The country also appears among the top countries in terms of competitiveness, well above regional averages. As in the case of Brazil, social contributions do not therefore seem to be associated with labour market informality. If social inclusion policies are able to improve the quality and employability of the labour force, and if such interventions provide more opportunities for the development of an extended business base, the expected outcome should be a reduction in the level of informality.
Lesson 7
Renegotiating the terms of distribution of wealth generated by the exploitation of natural resources is a feasible option. In the developing world there are many experiences of countries whose natural resources have been exploited for a long time, with few benefits in terms of the distribution of gains among the population. Yet the example of Bolivia and Botswana addressed in this report are proof that this can change and that the results in terms of creation of fiscal space can be impressive.
Bolivia is an example of the political and economic feasibility of negotiating more equitable terms for the distribution of profits from the exploitation of natural resources. In Bolivia the renegotiation was radical, and because of its positive impacts on the creation of fiscal space it constitutes a strategic step in the direction of sustainable development and economic growth. In Botswana, the diamond agreement with De Beers was essential for the expansion and consolidation of fiscal revenues. It proves that win-win strategies can be implemented in that kind of context and that agreements can be renegotiated under advantageous terms. This is also a good example for mineral-driven economies that opt for joint ventures between the Government and the private sector to exploit this type of resource.
Lesson 8
20 ESS-33 Money is important but, again, money alone is not enough. For more than a decade, from 1994 to 2006, poverty rates in Costa Rica remained stable at around 20 per cent of the population, despite the fact that an extensive institutional framework was already in place. That said there remain problems with targeting and with programme design, which reduce efficiency.
Lesson 9
The design of the social protection system does matter. In connection with the concept of the social protection floor promoted by the ILO, a central idea is the need to design comprehensive social protection systems that combine different types of instruments in a coordinated manner. Countries should be very careful about the initiatives they create. A long list of social programmes may generate problems of coordination between these. Moreover, the contribution of some programmes to the fight against poverty may be quite small. Costa Rica's experience raises two potential problems. Firstly, it is usually very difficult to cancel or reverse programmes that are under way, and so policymakers may tend to keep them even though they do not bring the desired results. Secondly, if there are too many programmes, the demand for additional financing may set them in competition with other priorities.
Lesson 10
Social investment pays and contributes to economic development. Studies on the impact of increased social investments in Bolivia confirm the advantages of such a strategy on economic growth. Bolivia provides evidence against the argument that investment in social protection competes against private investment. Expenditure on social protection is injected into the economy and becomes part of a circular flow of income. These injections are useful to support growth in spending in the short term and contribute to macroeconomic stabilization in times of crisis.
Viewed in the long term, the social security system has acted as a direct contributor to the country's competitiveness by enhancing the health status of the population, and as an indirect contributor by reducing inequality and promoting social peace – two elements that investors are inclined to give weight to when deciding where to locate their companies. In addition to the experience of Bolivia, there is evidence from Brazil, Costa Rica and Thailand which supports the idea that investment in social protection has a positive effect on the generation of income, growth and fiscal revenue in the long term.
Lesson 11
There are advantages in combining contributory programmes with non-contributory programmes. The evidence from Thailand suggests two things about universal health coverage. First, it reaffirms the idea that general taxation plays a critical role in the achievement of this objective in countries where informal labour markets prevail. Second, universal coverage in Thailand was not the product of just one source of financing (general taxation), but was made possible by using a hybrid model that combined the mechanisms of both contributory and non-contributory schemes.
Lesson 12
that constitute the social protection floor, contribu