nae2007
The 5th International Conference on Numerical Analysis in Engineering
Noise and Vibration Analysis; Analysis of Machine Element Design
8 -
1
NUMERICAL SOLUTION OF
FATIGUE STRESS IN JOURNAL BEARING
Hasan Basri
Department of Mechanical Engineering, Sriwijaya University
Kampus Unsri Inderalaya Jalan Raya Palembang-Prabumulih km.32 Inderalaya, Ogan Ilir Phone : (0711-580272)
E-mail: [email protected] ; [email protected]; [email protected]
Abstract
Failure of fatigue is damaged materials where caused frequent load. Fatigue owing to some factors, which is Stress concentration on fatigue, Stress life, Effect size and surface, and Change properties of surface. The fatigue failure of a material is dependent on the interaction of a large stress with a critical flow. In essence, fatigue is controlled by the weakest link of the material, with the probability of a weak link increasing with material volume. This phenomenon is evident in the fatigue test results of a material using specimens of varying diameters. From this research we can get effect of concentration stress on strength fatigue with S-N method. On this method only count fatigue life or endurance limit from Journal bearing housing. By Finite Element Analysis, it is not so easy to determine fatigue life. When we find the first yield point, it means this point is in the highest stress state. Then we can refer S-N curve. In this paper, the effect of bearing and housing elasticity on the stress field, which could result in surface fatigue in journal bearing, has been investigated. This condition is proved with occurred slip lines on surface of specimen. These slip lines are caused on some thousands stress cycles. Additional crack is happened immediately and finally long enough crack. So that formed unstable crack that caused fracture of brittleness or fracture of toughness because section of specimen cannot keep down load.
Keywords: FEM, Fatigue Life, Yield Point, S-N curve, Journal Bearing
1. Introduction
While many parts may work well initially, they often fail in service due to fatigue failure caused by repeated cyclic loading. Characterizing the capability of a material to survive the many cycles a component may experience during its lifetime is the aim of fatigue analysis. In a general sense, Fatigue Analysis has three main methods, Strain Life, Stress Life, and Fracture Mechanics.
According to independent studies carried out by the Battelle group in 1982, between
80-90% of all structural failures occur through a fatigue mechanism and the estimated annual cost of fracture and fatigue to the US was 4.4% of GDP.
Furthermore the Battelle Study concluded that this could be reduced by 29% by application of current fatigue analysis technology.
nae2007
The 5th International Conference on Numerical Analysis in Engineering
Noise and Vibration Analysis; Analysis of Machine Element Design
8 -
2
It, Fix It” approach to fatigue design. This approach is known to be very costly as an iterative design cycle is centered on the construction of real prototype components. This inhibits the ability to develop new concepts and reduces confidence in the final product due to a low statistical sample of tests. It is also common to find early products released with ‘known’ defects or product release dates being delayed whilst durability issues were addressed.
A more desirable approach is to conduct more testing based on computer simulations. Computational analysis can be performed relatively quickly and much earlier in the design cycle.
Confidence in the product is therefore improved because more usage scenarios can be simulated. It is not recommended, however, that these simulations completely replace prototype testing. It will always remain desirable to have prototype signoff tests to validate the analysis performed and improve our future modeling techniques. However, the number of prototype stages, and hence the total development time, can be reduced.
The following subsections are including: bearing in general, journal bearings, thrust bearing, other types of bearings, rotor-bearing system. Coupled thermomechanical non-linear finite element models have been developed to study 2D and 3D rolling, and rolling plus sliding contact problems. The various less or more realistic material constitutive models have been used to model behavior of bearing materials. The contact stress fatigue is considered as a primary wear mechanism. The damage process under contact loading such as, for example, is the cracking, spaling, and tribological reaction, can be study by the finite element method. We can study the mechanics of the sub-surface or near surface modes of rolling contact failure.
In this paper we overview the physical behavior responsible for fatigue stress from initiation to final component failure of journal bearing.
2. Journal Bearing
The bearings are important enough to be studied because if the shaft’s orbit is not stable, or the bearing is not well designed, contact between the shaft and the bearing will appear.
The plain journal bearings are fully used in hydraulics due to their small size, low price, and its capability of carrying load.
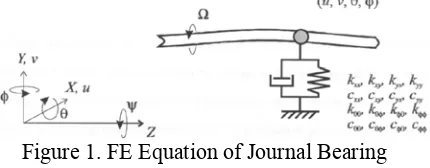
The journal bearing appears in the finite element equations as a spring and damper. It appears at one node, linking the shaft to a rigid structure. It has 4 degrees of freedom:
Figure 1. FE Equation of Journal Bearing The first thing we need to do is determine the static (mean) position of the shaft in the bearing.
Figure 2. Static Bearing Calculation Static lateral forces act on the shaft to push it to one side of the bearing.
– The weight of the rotor (in horizontal rotors),
– Generator magnetic forces due to stator offset,
– Static forces,
– Forces due to thrust bearing angular misalignment,
nae2007
The 5th International Conference on Numerical Analysis in Engineering
Noise and Vibration Analysis; Analysis of Machine Element Design
8 -
3
In static equilibrium the net fluid forces Fx and Fy are balanced by the static lateral shaft forces.
Two important parameters are obtained from the bearing test: (i) bearing yield (sb,yield)
and (ii) bearing ultimate (sb,ult) of the material;
where bearing stress is defined with the following relation: sb=P/(Dt). The yield
parameter is defined as the stress at a 2% permanent hole deformation, which is a definition comparable to the tensile yield. Bearing ultimate is defined as the first maximum load peak, which generally was the maximum stress reached.
For the material model, it is assumed that it behaves as an isotropic material with isotropic hardening. Uniaxial tensile test data are simplified into a trilinear behavior, consisting of (i) an elastic part, (ii) plastic part up to necking (15% plastic strain) with stiffness equal to 1467.67 MPa, which is followed by (iii) a description of the necking behavior.
3. The Physics of Fatigue
Fatigue is defined as ‘Failure under a repeated or otherwise varying load which never reaches a level sufficient to cause failure in a single application.’ Fatigue cracks always develop as a result of cyclic plastic deformation in a localized area. This plastic deformation might arise through the presence of a small crack or pre-existing defect on the surface of a component, for both cases it is practically undetectable and unfeasible to model using traditional Finite Element techniques.
August Wöhler was the first engineer to study fatigue failure and propose an empirical analysis technique. Between 1852 and 1870, Wöhler studied the progressive failure of railway axles. He constructed the test rig shown in Figure 2, which subjected 2 railway axles simultaneously to a rotating bending test. Masses were suspended from the ends of the axles and the axles rotated till failure. Wöhler then plotted the nominal stress vs. the number
of rotations to failure on what has become known as the SN diagram. Each curve is still referred to as a Wöhler line. The SN method is still the most widely used today and a typical example of the curve is shown in Figure 3.
Figure 3. Wöhler's Rotating Bending Fatigue Test
4. Fatigue Life Prediction
The fatigue life prediction follows the strain life approach used for notched geometries. Surface grooves are treated as microscopic notches, where elastic stresses and strains are converted to local plastic stresses and strains in the notch root. Different methods can be used for this conversion, depending on the stress state in the notch root and the applied loading. The most well-known approach is that due to Neuber which relates nominal elastic values to notch root stress and strain as
K
2t
n2E
C
, where C is a constant and en is nominal elastic strain. Plane stress is assumed in this analysis, which can be shown not to be the case for a circumferentially notched bar. A method for general stress states is outlined later.nae2007
The 5th International Conference on Numerical Analysis in Engineering
Noise and Vibration Analysis; Analysis of Machine Element Design
8 -
4
parameter is known to vary with material and notch geometry. Several expressions for this dependence have been proposed. They are all semi-empirical equations which try to account for the material volume influenced by the notch; a sharp notch will have a steep stress gradient into the material, thus the volume of elevated stress will be smaller than for a blunt notch. Neuber and Peterson among others have tried to relate q to the notch root radius using a material parameter. In a previous work, Neuber’s expression for Kf was successfully applied in predicting fatigue in the HCF range. For a random surface topography, however, the notch root radius is hard to define. Based on a large amount of empirical data, Siebel and Stieler expressed Kf by the relative stress gradient.
5. Fatigue Strength and Fatigue Life
The fatigue strength of a welded component is defined as the stress range which fluctuating at constant amplitude causes failure of the component after a specified number of cycles (N). The stress range is the difference between the maximum and minimum points in the cycle. The number of cycles to failure is known as the endurance or fatigue life.
6. S-N Curve
The expression linking N and Rm can
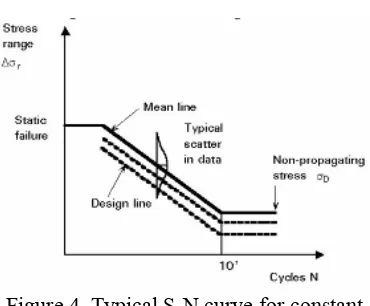
be plotted on a logarithmic scale as a straight lineand is referred to as an S-N curve. The relationship holds for a wide range of endurance. It is limited at the low endurance end by static failure when the ultimate material strength is exceeded. At endurances exceeding about 5-10 million cycles the stress ranges are generally too small to permit propagation under constant amplitude loading. This limit is called the non-propagating stress. Below this stress range cracks will not grow.
Figure 4. Typical S-N curve for constant amplitude test
For design purposes it is usual to use design S-N curves which give fatigue strengths about 25% below the mean failure values, are used to define these lines.
7. Effect of Mean Stress
In non-welded details the endurance is reduced as the mean stress becomes more tensile. In welded details the endurance is not usually reduced in those circumstances. This behavior occurs because the weld shrinkage stresses (or residual stresses), which are locked into the weld regions at fabrication, often attain tensile yield. The crack cannot distinguish between applied and residual stress. Thus, for the purposes of design, the S-N curve always assume the worst, i.e. that the maximum stress in the cycle is at yield point in tension. It is particularly important to appreciate this point as it means that fatigue cracks can grow in parts of members which are nominally 'in compression'.
8. Effect of Mechanical Strength
nae2007
The 5th International Conference on Numerical Analysis in Engineering
Noise and Vibration Analysis; Analysis of Machine Element Design
8 -
5
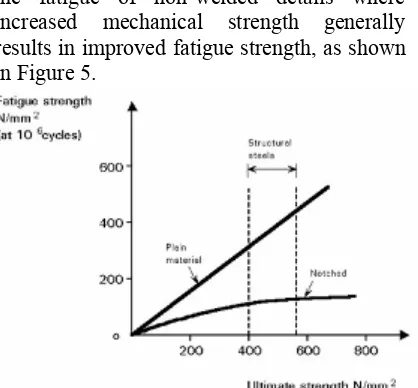
the fatigue of non-welded details where increased mechanical strength generally results in improved fatigue strength, as shown in Figure 5.
Figure 5. Effect of Mechanical Strength
9. FEM Analysis
Finite element technique involves
element-modeling discretion, which is
defined through a displacement function
of each node
.
F
k
D(1)
Modeling used is rectangular trilinear
element. As the result, when the load is
occurred to the journal bearing, then the
out coming strain and stiffness matrix are,
{
( e )} = [ N
1N
2. . . N
n] {
( e )}
[ K
(e)] =
N
i
k
1
]
[
(2)
Next, we can determine the possible
outcoming stress by,
{
(e)} =
[B] {
(e)}
(3)
Finite element analysis is supported by
FAST
Software and structure analysis. The
boundary conditions of Journal bearing,
give it a fatigue load of 0 to 30000 N and
ultimate axial load of 40000 N. This is a
simple case. However, we will use a 3D
FEA model to make a point. After a
linear-static stress analysis, result shows
the maximum stres. Because it is a linear
analysis, we can easly scale the stresses
for different loads. There for, the
maximum stress is:
)
(
max
PeakStress
F
F
fatigue tu
(4)
The margin of safety at the ultimate
load is base on maximum stress value
from Finite Element Analysis.
/
max
1
tu
safetyUlt
S
M
(5)
Figure 6. FEA Modelling for Journal
Bearing housing by
Fast
Soft.
Handling Finite Element Analysis
stress requires a good understanding of the
stress-concentration effect, quantified as a
factor K
t. The theoritical
stress-concentration factor is based on a
theoritical elastic, homogeneous, isotropic
material and can be expressed as:
nom t
nae2007
The 5th International Conference on Numerical Analysis in Engineering
Noise and Vibration Analysis; Analysis of Machine Element Design
8 - 6
Where:
s
max= Maximum (peak) stress, and
s
nom=
nominal or average stress.
Handling FEA fatigue stresses correctly
also requires good understanding of
fatigue stress-concentration factor,
Kf
. It's
found from.
K
f= S
nf/S
f(7)
where S
nf= fatigue stress at K
t= n, and S
f= fatigue stress at k
t= 1.
The relation between the
fatigue
concentration factor and the
stress-concentration factor is,
1
)
1
(
tf
q
K
K
or
1
1
t f
K
K
q
(8)
where
q
is the fatigue-notch sensitivity
and 0
q
1. Here,
q
= 0 for no notch
and
q
= 1 for a full notch. Average
fatigue-notch-sensitivity values for some
typical materials can be found in Figure
1.31 in
Peterson's Stress Concentration
Factors
.
The relationship between
Kf
and
Kt
shows that
q
plays the important roll in the
fatigue-stress-concentration factor. It
should be obvious that
Kf
Kt
. When
q
is
not available, conservative results come
from using
Kf
=
Kt
or
q
= 1. S-N curves
with
Kt
= 1 are typically applied to FEA
results. By knowing the
q
effect, it can be
shown that S-N curves with
Kt
= 1 still
produce conservative fatigue calculations
for FEA applications because it assumes
q
= 1 or
Kf
=
Kt
. That's why the surface
factor is usually ignored in FEA for
average or machined surfaces.
By Finite Element Analysis, it is not
so easy to determine fatigue life. When we
find the first yield point, it means this
point is in the highest stress state. Then
we can refer S-N curve.
10. Results and Discussion
From this research we can get effect of concentration stress or Kt on strength fatigue with S-N method. On this method only count fatigue life or endurance limit from Journal Bearing.
Figure 7. Picture shows the stresses distribution
nae2007
The 5th International Conference on Numerical Analysis in Engineering
Noise and Vibration Analysis; Analysis of Machine Element Design
8 - 7
Table 1. Fatigue Test for Journal Bearing
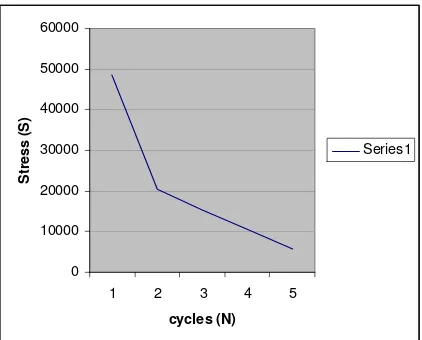
Stress (Mpa) Fatigue life (cycle) 13,872 48671 21,047 20518 27,728 15191 35,312 10513 40,128 5732
From the data we can draw S-N curve for Journal Bearing.
0 10000 20000 30000 40000 50000 60000
1 2 3 4 5
cycles (N)
St
re
s
s
(
S)
Series1
Figure 9. S-N Curve
11. Conclusions
A general approach to modelling the durability of Journal Bearing has been developed.
The approach removes the requirement of rebuilding FEM models in order to capture the important stress raising features which significantly affect fatigue life predictions. The method is ideally suited for predicting data for fatigue life calculations in Journal Bearing.
Example applications have been presented demonstrating some of the capabilities of the method.
References
[1] Fatigue Life and Crack Growth Prediction Using FEM Data, Robert A Adey, John M. W. Baynham, Sharon Mellings, Tom Curtin, Computational Mechanics BEASY, Ashurst Lodge, Southampton, Hampshire, SO40 7AA, UK
[2] Fatique Life Prediction of machined components using finite element analysis of surface topography, S. K. As, B Skallerud, BW Tveiten, B Holme, Science Direct, Elsevier, International Journal of Fatigue, 27 (2005) 1590-1596. [3] Finite element analysis of machine
elements, A bibliography (1977 – 1997), Jaroslav Mackerle, Engineering Com, Vol. 16 No. 6, 1999, MCB University Press.
[4] Calculating and Displaying Fatigue Result, Raymond Browell, Al Hancq, Development Engineer ANSYS, Inc, March 29, 2006.
[5] The Bearing Strength of Fiber Metal Laminates, R. G. J. Van Rooijen, J. Sinke, T. J. De Vries and S. Van Der Zwaag, Journal of Composite Materials, Vol. 40, No. 1/2006.
[6] Herbert Reisman and Peter S. Pawlik,
“ Elasticity”, First Edition, Buffalo Inc.
New York, 1980
[7] Kikuci, M, “ FAST-FEM Analysis
Support Tools “, Update 2001, Tokyo
106.
[8] Larry J. Segerlind, “ Applied Finite
Element Analysis “, Second Edition,