Page 13 - 32
Received: September 29, 2016; Revised: November 27, 2016; Accepted: December 5, 2016 Universitas Muhammadiyah Yogyakarta. Jl. Lingkar Selatan, Kasihan, Bantul, Yogyakarta, Indonesia.
BUILDING AN EARLY WARNING TOWARDS
THE RESILIENCE OF ISLAMIC BANKING IN INDONESIA
Dimas Bagus Wiranatakusuma1, Jarita Duasa2
Abstract. Building an Early Warning Towards the Resilience of Islamic Banking in Indonesia. An early warning system (EWS) is widely used as surveillance mechanism for preserving inancial system stability. his paper addresses the issue of namely which macroeconomic indicators that are capable of signaling adverse shocks towards the resilience of Islamic banking in Indonesia. his research uses an extraction signal approach as EWS mechanism. he results suggest that there are several indicators that (1) IBRI, which is composed from standardized deposit and inancing, is able to igure out the resilience of Islamic banking. he resilience of Islamic banking was considered stable since the index was moving below the normal line during the global inancial crises, and (2) Some selected macro inancial indicators, M2/reserve (M2res), credit growth (CG), real efective exchange rate (REER), and inlation rate (INF) empirically show low noise to signal ratio. It means that these four variables are capable of signaling vulnerabilities due to adverse external shocks. he paper recommends that the resilience of Islamic banking needs to be supported by the resilience in the real sector. Keywords:early warning system, resilience of Islamic banking, extraction signal approach.
Introduction
Islamic banking operation in Indonesia was started in 1992 when the irst full-ledged Islamic bank was established, Bank Muamalat Indonesia. his Islamic bank provely survived from the 1998 Asian inancial crisis without any government assistance. he growth of Islamic banking proliferated rapidly after the new banking act was oicially stipulated in 1998. Afterwards, the Islamic banks operations become widely expanded and well-accepted by all level of society in Indonesia. he growth of Islamic banking industry can be traced back from growth on its asset, deposit, and inancing side. In terms of asset, it grew drastically from only IDR 21 trillion or 0.17% share out of total assets in the banking industry in 2005 to IDR 242 trillion or 4.89% out of total asset in banking industry in 2013. In terms of deposit, it increased from only IDR 16 trillion in 2005 to IDR 184 trillion in 2013. Likewise, in terms of inancing side, there was a signiicant increase from only IDR 15 trillions in 2005 to IDR 184 trillion in 2013. Overall, asset, deposit, and inancing grew steadily on average at 30% over the year 2005 to 2013.
here are two main risk assessments conducted by Bank Indonesia (BI) on Islamic banking, inancing risk and liquidity risk. In terms of inancing risk, in semester I 2015, the growth of gross Non-performing Financing (NPF) had dropped signiicantly from 65.15% in semester II 2014 to 20.79%. his condition is driven by a successful domestic banking consolidation, namely the adjustment of inancing-to-Value (FTV) which enable banking industry aggresively to extend the inancing towards value-added economic sectors for generating economic growth. However, the nominal NPF increased slightly in semester I around 4.72%, from 4.33% in semester II 2014. In general, according to inancing risk assessment, the resilience of Islamic banking is on alert condition NPF ratio almost reaches the stipulated tolerance limit of BI around maximum at 5% (BI Regulation No 15, year 2013).
In terms of liquidity risk, Islamic banks faced a decrease liquidity ratio in semester I 2015. It was shown by dropping the ratio of liquid tools, namely liquid asset (LA) over negotiable certiicate of deposit or banking deposit guarantee (NCD), and liquid asset (LA) over deposited funds (DPK), from 98.16% and 16.31%, in semester II 2014 to 71.30% and 12.60%, respectively in semester I 2015. A higher of ratios indicate that Islamic banking is having a suicient liquid assets over the liabilities, or in other words Islamic banks are capable of avoiding and minimizing liquidity mismatch arising from banking operations. In this case, Islamic banking may expose to liquidity risk due to a decreased in the amount of liquid assets.
ability can preserve the soundness of its balance sheet. he adverse shocks are exogenous shocks which then damage the resilience of Islamic banking due to incomplete markets in inancial system. Incomplete markets denote a condition where markets become incapable to hedge all possible risks exposed into them. his incomplete market may create inancial fragility, contagion, and bubbles in inancial system due to the shocks are not smoothly absorbed. Likewise, Islamic banking can fall into default as its inability to withstand ampliied shocks, shown by deterioration in its balance sheet. Given that the inancial system is interconnected, the failure in Islamic banking can create panic behavior in the markets and ultimately encourage bank-run. he balance sheet then becomes worst as shocks become endogenously deteriorating. A situation which makes Islamic banking fail and may trigger a larger crisis, expressed in a general worsening of Islamic banking’s balance sheets, is due to a deterioration of the macroeconomic environment. On this regards, major crises in inancial system cannot simply be avoided from macroeconomy stability due to there is a dynamic interaction between inancial system - which Islamic banking is part of it – and macro conditions. herefore, unanticipated response from inancial system in absorbing shocks from macroeconomic environment can make Islamic banking fail and may cause chain reactions in a tightening surrounding, including worsening of bank’s balance sheet.
he current study aims to identify which macroeconomic variables are capable of signaling adverse shocks towards the resilience of Islamic banking in Indonesia. his study uses the simple approaches in EWS mechanism as surveillance tools for the resilience of Islamic Banking in Indonesia.
Literature Review
he development of the leading indicators of banking distress and
early-warning systems has long been a main interest of central banks and academics.
Studies on this were written by Caprio and Klingebiel (1996), Lindgren et al. (1996),
Sachs et al. (1996), Honohan (1997),Eichengreen and Rose (1998),
Demirgüç-Kunt and Detragiache (1998, 2000),Hardy and Pazarbasioglu (1999), Glick and
Hutchison (2001),González-Hermosillo (1999), Kaminsky and Reinhart (1999),
Duttagupta R. and P. Cashin (2011), Davis and Karim (2008). In practice, there are approaches commonly used to deal with early warning system (EWS), including non-parametric and parametric approaches.
strong efect on bank fragility in developing countries. Hutchison (2002) estimates multivariate Probit models linking the probability of banking risks to domestic macroeconomic variables and institutional characteristics. He inds that the following variables are strongly and signiicantly associated to banking crisis: inlation, GDP growth, exchange rate turbulence 1 as well as variables describing the characteristics of the inancial and the regulatory environments. Demirgüç-Kunt and Detragiache (1998) ind that low GDP growth, high real interest rates, and high inlation are signiicantly correlated with the occurrence of a banking crisis. Demirgüç-Kunt and Detragiache (2000) compare the results with the signal approach of Kaminsky and Reinhart (1999), and show that their model performs better in terms of in-sample prediction.
Yucel (2011) did some observations regarding a non-exhaustive collection of the early warning literature from 1971 to 2011. In terms of the methodologies, binary dependent variable (the logit analysis) has been the most popular used, meanwhile signal extraction analysis shares the second place.
In the literature, large number of empirical investigations has been carried out using multivariate logit or probit models for developing banking distress leading indicators. Wong et.al (2007), for example, developed a probit econometric model to identify a set of leading indicators of banking distress and estimate banking distress probability for Hong Kong and other EMEAP (Executives’ Meeting of East Asia and Paciic Central Banks ) namely Australia, China, Indonesia, Japan, Korea, Malaysia, New Zealand, the Philippines, Singapore, and hailand economies. Macroeconomic fundamentals, currency crisis vulnerability, credit risk of banks and companies, asset price bubbles, credit growth, and the occurrence of distress of other economies in the region are found to be important leading indicators of banking distress in the home economy. A case study of Hong Kong based on the latest estimate of banking distress probability and stress testing results shows that currently the banking sector in Hong Kong is healthy and should be able to withstand well certain possible adverse shocks. he study also inds that banking distress is contagious, suggesting that to be efective in monitoring banking distress, close cooperation between central banks should be in place.
Further, Wong et.al (2010) developed a panel probit econometric model to identify the leading indicators of banking distress and to estimate the banking distress probability for EMEAP economies. Macroeconomic fundamentals, currency crisis vulnerability, credit risks of banks and non-inancial companies, asset price gaps, credit growth, and the occurrence of distress in other economies are found to be important leading indicators.
system (EWS) model, based on a multinomial logit model, for predicting inancial crises. It is shown that commonly used EWS approaches, which use binomial discrete-dependent-variable models, are subject to what we call a post-crisis bias. We show that applying a multinomial logit model, which allows distinguishing between more than two states, is a valid way of solving this problem and constitutes a substantial improvement in the ability to forecast inancial crises. he empirical results reveal that, for a set of 20 open emerging markets for the period 1993-2001, the model would have correctly predicted a large majority of crises in emerging markets.
Another commonly adopted approach is the signal extraction approach. Extraction signal approach produced variable importance rankings that can be used in the stepwise speciications of logistic regression. his nonparametric approach makes fewer assumptions about the underlying populations, less sensitive to outlying observations, and easier for practitioners to understand. his approach was elaborated by Kaminsky and Reinhart (1996) by evaluating the usefulness of several leading indicators in signaling an impeding crisis. Related to this approach, Gurnain et.al (2013) focused on a quantitative method to identify vulnerabilities, speciically an imbalance indicator model and its application to Canada. he model proves useful for isolating historical imbalances that could be indicators of inancial system vulnerabilities. It complements other sources of information, including market intelligence and regular monitoring of economic and inancial data.
Manasse et.al (2013) employed a recent statistical algorithm (CRAGGING) in order to build an early warning model for banking crises in emerging markets. hey perturb the data set many times and create “artiicial” samples from which we estimated our model, so that, by construction, it is lexible enough to be applied to new data for out-of-sample prediction. he study inds that, out of a large number (540) of candidate explanatory variables, from macroeconomic to balance sheet indicators of the countries’ inancial sector, they can accurately predict banking crises by just a handful of variables. Using data over the period from 1980 to 2010,
the model identiies two basic types of banking crises in emerging markets: a “Latin
Methods
his paper empirically identiies some selected macroeconomic variables that can afect the resilience of Islamic banking. An extraction signal approach is used to examine the resilience of Islamic banking. his approach was initially elaborated by Kaminsky and Reinhart (1996) which later is called an early warning system (EWS). Technically, EWS mechanism evaluates the ability of several variables in signaling a crisis at a certain period of time. his approach is considered as a non parametric approach since it involves monitoring the evolution of a number of economic variables through signaling approach. herefore, the EWS monitors behavior of variables which usually departs from “normal/tranquil” in the period preceeding a crisis. Deviations of these variables from their “normal” level beyond a certain threshold value are considered as sending a warning”signal” of a crisis within a speciied period.
Given that an extraction signal is a non-parametric approach, hence this study provides some stages for building EWS through signal approach, as follows:
1. Deining the Islamic Banking Resilience Index (IBRI)
A bank is exposed to some risks due to its operations which is connected with its assets and liabilities positions. hese risks can trigger instability in the inancial system as bank is the main player in inancial intermediaries . In the context of Islamic banks, some possible risks which are potentially exposed due to external shocks on Islamic banking are: (1) liquidity risk due to the presence of massive bank run; and (2) credit risk due to rising non-performing loans triggered by excessive risk taking behavior. Some studies incorporated massive bank run, withdrawals (Diamond and Dybvig, 1983), and lending booms (Hanohan, 1997) becoming among the most important causes that afecting the resilience of banking system, including in Islamic banking. In respect to maintain the resilience of Islamic banking, this paper develops an Islamic Banking Resilience Index (IBRI) in order to support monitoring tasks by incorporating some components. he components are intended to display the relative importance of the various risks in the composition of the IBRI.
to fulill their current and future obligations and ultimately can afect the fall in banks’ assets. hus, credit risk can occur due to borrowers do not fulill their obligations. In addition, given that banks are diicult due to borrowers’ default, liquidity problems start to emerge. Capital position would be afected as banks need immediate injection to preserve its operation and mitigate systemic risk further arises. his situation may attract some deposits withdrawal from the banks’ account. he problems are compounded if the deposits withdrawal are in massive numbers. herefore, credit risk is perceived as triggering factor in causing liquidity risk.
According to credit and liquidity risks exposure, a monthly IBRI is developed and used to investigate whether Islamic banking is under normal or crisis condition. For the analysis, IBRI is composed by two variables, (1) deposits (DEP), and (2) inancings (FIN). DEP variable is obtained from total of demand, saving, and time deposit collected by Islamic banks. In addition, FIN variable is obtained from total of various type of inancings by Islamic banks.
2. Deining a signal and crisis
Let assume i = a univariate variable, j = a particular country, S = signal variable, and X = variable. A variable relates to variable i and country j is expressed by X j
i and the threshold for this variable is denoted X *ij as . hen, a signal variable
that relates to indicator i and country j is denoted by i. he binary model is then
developed, where i = (0,1), and if the variable crosses the stipulated threshold, a
signal is emitted, i =1.
3. Interpreting a signal and signal
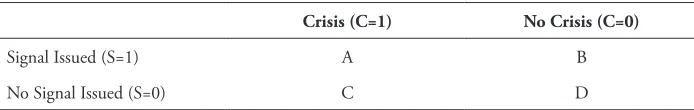
so that B = 0 and D > 0. For sure, none of the indicators it the proile of a perfect indicator, but the matrix will be a useful reference to assess how close or how far is each indicator from that proile.
Table 1. he Performance of Individual Indicator by Using Matrix Crisis-Signal Framework
Crisis (C=1) No Crisis (C=0)
Signal Issued (S=1) A B
No Signal Issued (S=0) C D
Source: Kaminsky, et. al (1998)
4. Determining evaluation criteria
his paper employs six evaluation criteria in order to assess the performance of leading variables which was identiied through crisis-signal framework, as follows: First, he proportion of an observation correctly called = (B+D) + (A+C)A+D , deined as the proportion that all observations correctly bring information about crisis and not crisis. his implies that the higher proportion will lead to best evaluation criteria.
Second, the noise-to-signal-ratio = B/ (B+D)A/ (A+C), it measures the false signals as a ratio of the good signals issued. he selection rule is to pick the variable or model that minimizes the noise to signal ratio (NTS). hird, the proportion of a crisis
correctly called = (A+C)A , deined as the proportion of a crisis happened once the
signal was issued. hus, the higher of its proportion would be itting of a perfect indicator in signaling the crisis. Fourth, the proportion of a false alarm of total
alarms issued = (A+B)B , given that an individual indicator exposes a frequent false
signal. hus, the lower of its proportion would be good to minimize the panic behavior in the markets. Fifth, the proportion of a crisis given an alarm issued =
A
(A+B), given that an individual indicator generates diferent signals. his criterion is
to select indicators that can maximize the probability of a crisis, given a signal was issued as alarm. Sixth, the proportion of probability of a crisis, but given no alarm
issued = (C+D)C , given the signal is important, an occurence of crisis without signals
wa expected small as possible.
5. Determining signaling horizon
signaling horizon would enable policy makers to anticipate a crisis. Meanwhile, Bussiere and Fratzscher (2002) set 12 and 18 month as signaling horizon. hey argues that various time horizons would provide the best achievable trade-of between missing a crisis and a wrong signal. In addition, this paper adds another 3 and 6 months as signaling horizons considering that a crisis is diicult to be predicted. Providing short horizon enables policy makers to react immediately as crisis starts to build up.
6. Determining thresholds
he economy evolves through phases of booms and recession. his change in phase of a particular series is captured empirically by inding a “threshold”. he economy turns a luctuation by examining a given indicator into a signaling process of an upcoming recession or a crisis. he selected threshold is the one that can minimize the noise-to-signal ratio (NTR) of a particular indicator.
7. Determining leading indicators
First, M2/Reserve (M2Res) is used to capture the vulnerability in the economy
due to the sudden capital outlows. he higher ratio M2/total reserve denotes the
increase of likelihood of Islamic banking crisis or reducing the resilience of Islamic banking. Second, credit growth (CG) is deined as the percentage change of the total credit approved in several banks, including national banks, regional development banks, national private banks, and foreign banks. his indicators indicates the fast expansion of loans extension which later would give additional default risk in the banking system. In addition, credit growth which is considered ‘excessive’ may lead to systemic risk, given that inconnectedness in the inancial system. herefore, rapid credit growth episode can increase likelihood of systemic risk and deterioration of banks’ balance sheets. hird, real efective exchange rate (REER) is obtained by delating nominal exchange rate with the ratio of standardized inlation rates (based on a certain base year period). Consumer price index (CPI) United States of America over CPI of Indonesia are used to obtain the standardized ratio of inlation rates. REER is important to measure comparative changes in a country’s real economic circumtances compared other country. If the REER of a country shows a downward trend (overvaluation), it implies that the price of domestic country is higher that foreign price, vice versa. Hence, the overvaluation in the real exchange rate may create an increased possibility of crises due to a domestic country prefers to imports to exports. Fourth, inlation rate (INF) is deined as the diference of CPI between current CPI and previous CPI after being standardized. he higher degree of inlation implies that likelihood of crises would occur due to eroding purchasing power of parity.
Table 2.
Summary of the Indicator, Tranformation, Frequency, and hreshold Position
Variable Transformation Frequency hreshold Position
M2/Res Level Monthly Data Over Zero Line
CG 12 month change Monthly Data Over Zero Line
REER Level Monthly Data Below Zero Line
INF 12 month change Monthly Data Over Zero Line
Result and Discussion
he Performance of Islamic Banking Resilience Index
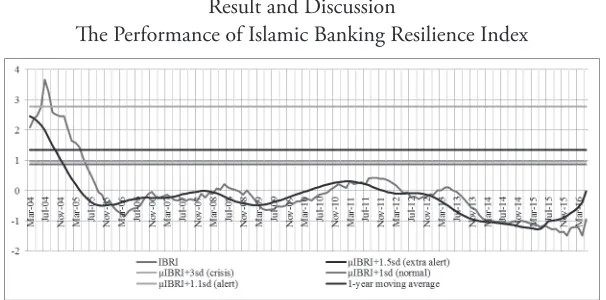
Figure 1. Islamic Banking Resilience Index (IBRI)
Figure 1 shows the Islamic Banking Resilience Index (IBRI) since March 2004 till May 2016. Generally, IBRI measures and monitors the level of resilience of Islamic banking in Indonesia. Empirically, IBRI is capable of providing information on the ups and downs in the resilience of Islamic banking with respect of various economic vulnerabilities indicators. Figure 1 also presents facts that in 2004, the resilience of Islamic banking was worst, indicated the IBRI is above green line, which was in crisis area. But, the trend is gradually decreasing and until may 2016, the resilience is below normal area (purple line). In addition, according to orange line, which relects the 1-year moving average of IBRI, the trend is increasing and showing excessive risk taking starts to happen in Islamic banking. Hence, the policy makers should keep prudent in regulating Islamic banking operations in Indonesia.
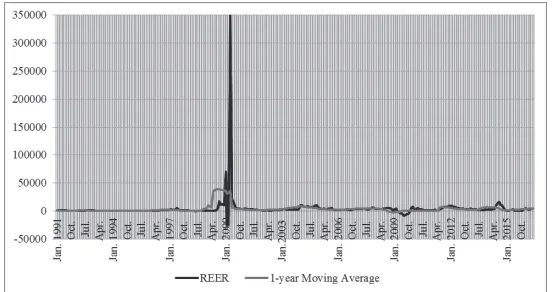
Figure 2. he Performance of M2/Reserve in Indonesia, Period 1990 – 2016 (Monthly Basis)
Figure 2 shows the performance of M2/res in Indonesia over 1990 – 2016 in monthly basis. According to the igure, the red line, which is the 1 year moving average, is exceeded several times by the blue line (M2/res variable). It indicates that M2/res is pressured and possibly got shocks as economic deteriorated. Period of 1998, 2005, 2008, are the years where economic and inancial distress hit severely into Indonesia’s economy, as shown in the igure 1.
Figure 3 shows the performance of credit growth in Indonesia over the
period of 1990-2016 in monthly basis. Figure 3 obviously presents some abnormal behavior of credit growth, indicated by exceeding the red line. here are six period where credit growth is considered showing abnormal behavior, namely in 1990, 1998, 2000, 2006, 2008, and 2014. In all these abnormal period, credit growth seems to be declining once it grows rapidly or excessively. Hence, credit growth can be seen to represent the period of boom and burst in the inancial cycle.
Figure 4 shows the performance of REER in Indonesia since 1990-2016 in monthly basis. Interestingly, over the period of observation, REER presents an abnormal behavior only during Asian inancial crisis in 1998. It relects during this crisis, Indonesia’s economy is hit severely by crisis so lossing its competitiveness eventhough theoretically REER is undervalued compared to foreign prices.
Figure 4. he Performance of Real Efective Exchange Rate in Indonesia, Period 1990 – 2016 (Monthly Basis)
Figure 5 shows the performance of inlation rate in Indonesia since 1990 to 2016. During Asian inancial crisis, inlation rate was extremely high, but gradually decreases and shows a low level by 2016. Likewise, during global inancial crises in 2007-2008, inlation rate was quite high and exceeded the red line. Hence,an increase in inlation rate could be a clear indication of a country’s deterioration.
The Signal Generating Mechanism on Several Leading Variables
his section explains the performance of every leading variable by using signal exytraction signal approach. his paper applies several threshold multiplier, namely according to kaminsky (1996) – 3 standard deviation, Garcia (1999) - 1.5 standard deviation, Park (2001) – 1.1 standard deviation, and Lestano, et.al (2003) – 1.0 standard deviation. In addition, to evaluate the predictive power of every leading variable in detecting crisis, this paper uses diferent time horizon, namely 3 month, 6 month, 12 month, 18 month, and 24 month.
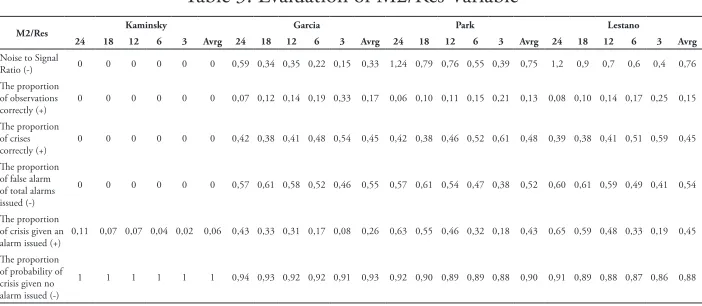
Table 3. Evaluation of M2/Res Variable
M2/Res Kaminsky Garcia Park Lestano
0,11 0,07 0,07 0,04 0,02 0,06 0,43 0,33 0,31 0,17 0,08 0,26 0,63 0,55 0,46 0,32 0,18 0,43 0,65 0,59 0,48 0,33 0,19 0,45
he proportion of probability of crisis given no alarm issued (-)
1 1 1 1 1 1 0,94 0,93 0,92 0,92 0,91 0,93 0,92 0,90 0,89 0,89 0,88 0,90 0,91 0,89 0,88 0,87 0,86 0,88
Table 3 shows the results of evaluations of the M2/Res as leading indicator by using signal approach. he main conclusion is that kaminsky is the best option to be used as leding indicator in various time horizon. he lowest level of noise to signal indicates that kaminsky’s approach is capable of minimizing wrong signal and miss signal in detecting crisis. According to table 3, indicator M2/res can be used to detect either in the short or long window period. It means that M2/res is so relevant to show signs for some possibilities of any upcoming Islamic banking instability. he M2/res indicator is closely related with exchange rate luctuations. Given that exchange rate deeply depreciated, central bank will intervene seriously and trigger reserve shortage in the central bank. herefore, M2/res indicator is considered as very sensitive sign to oversee the possibility of abnormal behavior in Islamic banking operations.
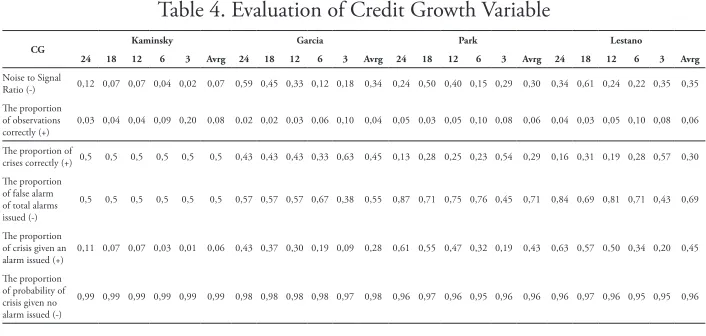
through overheating the business cycle. he boom and burst of business cycle are due to business cycle showing cyclical ups and downs which is then called as procyclicality behavior. he procyclicality behavior is fueled by credit extension that becomes main sources of economic transactions in the modern era. herefore, the 3 month windows period indicates that credit turnovers are fast and may lead to Islamic banking stress.
Table 4. Evaluation of Credit Growth Variable
CG Kaminsky Garcia Park Lestano
0,03 0,04 0,04 0,09 0,20 0,08 0,02 0,02 0,03 0,06 0,10 0,04 0,05 0,03 0,05 0,10 0,08 0,06 0,04 0,03 0,05 0,10 0,08 0,06
he proportion of
crises correctly (+)0,5 0,5 0,5 0,5 0,5 0,5 0,43 0,43 0,43 0,33 0,63 0,45 0,13 0,28 0,25 0,23 0,54 0,29 0,16 0,31 0,19 0,28 0,57 0,30
he proportion
0,11 0,07 0,07 0,03 0,01 0,06 0,43 0,37 0,30 0,19 0,09 0,28 0,61 0,55 0,47 0,32 0,19 0,43 0,63 0,57 0,50 0,34 0,20 0,45
he proportion of probability of crisis given no alarm issued (-)
0,99 0,99 0,99 0,99 0,99 0,99 0,98 0,98 0,98 0,98 0,97 0,98 0,96 0,97 0,96 0,95 0,96 0,96 0,96 0,97 0,96 0,95 0,95 0,96
Table 5. Evaluation of REER Variable
REER Kaminsky Garcia Park Lestano
0,11 0,07 0,11 0,04 0,02 0,07 0,43 0,38 0,29 0,18 0,08 0,27 0,61 0,53 0,46 0,32 0,18 0,42 0,61 0,54 0,52 0,34 0,21 0,44
he proportion of probability of crisis given no alarm issued (-)
1 1 1 1 1 1 0,96 0,95 0,94 0,94 0,94 0,95 0,85 0,84 0,86 0,87 0,88 0,86 0,14 0,15 0,16 0,15 0,14 0,15
transactions in real and inancial markets. With that fast changing situation, the REER would greatly be sensitive towards international envirounment and therefore it needs to be monitored frequently as early warning indicator.
Table 6. Evaluation of Inlation Rate Variable
INF Kaminsky Garcia Park Lestano
crises correctly (+)0,86 1 0,86 0,86 0,87 0,89 0,52 0,47 0,5 0,37 0,65 0,50 0,22 0,33 0,33 0,28 0,55 0,35 0,2 0,37 0,37 0,35 0,6 0,38
he proportion
0,10 0,07 0,07 0,03 0,01 0,06 0,41 0,36 0,28 0,18 0,08 0,26 0,61 0,53 0,46 0,32 0,17 0,42 0,62 0,55 0,49 0,34 0,18 0,43
he proportion of probability of crisis given no alarm issued (-)
0,98 0,98 0,97 0,97 0,97 0,97 0,96 0,92 0,95 0,95 0,95 0,95 0,93 0,95 0,95 0,95 0,95 0,95 0,92 0,95 0,94 0,94 0,94 0,94
Table 6 presents some evaluation criteria for inlation variable as leading indicator. he results clearly show that the predictive power of inlation variable is strong by using kaminsky’s approach due to lowest noise to signal ratio. In terms of time horizon, the lowest noise is 18 month horizon. he longer of window horizon indicates that the level of inlation in Indonesia is controllable. It is shown by Bank Indonesia’s publication that over time the inlation rate is decreasing. In other words, inlation rate shows a stable trend and it implies that early warning signal can be made in the more longer window periods.
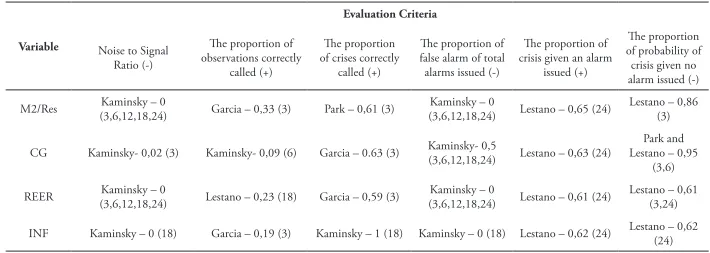
Table 7. he Summarize of Performance on Leading Indicators
Variable
CG Kaminsky- 0,02 (3) Kaminsky- 0,09 (6) Garcia – 0.63 (3) Kaminsky- 0,5
(3,6,12,18,24) Lestano – 0,63 (24)
Park and Lestano – 0,95
(3,6)
REER Kaminsky – 0
(3,6,12,18,24) Lestano – 0,23 (18) Garcia – 0,59 (3)
Kaminsky – 0
(3,6,12,18,24) Lestano – 0,61 (24)
Lestano – 0,61 (3,24)
INF Kaminsky – 0 (18) Garcia – 0,19 (3) Kaminsky – 1 (18) Kaminsky – 0 (18) Lestano – 0,62 (24) Lestano – 0,62 (24)
Table 7 summarizes the performance of several leading indicators included in the paper. Table 7 informs that four indicators are relevant as leading indicators for the resilience of Islamic banking in Indonesia. It is relected by the low noise to signal ratio, almost zero, and low the proportion of false alarm of total alarms. hese results are obtained by using kaminsky approach which employ 3, 6, 12, 18, 24 month time horizon. Looking at time horizon, the 3 month is seen as best horizon to predict the likelihood of a crises into Islamic banking. It seems relevant in the midst of fast changing of current domestic and global economy. he short time horizon indicates the need for policy makers to prepare early anticipation as macroinancial variables start to behave abnormal. Meanwhile, lestano’s approach is consistently able to capture best result on the proportion of crisis given an alarm. It implies that this approach is suitable to detect a signal followed by a crisis in the following 24 month. hereore, all indicators are able to send alarm signals for 24 months before a crisis and implies these indicators can make policy makers more well-prepared in designing crisis management protocol in Indonesia.
Conclusion
his paper basically attempts to build an early warning system for the resilience of Islamic banking in Indonesia. he Islamic Banking Resilience Index (IBRI) is developed to help monitoring and anticipating the potential vulnerabilities in Islamic banking. In addition, some selected macroinancial indicators are employed, such as M2/reserve, credit growth, real efective exchange rate, and inlation rate. Technically the paper uses several level of thresholds which are able to capyure the level of resilience of Islamic banking in Indonesia. Moreover, some time horizon, such as 3, 6,12,18, and 24 months are incorporated to obtain predictive power of above selected macroinancial variables in signaling a crisis.
References
Adiningsih, S., Setiawati, D. N., & Sholihah. (2002). Macroeconomic Vulnerability
in Indonesia. EADN Regional Project. Bangkok.
Bank Indonesia. Kewajiban Penyediaan Modal Minimum Bank Umum, Pub. L. No. 15/12/PBI/2013 (2013). Indonesia: Bank Indonesia.
Bussiere, M, and M. Fratzscher (2002). “Towards a New Early Warning System of
Financial Crises”, European Central Bank Working Paper, No. 145
Caprio, G. Jr. and Klingebiel, D. (1996), “Bank Insolvency: Bad luck, Bad Policy or Bad Banking?”, Paper presented at the 1996 Annual Bank Conference on
Development Economics, World Bank Economic Review, January 1997
Davis, E. and D., Karim (2008). “Comparing Early Warning Systems for Banking Crisis”, Journal of Financial Stability, 4, 89-120
Demirgüç-Kunt, A. and E. Detragiache (1998). ‘he Determinants of Banking
Crises: Evidence from Developing and Developed Countries”, IMF Staf
Papers, 45, 81-109.
Demirgüç-Kunt, A. and E. Detragiache. (2000). “Monitoring Banking Sector
Fragility: A Multivariate Logit”, World Bank Economic Review, 14(2),
287-307.
Duttagupta R. and P. Cashin (2011). “Anatomy of Banking Crises in Developing
and Emerging Market Countries”, Journal of International Money and
Finance, 30, 354-376.
Eichengreen, B. and A. Rose (1998). “Staying Aloat When the Wind Shifts:
External Factors and Emerging-Market Banking Crises”, NBER Working
paper no. 6370, January
Glick, R. and M. Hutchison (2001). “Banking and Currency Crises: How Common
Are Twins?” in R. Glick, R. Moreno and M. Spiegel (eds.), Financial Crises in
Emerging Markets, Cambridge University Press, Cambridge, UK.
González-Hermosillo, B. (1999). “Determinants of Ex-Ante Banking System Distress: A Macro-Micro Empirical Exploration of Some Recent Episodes”, IMF Working Paper 99/33, March.
Gurnain Pasricha, Tom Roberts, Ian Christensen & Brad Howell (2013) Assessing
Financial SystemVulnerabilities: An Early Warning Approach, Bank of
Canada Review, Autumn 2013, pp. 10-19
Hardy, D. and C. Pazarbasioglu (1999), “Determinants and Leading Indicators of
Banking Crises: Further Evidence”, IMF Staf Papers, 46, 3, 247-58.
Macroeconomic Vulnerability in Latin American Countries (No. 2233). Policy Research Working Paper. Washington DC. Retrieved from
Honohan, P. (1997), “Banking System Failures in Developing and Transition Countries: Diagnosis and Predictions”, Working Paper 39, Bank for International Settlements.
Hutchinson, M. (2002). “European Banking Distress and EMU: Institutional and
Macroeconomic Risks”, Scandinavian Journal of Economics, 104(3), 365-389
Kaminsky, G., Kizondo, S., and Reinhart, C. M. (1998). Leading Indicators of
Currency Crises. IMF Staf Papers Staf Papers, 45(1), 48.
Kaminsky, G.,L., and Reinhart, C. (1996). “Banking and Balance of Payment Crises: Models and Evidence”. Washington DC: Board of Governor of the Federal Reserve System.
Kaminsky, G. and Reinhart, C.M. (1999),‘he Twin Crises: the Causes of Banking
and Balance of Payments Problems’, American Economic Review, 89, 473-500
Kibritcioglu, Aykut, (2003) “Monitoring Banking Sector Fragility, he Arab Bank
Review, Vol 5, No.2 October.
Lindgren, C. J., Garcia, C., and Saal, M. (1996), Bank Soundness and Macroeconomic
Policy, International Monetary Fund, Washington DC.
Lestano, Jan Jacobs, and Gerard H. Kuper. (2003) “Indicators Of Financial Crises do Work!: An Early Warning System for Six Asian Countrie”, CCSO Working Paper 13, Department of Economics, University Of Groningen, Netherland. Matthieu Bussiere & Marcel Fratzscher (2006), Towards a new early warning system
of inancial crises, Journal of International Money and Finance 25, pp.
953-973.
Manasse, Paolo , Roberto Savona & Marika Vezzoli (2013) Rules of humb for
Banking Crises in Emerging Markets, Quaderni - Working Paper DSE No.
872, University of Bologna, Italy.
Park, Won-Am. (2001) “An Indicators on the Sustainable Development of Korea”, Paper prepared for EADN meeting, Singapore, June 25-27, 2001.
Sachs, J. D., Tornell, A., and Velasco, A. (1996), “Financial Crises in Emerging Markets: the Lessons from 1995”, Working Paper 5576, National Bureau of Economic Research.
Wong, Jim and Wong, T. C. and Leung, Phyllis (2007) A Leading Indicator Model of Banking Distress - Developing an Early Warning System for Hong Kong
and Other EMEAP Economies (December 18, 2007). Hong Kong Monetary
Wong J, TC Wong & P Leung (2010) Predicting banking distress in the EMEAP
economies, Journal of Financial Stability, vol. 6, issue 3, pp.169-179
Yucel, E. (2011). A Review and Bibliography of Early Warning Models. Munich