Received December 24, 2015 Published as Economics Discussion Paper January 27, 2016 Vol. 10, 2016-19 | July 12, 2016 | http://dx.doi.org/10.5018/economics-ejournal.ja.2016-19
Measuring the Instability of China’s Financial
System: Indices Construction and an Early
Warning System
Lixin Sun and Yuqin Huang
Abstract
In this paper, employing several econometric techniques, the authors construct a financial stress index (CNFSI) and a financial conditions index (CNFCI) to measure the instability of China’s financial system. The indices are based on the monthly data collected from China’s inter-bank markets, stock markets, foreign exchange markets and debt markets. Using these two indices, the authors identify the episodes of systemic financial stress, and then evaluate the indices. The empirical results suggest that the CNFSI performs better than the CNFCI. Furthermore, the authors propose four leading indicators for monitoring China’s financial instability, and provide a primary early warning system for China’s macroprudential regulations. Finally, they conduct a test to evaluate the predictive power of the CNFSI and the early warning system with reference to the 2015 episode. Their results suggest that both work well.
JEL G18 C43 E44
Keywords Financial stress index; financial conditions index; China’s financial system;
leading indicators; early warning system Authors
Lixin Sun, Center for Economic Research, Shandong University, China, [email protected]
Yuqin Huang, School of Finance, Central University of Finance and Economics, China
Citation Lixin Sun and Yuqin Huang (2016). Measuring the Instability of China’s Financial System: Indices
1
Introduction
The global financial crisis of 2008 has renewed the post-crisis research interests in the instability of the financial sector. Although full-blown financial crises did not occur in China during past decades, China did experience several periods of financial instability since 1978. Specifically, the high non-performing loans ratio in China’s banking sector harms the soundness of the financial system, thereby depressing China’s sustainable rapid economic development during the mid-1990s. Empirical studies have suggested that the stability of financial system is not only the precondition but also the foundation for sustainable economic developments.1 Therefore, exploring the methods to measure and monitor the instability of China’s financial system, and thereby providing early warning signals and preventing possible financial distress has important implications for ensuring the stability of China’s financial system and sustainability of China’s economic growth.
In this paper, first, we construct a financial stress index (FSI) and a financial conditions index (FCI) to measures the systemic risks in China’s financial system. Several techniques, including GARCH modelling, VAR approach and econometric benchmarking are employed in developing two indices. China’s FSI (CNFSI) is calculated by summing several sub-indices with the equal-variance weighting. These sub-indices gauge the instabilities of different financial markets, including interbank markets, stock markets, foreign exchange markets and debt markets. China’s FCI (CNFCI) is built up by extracting the financial information from the numerous variables, which measure the conditions of China’s macroeconomy and financial markets (same four markets as those in constructing the CNFSI). The weights in constructing the CNFCI are derived from a structural VAR model.
Second, by using these two indices, we identify the episodes of financial stress for China, and then conduct predictive tests and total errors analysis to evaluate them. The predictive tests show that both CNFSI and CNFCI perform better, but the empirical results from total errors analysis suggest that the CNFSI is more suitable for measuring and assessing China’s financial instability than the CNFCI.
_________________________
Third, we seek to find some variables that help predict the systemic financial stress identified by the indices. Based on the empirical results, we propose four types of leading indicators for monitoring China’s financial instability: the growth rates of deposits and loans (Credit Indicator), real estate prosperity index or housing price index (Investment or Property Indicator), CPI inflation (Price Indicator) and the growth rates of M2 (Monetary Indicator). Combining the leading indicators and the CNFSI constructed, finally, we provide a primary early warning system for China’s macroprudential regulations. Moreover, our predicting test shows that the early warning system works well in providing early warning signals to the 2015 episode.
The rest of the paper is structured as follows. Section 2 provides a literature review. Section 3 describes the data. Section 4 constructs the indices, identifies the episodes of financial stress, and compares the two indices. Section 5 examines the leading indicators for China’s financial instability and proposes an early warning system for China’s macro-prudential regulations. Section 6 concludes.
2
Literature Review
Many measures of systemic risk have been developed, one direction of which is attempting to construct a continuous financial index, which contains an entire set of information that describes conditions of the entire financial system, either loose or stress by predetermined standards. These financial indices, including FSIs and FCIs, which can “provide a timely snapshot of the contemporaneous severity in a financial system”, and can be “updated in a more timely fashion with forwarding-looking features” according to Illing and Liu (2003), are very useful in measuring and assessing the soundness or instability of a financial system. The indices eliminate some drawbacks derived from binary measures and logit models for systemic risk. Moreover, a well-constructed index “should not be meaningful as a monitoring tool but also useful within a large EWS (Early Warning System)” (Illing and Liu 2003).
financial stress indices for emerging markets (EM-FSI). Table B in the Appendix provides a summary description of the empirical studies of various FSIs.
The monetary condition index (MCI, Freedman 1994) introduced by the Bank of Canada is a prototype of FCI. MCI, calculated by weighted average of the refinancing rate and the exchange rate, evolved into a financial conditions index by broadening its scope of variables. Hatzius et al. (2010) defines financial conditions as “the current state of financial variables that influence economic behaviour and (thereby) the future state of the economy. Theoretically, such financial variables may include anything that characterizes the supply or demand of financial instruments relevant for economic activity.” Hence, an FCI should cover all the contents about the future state of the economy contained in these current financial variables. Using similar methodology as in constructing an FSI, Angelopoulou et al. (2013) summarizes several ways from which the weights of FCIs are generally derived: (1) structural models as in Goodhart et al. (2002); (2) reduced form models likely in Mayes and Viren (2001); (3) Principal Components Analysis in Forss et al. (2011); (4) impulse responses of a VAR or Kalman filter. FCIs have been developed for a number of countries (US, Canada, Finland, Sweden, Germany, UK, Euro area etc.). Table C in the Appendix presents a detailed description of FCIs. Hatzius et al. (2010) argued that “an FCI should measure financial shocks-exogenous shifts in financial conditions, eliminating variability in the financial variables that can be explained by current and past real activity” so that it reflects exogenous information associated with the financial sector rather than feedback from macroeconomic conditions, which are incorporated into most “old” FCIs. Against this background, our CNFCI follows most old ones.
Some researchers, for example, Hatzius et al. (2010), take FSIs as a special form of FCIs, hence, FCIs should reflect the information contained in FSIs and beyond. However, Oet et al. (2011) argued that a financial stress index approach is more fitting than a financial conditions approach.
reserves, real exchange rate, credit growth, real GDP growth and the current account balance as a percentage of GDP are the most reliable indicators to explain crisis incidence. A typical non-parametric EWS, the so called “Signal” approach developed by Kaminsky et al. (1998), involves monitoring the evolution of a number of leading economic indicators, issuing a signal that a crisis of financial instability could occur within the next 24 months when one of these indicators deviates from a given threshold. To predict the risks of banking crises and explore the nexus between the monetary stability and financial stability, Borio and Lowe (2002a, 2002b) use the asset price and credit indicators. Comelli (2013) conducts a broad comparison about the in-sample and out-of-sample performances of three parametric and non-parametric early warning systems (EWS) for currency crises in emerging market economies. The framework of the leading indicators and EWS in this study follows Kaminsky et al. (1998).
3
China’s Financial System and Data
3.1
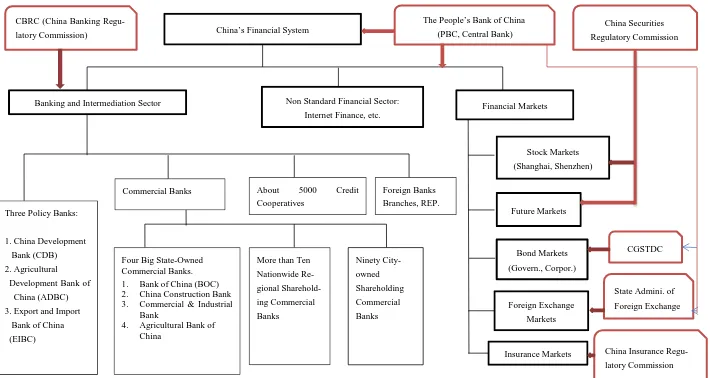
China’s Financial and Financial Regulation System
Figure 1: China’s Financial and Financial Regulation System
Three Policy Banks:
1. China Development 2. China Construction Bank 3. Commercial & Industrial
Bank
4. Agricultural Bank of China About 5000 Credit
Cooperatives
Foreign Banks
Branches, REP. China’s Financial System
Banking and Intermediation Sector Financial Markets
CBRC (China Banking
Regu-latory Commission)
The People’s Bank of China
(PBC, Central Bank)
State Admini. of
Foreign Exchange
China Insurance
Regu-latory Commission Non Standard Financial Sector:
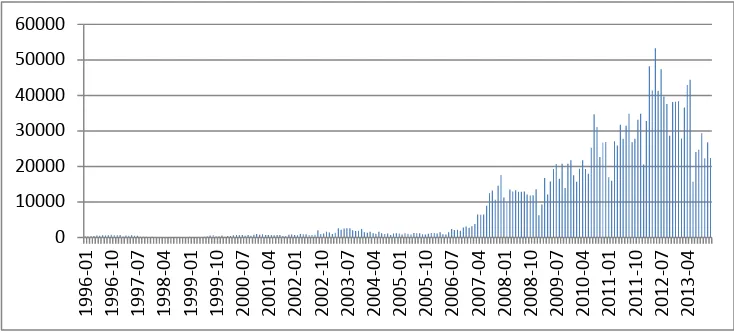
China’s money market consists of three submarkets; the inter-bank borrowing market, the inter-bank bonds repurchase market and the commercial paper market. The inter-bank borrowing market of China has operated since 3 January 1996, when the number of members was 63. In 2002 there were more than 500 participants and at the end of 2005 there were 695 members. These comprised policy banks, commercial banks, financial companies, insurance institutions, security brokers, investment funds and foreign banks. At the end of 2012, the monthly trade volumes of the inter-bank market reached 3.8236 trillion (RMB). Trade categories include overnight, 7 days, 14 days, 20 days, 30 days, 60 days, 90 days and the longest maturity of 4 months (120 days). Figure 2 summarises the trade volumes of the inter-bank market since 1996.
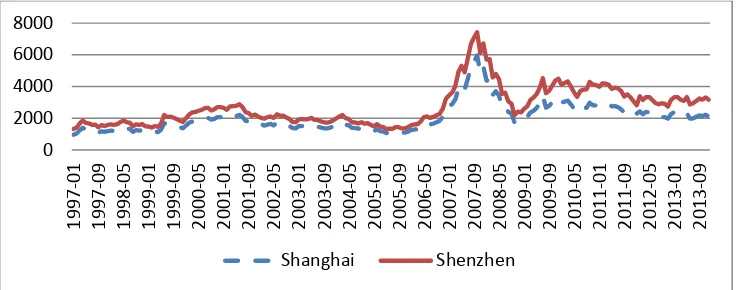
Two stock markets, the Shanghai Stock Exchange and Shenzhen Stock Exchange, were established in 1990. After two decades of development, they are still underdeveloped and inefficient in allocating the financial resources due to large speculations and inside trading, but they are becoming increasingly important in China’s economic development. The market value of two stock markets was approximately 2.304 trillion yuan and the trade volume was approximately 0.317 trillion yuan (RMB) in December 2012. China’s Securities Regulatory Commission, established in October 1992, is responsible for regulating the stock markets and the futures markets, which are very small and in a primary development stage. Figures 3 and 4 present the evolution of the stock indexes and trade volume for China’s stock markets, respectively.
Figure 2: Trade Volumes in China Interbank Money Market (Unit: 100 Million Yuan)
Source: CEInet statistics database
Figure 3: Trade Volumes of Chinese Stock Markets (Unit: 100 Million Yuan)
Figure 4: Stock Indexes of China’s Stock Markets
Source: CEI
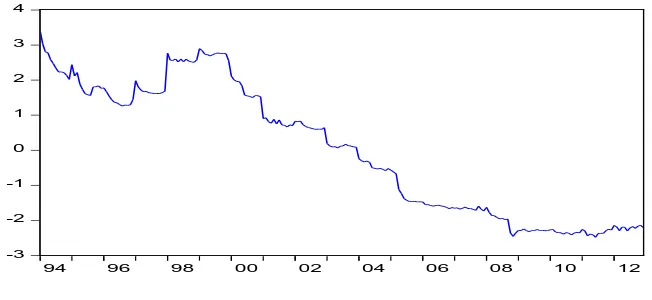
China kept a fixed exchange rate system for a long time; the foreign exchange transactions have been strictly controlled by the government up to now although some deregulation is under way. With the capital flows being controlled, China can have an independent monetary policy under a fixed exchange rate regime. The participants of foreign exchange markets are primarily composed of institutional investors in China. On 21 July 2005, the Chinese government reformed the exchange rate regime by moving to a managed floating exchange rate system with reference to a basket of currencies. On 18 May 2005, foreign currency trading was formerly launched in the inter-bank foreign exchange market where spot transactions of eight currency pairs were conducted. This included the euro vs. US dollar, the Australian dollar vs. the US dollar, the British pound vs. the US dollar, the US dollar vs. the Swiss franc, the US dollar vs. the HK dollar, the US dollar vs. the Canadian dollar, the US dollar vs. the Japanese yen, and the euro vs. the Japanese yen. On 2 August 2005, the PBC released a Notice on Expanding Designated Banks Forward Purchases and Sales Business and Launching RMB and Foreign Currencies Swaps which permits qualified commercial banks to undertake RMB and foreign currency swaps. Further, on 4 January 2006, the PBC issued the Public Announcement on Further Improving the Inter-Bank Spot Foreign Exchange Market (Public Announcement of the PBC No. 1[2006]), introducing the market-maker system and over the counter transactions (OTC transactions) into the inter-bank spot foreign exchange market. By the end of 2013,
China’s currency had appreciated approximately 30%. Figures 5 and 6 show the evolution of the exchange rates and foreign exchange stock in China since 1995, respectively. The foreign exchange markets are regulated by the State Administration of Foreign Exchange, which is directed by the PBC (the head of the State Administration of Foreign Exchange is generally one of the deputy presidents of the PBC).
China’s insurance markets are also dominated by large state-owned insurance corporations, which are regulated by China Insurance Regulatory Commission (CIRC).
Figure 5: Changes in Exchange Rates of RMB against the US Dollar since 1995
Source: CEI
Figure 6: Foreign Reserves Accumulation since 1995
The PBC, CRBC, CSRC, and CIRC are parallel regulators under the State Council, China’s central government, while the PBC is authorized to oversee the monetary and financial stability.
3.2
Variables and Data
Following the extensive literature on financial indices and indicators, we choose various observable variables in designing our indices to reflect the panorama of financial conditions in China. Most chosen variables cover the period from Jan. 1994 to Dec. 2012 with monthly frequency sourced from the databases of China Economic Information Network (CEIN), Wind Information Co. Ltd (Wind), the People’s Bank of China (PBC), China Banking Regulatory Commission (CBRC) and National Bureau of Statistics (NBS). While our data are of high quality, we still face some severe constraints: the non-performing loans ratios are annual, the housing price index is not available after 2012, and most bond yield data dated from Jan. 2012. For a detailed description of variables and data sources, see Table A in the Appendix.
China’s financial system mainly comprises the banking sector (interbank markets), equity markets, debt markets, foreign exchange markets, and derivative security markets. Given that the derivative markets are tiny, underdeveloped and very shallow at the moment, we focus on the former four markets in this paper. The variables employed in constructing an FSI and an FCI for China’s economy include various spreads, non-performing-loans ratio, deposits-to-loans ratio, exchange rates and foreign reserves, stock index, see Table A in the Appendix and Section 4.
4
Indices Construction and Evaluation
4.1
A National Financial Stress Index for China’s Financial System
(CNFSI)
Our FSI designed to gauge the severity of financial instability in China comprises eight variables covering four markets: banks risk spread, banks non-performing loan ratio, and banks loan-to-deposit ratio for banking industry; Shanghai stock market index for stock markets; exchange rate and foreign reserves for foreign exchange markets; and risk spread and sovereign spread for debt markets. As mentioned in Section 3, the variables are summarized in Table A of the Appendix.
4.1.1 Banking Sector
Referring to China’s financial regulating practice (NPL ratio and Loans-to-Deposits ratio are two key instruments of macroprudential regulation by the CBRC), and following Lai and Lv (2010), Cardarelli et al. (2009), Hakkio and Keeton (2009), Illing and Liu (2003), and Oet et al. (2011), we adopt the following three measures with four variables to reflect the stress in the banking sector: risk spread, non-performing loans ratio, and overall loans-to-deposits ratio. The FSI for the banking sector (BankFSI) is calculated by variance-equal weighting.
Risk spread
Risk spread in banking sector is the spread between risky and risk-free rates to reflect the interbank liquidity constraints and the expectations of default risk.2 The calculation is
Interbank Risk Spreadt=3 mons Lt – 3 mons TBRt (1)
where 3 mons Lt denotes the three-month borrowing rates in China’s interbank market; 3 mons TBRt is the three-month government bond rates.
_________________________
Non-Performing loan ratio
The overall non-performing loan ratio for the state-owned commercial banks3 is chosen to assess the stress of banking sector in China. This is because the capital owned by the state commercial banks dominated the capital structure of China’s banking industry.4 The data source is from the website of China Banking Regula-tory Commission, the official regulator of China’s banking system, and Shi and Peng (2003).
Loans-to-Deposits ratio
This variable measures the constraint and default risks faced by China’s banking sector. The calculation is straightforward.
FSI for the banking sector (BankFSI)
Using equal-variance weighting method, we build a sub-FSI for China’s banking industry since 1997, shown in Figure 7.
Figure 7 reveals that the stress in China’s banking sector reached a peak in 1999, which coincides with the identified bank crisis in later 1998 by Laeven and Valencia (2008); then, the BankFSI decreased gradually (The soundness of China’s banking sector was improved after 2000).
If we exclude the bank risk spread because the data are not available until 1997, an alternative BankFSI for China’s banking sector covering the period from January 1994 to December 2012 is obtained (Figure 8). Figure 8 shows two episodes of banking stress: 1994-1995 and 1998-1999. Comparing Figure 8 with Figure 7, we see that the second BankFSI is more smoothing than the first one, and two BankFSIs demonstrate similar trends after 1997.
_________________________
3The state-owned commercial banks in our paper are composed of the so-called “Big-Four” and other commercial banks in which the main shareholders or the biggest shareholders are local governments or state-owned corporations. The assets of these commercial banks attained approximately 82% of the total assets of China’s commercial banking industry, according to the statistics by CBRC at the end of 2015.
Figure 7: A Financial Stress Index for China’s Banking Sector (BankFSI)
Figure 8: Financial Stress Index without Risk Spread for China’s Banking Sector
4.1.2 Stock Markets
The systemic stress and risks in stock markets are measured by the volatility of the stock index. We estimated the volatility using a GARCH (1, 1) model.
Following Bollerslev and Chou (1992), a simple GARCH (1, 1) model is defined as
0 , (0,1)
t t t
V =C +
θ
X′+ε ε
IID (2)2 2 2
1 1
.
t
c
t tσ
=+
αε
+
−βσ
− (3)-4 -2 0 2 4 6 8
94 96 98 00 02 04 06 08 10 12
-3 -2 -1 0 1 2 3 4
where
V
t denotes the month-to-month change in the Shanghai stock market index in our study, and the standard deviationσ
t predicts the risk in the stock market.The FSI for China’s stock markets (SMFSI) constructed by GARCH (1, 1) is presented in Figure 9. The figure indicates that China’s stock markets are very volatile over the examined period.
Figure 9: China’s Stock Market FSI (SMFSI)
4.1.3 Foreign Exchange Market
The stress in China’s foreign markets is also measured by the volatility. Following Balakrishan et al. (2009), the FSI for foreign exchange markets (EMFSI) is defined as
t t
t t
t e t RES
e RES
e
RES
EMFSI
µ
µ
σ
∆ ∆σ
∆ ∆∆ −
∆
−
=
−
(4)where
∆
e
t denotes the month-to-month change in real exchange rate, and∆
RES
tis the month-to-month change in foreign reserves;
µ σ
x,
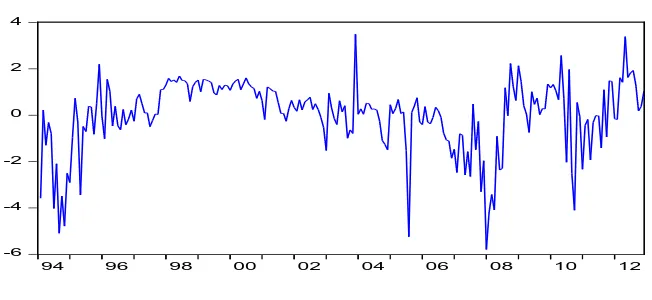
x represent the average values and standard variances of the respective variables, respectively.Figure 10 depicts the EMFSI for China’s foreign exchange markets. EMFSI captures several episodes of exchange rate volatilities in China’s foreign exchange market including an abrupt appreciation in later 1994 and then deep depreciation in 1995 by China’s government to enhance the exports, the announcement on a
-6 -5 -4 -3 -2 -1 0 1 2 3
floating exchange system by China’s government in 2005, the global financial crisis of 2008, and the Euro area sovereign debt crisis, all these produced dramatic fluctuations in EMFSI, shown by Figure 10.
Figure 10: FSI for China’s Foreign Exchange Market (EMFSI)
4.1.4 Debt Market
Two indicators are employed to measure the stress in China’s debt markets following the conventional literature. The first one is the bond yield spread, which is a useful predictor of recession;5 the second is the sovereign debt spread, showing international liquidity.
Bond yield spread
The spread between the long-term bond yield and the short-term bond yield is used as a possible predictor for the economic recession and as a proxy for the uncertainty in the government bond markets.
Bond yield spreadt =C 10 TBt – C 1TBt (5)
where C10TB represents the 10-year government bond yields, and C1TB denotes 1-year government bond yield. We do not use 3-month Treasury bill yields because the period of data (yields rates) available for the 3-month bond in China’s _________________________
5 See, for example, Oet et al. (2011), Estrella and Mishikin (1995), Haubrich and Biano (2011). -6
-4 -2 0 2 4
short-term bond market is very short. The 1-year government bond is used as it is most popular and has a very long issuance history in China.
Sovereign debt spread
This term is defined by China’s year government bond yields minus the US 10-year government bond yields:
Sovereign debt spreadt = C 10 TBt – US 10 TBt (6)
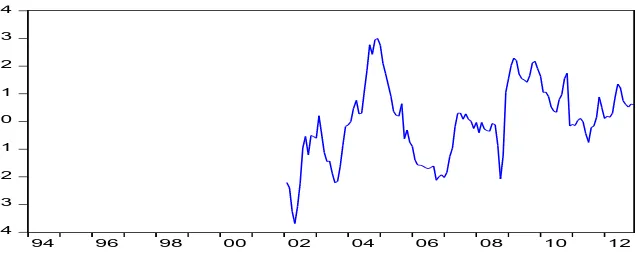
Combining the bond yield spread and the sovereign debt spread, we obtain an FSI for China’s debt markets (DMFSI) by equal-variance weighting in Figure 11. In this figure, we find that the financial stress increased in China’s debt market after 2009 due to the contagion effects of the international financial crisis.
Figure 11: FSI for China’s Debt Markets (DMFSI)
-4 -3 -2 -1 0 1 2 3 4
4.1.5 Overall FSI for China’s Financial System (CNFSI)
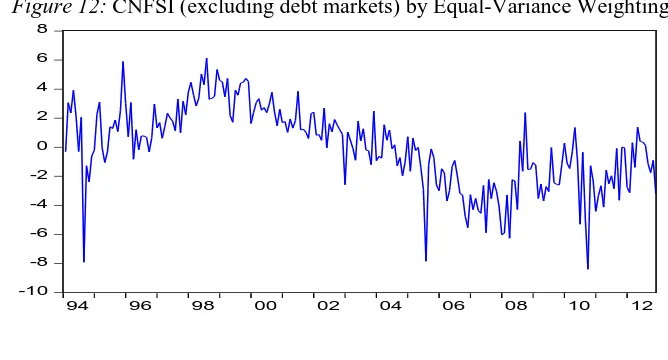
We employ equal-variance weighting to construct an overall FSI (CNFSI) for China’s financial system.6 Given that the sample period for the debt market is too short (from 2002 onwards), and the trade volume in debt market is very tiny in China, we construct the CNFSI excluding DMFSI by equal-variance weighting from 1994 to 2012; Figure 12 plots the CNFSI.
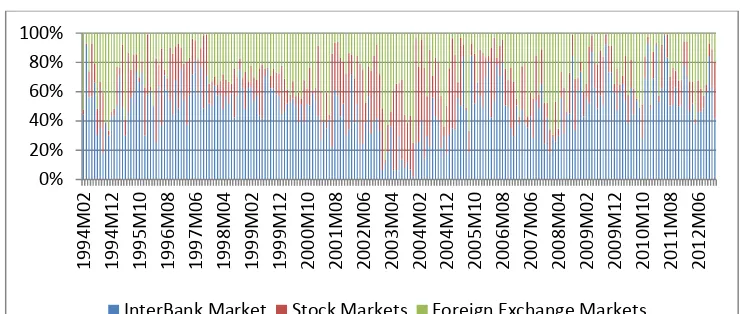
The contributions of the sub-indices for different financial markets to the overall FSI (CNFSI) are shown in Figure 13, in which the disaggregated sources of China’s financial stress (measured by the CNFSI) have been traced and measured. Figure 13 reflects that China’s financial stress mainly arises from the interbank markets (the average contribution of BankFSI to the CNFSI is approximately 49.5%), which reflects the fact that the banking sector dominates China’s financial system. The stresses from the foreign exchange markets (EMFSI) and the stock markets (SMFSI) contribute approximately 28.2% and 22.3%, respectively, to the overall instability of China’s financial system.
Figure 12: CNFSI (excluding debt markets) by Equal-Variance Weighting
_________________________
6 An alternative method for constructing CNFSI is using credit weighting. However, as the banking sector dominates the trade volume in China’s financial system, the CNFSI by credit weighting follows the pattern and trend of the BankFSI in Figure 8.
-10 -8 -6 -4 -2 0 2 4 6 8
Figure 13: Disaggregated Sources of the Overall FSI (CNFSI)
4.1.6 Identification of Episodes of Financial Stress by CNFSI
Considering the reality that no financial crisis has happened since 1994 in China, following Lai and Lv (2010) and other studies in the literature, we identify the episodes of systemic financial stress by measuring the deviations of the CNFSI from its long-run trend. When the CNFSI is two times of standard deviation more than the long-term average level, it suggests a financial systemic stress.
Hence, the identification standard of a system financial stress is defined as
where
CNFSIE
denotes the identification standard,t
the average value and standard deviation of CNFSI time series. When CNFSIE is greater than 1, the systemic financial stress should be signalled. The identified episodes of systemic financial stress are presented in Figure 14.
To provide useful and convenient tools for the supervisors and the public, we develop a non-parametric alarming grade system in terms of the degree of deviations of each systemic stress following the following rules of thumb:
Blue systemic financial stress alarming signal:
1
≤
CNFSIE
<
1.5
Orangesystemic financial stress alarming signal:
1.5
≤
CNFSIE
<
2.5
0%
Red systemic financial stress alarming signal:
2.5 CNFSIE
≤
Table 1 presents the episodes of systemic financial stress identified by this standard from January 1994 to December 2012. Table 1 shows that China’s financial systemic stress sources from both domestic and global shocks during past decades.
Figure 14: Identified Episodes of Financial Stress by CNFSI
Table 1: Identification of Episodes of Financial Stress by CNFSI
Episodes CNFSI Grades of alarming Signal
Possible Sources of Financial Vulnerabilities
Sept. 1994 –7.915592 Blue Higher non-performing loans ratios and lower deposits-to-loans ratios of the banking industry in China, Overheated economy (CPI inflation reached approximately 27%, and remained above 20% during the entire year). Dec. 1995 5.893915 Blue Higher non-performing loans ratios and lower
deposits-to-loans ratios of the banking industry in China. In 1995, an overheated economy led to a very strict contractionary monetary policy in tackling the higher inflation.
Aug. 1998 6.139003 Blue Banking crisis identified by Laeven and Valencia (2008). Spill over of Asia Financial Crisis (July 1997).
Table 1 continued
-10 -8 -6 -4 -2 0 2 4 6 8
Table 1 continued
Dec. 2006 –5.540553 Blue ?
July 2007 –5.880105 Blue Spill over of Global Financial Crisis from the US
Jan 2008 Feb 2008, April 2008
–6.034455 –5.908281 –6.260356
Blue Spill over of Global Financial Crisis from the US
Oct. 2010 –8.398406 Orange Spill over of Global Financial Crisis and the European Sovereign Debt Crisis
4.2
A National Financial Conditions Index for China (CNFCI)
4.2.1 Constructing the CNFCI
In constructing the CNFCI, we use most variables that were used in constructing the CFSI, and add some new variables reflecting the monetary and credit supplies, asset prices etc. Note that in constructing the FCI, we replace the loans-to-deposits ratio by deposits-to-loans ratio, which provide positive contributions to financial conditions. The set of chosen variables includes the following: the deposits-to-loans ratio of the banking industry, non-performing-deposits-to-loans ratios of the banking industry, risk spread of banks, 3-month interbank borrowing rates, the growth rates of M2 for the money supply, CPI inflation for the change in the price level, the national housing price index for asset price and the real estate prosperity index for the demand for investment, the stock market index for equity market, the exchange rate and the change in foreign reserves for foreign exchange markets.
Following Swiston (2008), Osorio et al. (2011), we estimate the CNFCI using the weighted average approach, in which the weights are extracted from a VAR model:
( ) ( )
t t t t
By =C L y +D L x +ε (8)
where
y
t is a (m x 1) vector of endogenous variables,x
t is an n vector of exogenous variables, B, C and D are matrices of the estimated coefficients, L is a lag operator, and i is the number of lag or the order of the VAR. The error term is a vector of innovations, which are I.I.D.risk spread of banks, 3-month interbank borrowing rates, growth rates of M2, national housing price index, real estate prosperity index, stock market index, exchange rate and the change in foreign reserves. The CNFCI is thus estimated by
,
,
1
( )
i t
n
i t i
t i
i Z
z z
FCI w
µ
=−
=
∑
(9)where the weight
w
i is calculated by the cumulative responses of the growth of industrial production to one-unit shock from the financial indicatorz
i, whereasz
iand
,
i t
Z
µ
denote the average value and standard deviation ofz
i over the wholesample period, respectively.
We use the cumulative responses of growth of industrial production to a one-unit shock in financial variables within 12 periods (months) to calculate the weights for each financial indicator. The VAR models satisfy the requirements of mathematical stability, no heterogeneity, no AR and normal distributions in residuals.
Figure 15 presents the CNFCI without the debt market since 1997 constructed by a weights-sum approach. In Figure 15, we find that the financial conditions had a deep deterioration in 1998, which could have been caused by spill-overs of the Asian Financial Crisis and then improved gradually, but declined dramatically after 2008, which could be explained by the Global Financial Crisis, eventually recovering after 2009, but with fluctuations.
Figure 15: CNFCI without the debt market constructed by weight-sum approach
-30 -20 -10 0 10 20
4.2.2 Episodes of Financial Vulnerability by CNFCI
We identify the episodes of systemic financial distress by establishing a cut-off in terms of percentiles of the CNFCI. For example, if the CNFCI declines 50% within 12 months,7 we should be cautious of an episode of financial distress. This standard suggests the following deterioration periods of financial conditions in China since 1997: Oct. 1997 – Feb 1999 (Asia Financial Crisis), August 2005-Dec. 2005, April 2008-Feb 2009 (Global Financial Crisis), and May 2011-July 2012 (Global Financial Crisis and the European Sovereign Debt Crisis). In total, four episodes of financial instability have been marked by the CNFCI since 1997, two of them being coincidental with the episodes of financial stress identified in Table 1 by using the CNFSI.
4.3
Evaluation on Two Indices
4.3.1 Evaluation by Predictive Analysis
We examine and compare the two indices by testing their ability to predict the output gap following the conventional literature.8 As our data are monthly, we use the growth rates of industrial production to proxy the growth rates of GDP.
In-Sample Predictions:
First, we conduct formal predictive tests by using an in-sample estimation equation:
1 1
T N
t h i t i i t j t
i j
IPgrowthgap+ C
β
IPgrowthgap−g
index−ε
==
=
+
∑
+∑
+ (10)where IPgrowthgap denotes the gap of the growth rates of industrial production, proxy for the gap of output growth. Index denotes the CNFSI or the CNFCI, respectively.
C
is the constant, andε
t is the error term. IPgrowthgap iscalculated by H-P filter. To simplify, we use the OLS to investigate the indices’ ability to predict the output growth gap. The results are reported in Table 2.
_________________________
7 We set the cut-off point in terms of the episodes of real financial stress in China, following the works of Swiston (2008), Hatzius et al. (2010), and Wacker et al. (2014).
Pseudo-Out-Of-Sample Predictions:
Following Hatzious et al. (2010) and Osiorio et al. (2011), we conduct a “pseudo-out-of-sample” prediction tests by estimating the same equation (10) recursively and calculating the root mean squared error (RMSE). The results are also shown in Table 2. The lag choice refers to the AIC information standard described by Hatzious et al. (2010). The in-sample and post-sample prediction tests in Table 2 show that both the CNFSI and the CNFCI are effective in predicting the fluctuations of GDP, and the CNFCI performs a little better than the CNFSI in terms of the significance level.
Table 2: Predictive Tests of Indices on Output Gap-In Sample (Dependent Variable: industrial production growth gap)
Variables CNFSI (S.D) CNFCI (S.D)
Constant 0.030232 (0.182854) -0.086813 (0.189762)
IPgrowthgap(-1) 0.209906 *(0.067161) 0.140289**(0.074434)
IPgrowthgap(-2) 0.168424*(0.068575) 0.180691*(0.068375)
IPgrowthgap(-3) 0.083180 (0.063669) 0.127333**(0.068817)
Index(-1) -0.258720*(0.106432) 0.880044*(0.164421)
Index(-2) -0.043165 (0.110709) -0.845124 *(0.265282)
Index(-3) 0.238863* (0.105852) -0.028931(0.177783)
Adjusted R2 0.1285 0.229417
F-statistic 6.480693 10.08043
RMSE 2.8693 2.5938
* and ** denotes 5% and 10% significance, respectively.
4.3.2 Evaluation by Total Errors and Noise/Signal Analysis
measure the ratio of failing to signal a “true” high-stress event, calculated by the amount of no-signal-issuing for “true” stress divided by the total number of “true” stress. Type II errors are ratios that incorrectly signal, calculated by the number of wrong signals divided by the number of total signals. The “true” high-stress events are judged and justified by the reality of China’s financial situations from 1997 to 2012 and the literature.9 The four episodes of financial systemic stress in reality include the banking crisis in 1998 identified by Laeven and Valencia (2008), thecollapse of China’s stock market in 2007 (the Shanghai stock index fell from approximately 6000 to approximately 2000), the financial stress in 2008–2009 identified by Wacker et al. (2014) and Lai and Lv (2010), and the financial stress in 2010 suggested by Lai and Lv (2010) and Wacker et al. (2014). Following Comelli (2013), we assume that the policymakers are more cautious, they dislike more missing a stress episode than issuing a false signal. This implies that the policymakers think that missing the alarm of a stress episode can potentially be much costlier than issuing a false signal in terms of foregone output. Therefore, we calculate the total errors according to the following equation:
Total Errors= (2/3)*Type I Errors+ (1/3)*Type II Errors (11)
The performance of the index can be assessed by comparing the total errors and noise/signal ratio. The better index should be the one that can minimize the total errors and the noise/signal ratio. Table 3 summarizes the predicting accuracies of financial stress by the CNFSI and CNFCI, respectively. The results suggest that CNFSI is a more suitable index for identifying and predicting the systemic stress of China’s financial system than is the CNFCI.
Table 3: Episodes of Financial Systemic Stress Identified by the CNFSI and CNFCI
Index No. of Episodes identified since 1997
No. of Financial Stress in Reality
Noise/True Signal Ratio (%)
Type I Error (%.)
Type II Error (%.)
Total Errors (%)
CNFSI 5 4 25 0 20 6.7
CNFCI 4 4 25 25 25 25
_________________________
5
Leading Indicators and an EWS for China’s
Macroprudential Regulations
With the identified episodes of financial systemic stress (distress) in Section 4.1 by the CNFSI, we investigate whether some variables can be selected to be the leading indicators for China’s financial instability. We choose eight variables including the growth rates of total loans and total deposits and most variables in the dataset for constructing the two indices. These indicators are commonly employed in the macroprudential literature to predict financial instability (Borio and Lowe, 2002 and 2004). They capture the building up of financial vulnerability and imbalance in macroeconomic conditions. Table 4 summarizes the indicators.
Methodologically, following the “signals approach” by Kaminsky and Reinhart (1996) and Kaminsky et al. (1996),10 we set the early warning window within 12 months prior to the start of episodes of financial distress identified in Section 4.1. Following Borio and Lowe (2002 a, 2002b) and Borio and Drehmann (2009), first, we detrend the variables with an H-P filter, and then we compare the deviations of the values of the variables from their long-term trend (or average level) with the “optimal thresholds” (percentage deviation from the trend within 12 months) to find the possible leading indicators for monitoring China’s financial instability. The optimal thresholds are determined using an iterative search procedure following Reinhart et al. (2000) to minimize the total errors. The performances of the indicators are examined according to the Type I, Type II, total Errors and noise/signal ratio, which are defined in Section 4.3.
Figure 16 depicts the volatilities of these indicators, their thresholds for issuing alarming signals (precautious lines) and the identified episodes of financial stress with the early warning window (12 months prior to the start of the systemic financial stress). Table 4 reports the performance of these early warning indicators. On the basis of total errors and noise/signal ratio, it is shown that the volatilities of banking deposits-to-loans ratios, growth rates of M2, 3-month inter-bank borrowing rates, CPI inflation, housing price index, real estate prosperity index, growth rates of total deposits and total loans are fitting to be the leading indicators (early warning indicators) of China’s financial vulnerabilities.
_________________________
Table 4: Assessments of the Leading Indicators
Indicators Thresholds of warning
Growth rates of total deposits
6% 5 6 4 50 20 33.3 24.43
Growth rates of total loans
Growth rates of M2
4% 3 (after
1997)
3 2 50 33.3 33.3 33.3
Figure 16: the Leading Indicators
Figure 16 continued
-.03 Volatility of 3 Months Inter-Bank Borrowing Rates
-.08
Volatility of Deposits-to-Loans Ratios of Banking System
precautious line
-.06
Volatility of CPI Inflation
-.10
Volatility of Housing Price Index
-.08
Volatility of Growth Rates of M2
-.12
Volatility of Real Estate Prosperity Index
-.15
Volatility of Growth Rates of Total Deposits
-.12
The results suggest that the deposits-to-loans ratio, the growth rates of deposits and loans (Credit Indicator), housing price index or real estate prosperity index (Property Price or Investment Indicator), CPI inflation (Price Indicator) and the growth rates of M2 (Monetary Indicator) are relatively reliable leading indicators in issuing early warnings for China’s financial instability. Most importantly, the price indicator (CPI inflation) and the credit indicators (deposits-to-loans ratio, growth rates of total deposits and loans) perform best in helping predict the identified episodes of financial stress among all the indicators chosen in this study.
Thus, we propose a macro-prudential early warning system, comprising the CNFSI and four leading indicators (Price, Credit, Asset or Investment, and Money) with their thresholds, to monitor the instability of China’s financial system. In this early warning system, following Borio and Lowe (2002a), when the deviations of any two of the four indicators from their long run trends exceed their respective thresholds (4% for deposits-to-loans ratio, 6% for growth rates of aggregate loans, 4% for CPI inflation, 5% for housing price index or 4% for real estate property index, and 4% for growth rates of M2), the policymakers and regulators should pay attention to a possible financial stress within 12 months, and if the CNFCI also meet the identification standard of a systemic risk, the relevant alarm signal should be issued and the macro-prudential policy would be implemented to avoid possible financial distress.
A Predicting Exercise by the Early Warning System
It is well known that China’s financial system experienced a disruption at the end of 2015 because of the dramatic fall of stock market indices and a remarkable depreciation of China’s currency (RMB). Can our early warning system identify these financial stress episodes and provide precautionary signals? We enhance our data sample to the end of 2015, to conduct an out-sample predicting exercise.
Figure 17 plots the CNFSI from January 1994 to December 2015. It is obvious that our CNFSI has identified the episode of financial stress from July 2015 to August 2015 caused by the stock market volatility, and the episode of financial stress from November 2015 onwards caused by the foreign exchange market volatility.
Within an early warning window of 12 months, the indicator of deposits-to-loans ratio would succeed in issuing early warning signals in December 2014 for two identified episodes of financial stress (orange and blue shaded area), as shown in Figure 18.
Figure 17: CNFSI (excluding Debt Market) from 1994 to 2015
-8 -4 0 4 8 12
94 96 98 00 02 04 06 08 10 12 14
Figure 18: Episodes of Financial Stress Identified by CNFSI for 2015 and the Early Warning Signal Issued by Deposits-to-Loans Ratio
-.08 -.06 -.04 -.02 .00 .02 .04 .06
94 96 98 00 02 04 06 08 10 12 14
p
Early W arning Signal(2014M12)
Orange Systemic Financial Stress(August 2015) Early W arning W indow(Yellow Area)
6
Concluding Remarks
In this paper, we construct a financial stress index (CNFSI) and a financial conditions index (CNFCI) to measure and assess the instability of China’s financial system. The CNFSI is aggregated by several subindices for interbank markets, stock markets, foreign exchange markets and debt markets with equal weighting. The evolution of the CNFSI specifies the change in financial stress, and identifies the episodes of financial vulnerability in China from 1994 to 2012. The CNFCI contains the financial information extracted from eleven variables covering the main components of the financial system and important macroeconomic activities, reflecting China’s current financial state including the situation of stress.
The evaluation of these two indices is conducted by predictive tests and total errors analysis. The empirical results from both comparisons suggest that the CNFSI and the CNFCI constructed in our paper are both useful for measuring the stability of China’s financial system. The total error analysis supports that the CNFSI is more fit for monitoring the financial instability in China than the CNFCI.
Using the identified episodes of financial stress, we find four leading indicators for China’s financial instability: deposits-to-loans ratio, or growth rates of total loans and deposits (credit indicator), CPI inflation (Price indicator), housing price index or real estate prosperity index (asset or investment indicator), growth rates of M2 (monetary indicator). Combining these leading indicators with the CNFSI, and their thresholds, we form an early warning system for China’s macroprudential regulations. Finally, we enhance our sample to include the period 2013–2015 and conduct a predicting test using the early warning system. The CNFSI has identified the episodes of financial stress with regard to 2015, and the deposit-to-loan ratio succeeds in issuing the early warning signal of the financial stresses in 2015, within an early warning window of 12 months. This proves the predictive power of the CNFSI and the early warning indicators that we suggest.
References
Angelopoulou, E., Balfoussia, H., and H. Gibson (2013). Building a financial conditions index for the euro area and selected euro area countries – What does it tell us about the crisis. ECB Working Paper Series No. 1541, May.
https://www.ecb.europa.eu/pub/pdf/scpwps/ecbwp1541.pdf?9f20d9e7140c6c9919c81 ae7d9ba2152
Balakrishnan, R., Danninger, S., Elekdag, S., and I. Tytell (2009). The transmission of financial stress from advanced to emerging economies. IMF Working Paper WP/09/133, June. https://www.imf.org/external/pubs/ft/wp/2009/wp09133.pdf Bollerslev, T., and R.Y. Chou (1992). ARCH modelling in finance: A review of the theory
and empirical evidence. Journal of Econometrics 52: 5–59.
http://public.econ.duke.edu/~boller/Published_Papers/joe_92a.pdf
Borio, C., and P. Lowe (2002a). Asset prices, financial and monetary stability: Exploring the nexus. BIS Working Papers, no 114, July. http://www.bis.org/publ/work114.htm Borio, C., and P. Lowe (2002b). Assessing the risk of banking crises. BIS Quarterly
Review, December: 43–54. http://www.bis.org/publ/qtrpdf/r_qt0212e.pdf
Borio. C., and M. Drehmann (2009). Assessing the risk of banking crises-revisited. BIS Quarterly Review, March: 29–46. http://www.bis.org/publ/qtrpdf/r_qt0903e.htm Brave, S., and R. Butters (2010). Gathering insights on the forest from the trees: A new
metric for financial conditions. Federal Reserve Bank of Chicago, Working Paper, (WP-2010-07). https://www.chicagofed.org/publications/working-papers/2010/wp-07
Cardarelli, R., Elekdag, S., and S. Lall (2009). Financial stress, downturns, and recoveries. IMF Working Paper WP/09/100, May.
https://www.imf.org/external/pubs/ft/wp/2009/wp09100.pdf
Comelli, F. (2013). Comparing parametric and non-parametric early warning systems for currency crises in emerging market economies. IMF Working Paper Series WP/13/134, May. https://www.imf.org/external/pubs/ft/wp/2013/wp13134.pdf
D'Antonio, P. (2008). Appenix. EMA Special Report, Citigroup Global Markets Inc., pp26-28.
De Bankt, O., and P. Hartmann (2000). Systemic risk: A survey. ECB Working Paper No. 35. https:// www.ecb.europa.eu/pub/pdf/scpwps/ecbwp035.pdf
Dudley, W., and J. Hatzius (2000). The Goldman Sachs Financial Conditions Index: The right tool for a new monetary policy regime. Global Economics Paper No. 44.
Dudley, W., Hatzius, J., and E. McKelvey (2005). Financial conditions need to tighten further. US Economics Analyst, Goldman Sachs Economic Research.
Estrella, A., and F.S. Mishkin (1995). Predicting U.S. recessions: Financial variables as leading indicators. NBER Working Paper 5379.
http://www.nber.org/papers/w5379.pdf
European Central Bank (2010). Financial stability review. June 2010.
https://www.ecb.europa.eu/press/pr/date/2010/html/pr100531.en.html
Forss, Sandahl, J., Holmfeldt, M., Ryden, A., and M. Stromqvist (2011). An index of financial stress for Sweden. Sveriges Riksbank Economic Review, 2: 49–67.
http://www.riksbank.se/Upload/Rapporter/2011/POV_2/er_2011_2_forsssandahl_hol mfeldt_ryden_stromqvist.pdf
Frankel, J.A., and G. Saravelos (2011). Can leading indicators assess country vulner-ability? Evidence from the 2008–09 global financial crisis. HKS Faculty Research Working Paper Series RWP11-024.
https://ideas.repec.org/p/hrv/hksfac/5027952.html
Freedman, C. (1994). The use of indicators and of the monetary conditions index in Canada. In Balino, T.J.T., and Cottarelli, C. (Eds.), Frameworks for Monetary Sta-bility: Policy Issues and Country Experiences. IMF, Washington, D.C.
Goodhart, C., Love, R., Payne, R., and D. Rime (2002). Analysis of spreads in the dollar/euro and deutschemark/dollar foreign exchange markets. Economic Policy 17: 536–554. https://ideas.repec.org/a/bla/ecpoli/v17y2002i35p535-552.html
Guichard, S. Haugh, D., and D.Turner (2009). Quantifying the effect of financial con-ditions in the euro area, Japan, United Kingdom and United States. OECD Economics Department Working Papers No. 677.
http://www.oecd-ilibrary.org/economics/quantifying-the-effect-of-financial-
conditions-in-the-euro-area-japan-united-kingdom-and-united-states_226365806132?crawler=true
Hakkio, C.S., and W.R. Keeton (2009). Financial stress: What is it, how can it be measured, and why does it matter? Economic Review (Federal Reserve Bank of Kansas City) QII: 5–50.
https://www.kansascityfed.org/PUBLICAT/ECONREV/pdf/09q2hakkio_keeton.pdf
Haubrich, J., and T. Bianco (2011). The yield curve as a predictor of economic growth. Federal Reserve Bank of Cleveland.
https://www.clevelandfed.org/en/our-research/indicators-and-data/yield-curve-and-gdp-growth/yield-curve-archives/yc-20110301.aspx.
Hollo, D., Kremer, M., and M. Lo Duca (2012). CISS-A composite indicator of system stress in the financial system. ECB Working Paper Series No. 1426, March.
https://www.ecb.europa.eu/pub/pdf/scpwps/ecbwp1426.pdf?6d36165d0aa9ae6010709 27f3ab799fc
Hooper, P., Mayer, T., and T. Slok (2007). Financial conditions: Central banks still ahead of markets. Deutsche Bank, Global Economic Perspectives June.
Hooper, P., Slok, T., and C. Dobridge (2010). Improving financial conditions bode well for growth. Deutsche Bank, Global Economic Perspectives, January.
Illing, M., and Y. Liu (2003). An index of financial stress for Canada. Bank of Canada Working Paper 2003-14. http://www.bankofcanada.ca/2003/06/working-paper-2003-14/
Illing, M., and Y. Liu (2006). Measuring financial stress in a developed country: An application to Canada. Journal of Financial Stability 2(3): 243–265.
http://www.sciencedirect.com/science/article/pii/S1572308906000301
Kaminsky, G.L, Lizondo, S., and C.M. Reinhart (1998). Leading indicators of currency crises. IMF Staff Papers, Vol. 45, No. 1, March.
http://home.gwu.edu/~graciela/HOME-PAGE/RESEARCH-WORK/WORKING-PAPERS/leading-indicators.pdf
Kaminsky, G.L., and C.M. Reinhart (1999). The twin crises: The causes of banking and balance-of-payments problems. American Economic Review 89(3): 473–500.
http://home.gwu.edu/~graciela/HOME-PAGE/RESEARCH-WORK/WORKING-PAPERS/twin-crises.pdf
Laeven, L., and F. Valencia (2008). Systemic banking crises: A new database. IMF Working Paper WP/08/224, November.
https://www.imf.org/external/pubs/ft/wp/2008/wp08224.pdf
Lai, J., and J. Lv (2010). Measuring systemic risks based on an FSI. Statistics and Decision 19, pp. 128–131.
Matheson, T. (2011). Financial conditions indices for the United States and euro area. IMF Working Paper WP/11/93, April.
Mayes, D.G., and Viren, M. (2001). Financial conditions indexes. Bank of Finland Working Paper No. 17/2001
http://www.suomenpankki.fi/en/julkaisut/tutkimukset/keskustelualoitteet/Pages/dp200 1_17.aspx
Oet, M.V. Eiben, R., Bianco, T., Gramlich, D., and S. Ong (2011). Financial stress index: Identification of systemic risk conditions. FED of Cleveland Working Paper 11–30, November. https://www.clevelandfed.org/.../eee1b5d0dd0545c0baa888216a
Osorio, C., Ponsaparn, R., and D. Filiz Unsal (2011). A quantatitive assessment of financial conditions in Asia. IMF Working Paper WP/11/170.
https://www.imf.org/external/pubs/cat/longres.aspx?sk=25053.0
Reinhart, C., Goldstein, M., and G. Kaminsky (2000). Assessing financial vulnerability, an early warning system for emerging markets: Introduction. MPRA Paper No. 13629.
https://ideas.repec.org/p/pra/mprapa/13629.htm l
Rosenberg, M.R. (2009). Global Financial Market Trends and Policy. Bloomberg Financial Conditions Watch, 2(6).
https://www.ssc.wisc.edu/~mchinn/fcw_sep112009.pdf
Semmler, Willi and Pu Chen (2014). Financial Stress, Regime Switching and Macro-dynamics: Theory and Empirics for the US, the EU and Non-EU Countries. Economics: The Open-Access, Open-Assessment E-Journal, 8 (2014-20): 1–42.
http://dx.doi.org/10.5018/economics-ejournal.ja.2014-20
Shi, H. (2004). The endogeneity of non-performing loans ratio of China’s state banks. Journal of Financial Research 6: 1–16.
Shi, H. and X. Peng (2003). The Soft Constraints of Commercial Banks and the Reforms of China’s Banking Industry. Journal of Financial Research 10: 1–16
Swiston, A. (2008). A U.S. financial conditions index: Putting credit where credit is due. IMF Working Paper WP/08/161.
https://www.imf.org/external/pubs/ft/wp/2008/wp08161.pdf
Wacker, K.M., Lodge, D., and G. Nicoletti (2014). Measuring financial conditions in major non-euro area economies. ECB Working Paper Series No. 1743.
Appendix
Table A: Selected Variables for China’s FSI and FCI, and Data Sources
Markets Variables Descriptive Statistics Mean (Standard Dev.)
Data Sources Frequency and Periods
Banking Sector
Risk Spread 0.6815 (1.1089) Wind* Monthly
(June1997–Dec 2012)
Non-Performing Loan Ratio
0.17035 (0.11767) CBRC, Wind, Shi (2004),
Annually (1994–2012)
Total Loans to Total Deposits Ratio
0.7835 (0.1152) Wind Monthly
(Jan 1994–Dec 2012)
Stock Market
Stock mark index 1827.11 (979.02) CEIN** Monthly
(Jan 1994–Dec 2012)
Foreign Exchange Market
Exchange rate 7.8217 (0.7304) CEIN Monthly
(Jan 1994–Dec 2012)
Foreign exchange reserves
947223.9 (1077239) CEIN Monthly
(Jan 1994–Dec 2012)
Debt Market
Bond yield spreads 1.269 (0.5089) Wind Monthly
(Feb 2002–Dec 2012)
Sovereign debt spreads
–0.142595 (1.1198) Wind Monthly
(Feb 2002–Dec 2012)
Macro-economic Variables
CPI inflation 4.223 (6.472) CEIN Monthly
(Jan 1994–Dec 2012)
Growth rates of M2 17.622 (4.33) CEIN Monthly
(Jan 1996–Dec 2012)
Growth rates of total deposits
0.2107 (0.088) CEIN Monthly
(Jan 1994–Dec 2012)
Growth rates of total loans
0.1812 (0.078) CEIN Monthly
(Jan 1994–Dec 2012)
Housing price index
105.098 (5.93) CEIN Monthly
(Jan 1994–Dec 2011)
Real estate prosperity index
101.49 (4.141) CEIN Monthly
(Jan 1994–Dec 2012)
Table B: Summary Description of FSIs
Authors Banking System Equity (Stock) Market Foreign Exchange
Market
Credit (or Debt) Markets
Volatility of stock market CMAX:
Excluding Equal variance
weights: episode of financial stress: relative volatility of equity return:
( , ) / ( )
COV r m VAR m
β
=r and m are the annual total returns, to the banking sector index and the overall market index Risk spreads between risky and risk-free bond yields
Credit weights: relative size of
markets 0
1. Financial Beta
( , ) / (
COV r m VAR m
β
=2. Bank bond spread 3. Interbank liquidity
spread
4. Interbank cost of borrowing
Stock market crash:
/ max[
,
$US exchange indexCredit Market 1 Governed interest spread
2Corporate bond spread
3 Liquidity spread 4 90 day commercial paper treasury bill spread
5 Treasury yield curve spread No of daily obersv
Cardarelli et al. (2009)
1 Banking sector Beta: 2 TED spread 3 Inverted term spread
1 Corporate spread 2 Stock declines
3 Time-varying stock volatility GARCH(1,1), volatility of overall market index monthly return
Time varying real effective exchange rate volatility
GARCH(1,1)
Weight: the real costs of capital:
Episodes of financial stress are identified when the index is one
Banking system Beta: 2
1 Stock market returns= year-on-year change in the stock index multiplied by negative one.
2 Stock market volatility: GARCH(1,1), 12 lags; monthly
EMPI: spread=the bond yield minus the 10-year US treasury yield
2 Idiosyncratic volatility of bank stock prices
3 Cross-section
dispersion(CSD) of bank stock returns
Implied volatility of overall stock prices year Treasury spread;
Factor analysis Kansas City FSI (KCFSI)
Hollo et al. (2012)–CISS
Banking sector
1. Realised volatility of the idiosyncratic equity return of the Data stream bank sector stock market index over the total market index;
2. Yield spread between A-rated financial and non-financial corporations 3. CMAX as defined above
interacted with the inverse price-book Money Market:
1. Realised volatility of the 3-month Euribor rate, 2. Interest rate spread
between 3-month Euribor and 3-month French T-bills. 3. Monetary Financial
Institution’s (MFI) emergency lending at Eurosystem central banks
1. Realised volatility of the DataStream non-financial sector stock market index: 2. CMAX for the DataStream
non-financial sector stock market index.
3. Stock-bond correlation
Realised volatility of the euro exchange rate vis-à-vis the US dollar, the Japanese Yen and the British
Pound, respectively
1. Realised volatility of the German 10-year benchmark government bond index
2. Yield spread between A-rated non-financial corporations and government bonds
3. 10-year interest rate swap spread
Equal weights for subindex; standard portfolio theory (from VAR) for aggregating subindex into FSI
(
) (
t t t t
CISS
=
w s C w s
Table C: Summary Description of FCIs
Full Name (Short Name) Authors Frequency &
sample period
Methodology Financial system or variables Data Sources
Bloomberg U.S. Financial Conditions Index (BFCI)
Rosenberg (2009) Daily, 1994–2009
Weighted average Money market, bond market, equity market
Bloomberg
Morgan Stanley Financial Conditions Index U.S. (MS FCI)
Daily 1995–N/A
Weighted average Money Market, stock market, foreign exchange market
Bloomberg
National Financial Conditions Index (NFCI)
Brave and Butters (2010)
Weekly 1973–2006
First principal component
More than 30 variables including various spreads and yields etc.
Chicago FED
Citi Financial Conditions Index (Citi FCI)
D'Antonio (2008) Monthly 1983–2000
Weighted average corporate spreads, money supply, equity values, mortgage rates, the trade-weighted dollar, and energy prices
Citi Research
I.M.F. U.S. Financial Conditions Index (IMF FCI)
Matheson (2011) Monthly 1994–2009
Dynamic Factor Analysis
Approximately 30 variables Author
Deutsch Bank Financial Conditions Index
the exchange rate, and bond, stock, and housing market indicators
Golden Sachs Financial Conditions Index (GS FCI)
Dudley and Hatzius (2000); Dudley et al. (2010)
Quarterly 1980–2009
Weighted average CDX, Moody’s A-rated corporate bond index
Golden Sachs, FED
OECD Financial Conditions Index
Guichard et al. (2009) Quarterly 1999–2008
Weighted average credit conditions, corporate bond spreads, Real short rates, real long rates, real exchange rate,
households wealth
US Federal Reserve, Eurostat, Bank of Japan, UK Office of National Statistics, OECD.
NBER Financial Conditions Index
Hatzius et al. (2010) Quarterly 1970–2010
Principal components analysis
45 variables FED, Bloomberg
Please note:
You are most sincerely encouraged to participate in the open assessment of this article. You can do so by either recommending the article or by posting your comments.
Please go to:
http://dx.doi.org/10.5018/economics-ejournal.ja.2016-19
The Editor