Strategic Planning:
What Works ... and What Doesn’t
A
t the American Productivity & Quality Center’s Third Knowledge Symposium, held in October 1998, three presenters shared their thoughts and experiences on the topic of strategic planning. Rick Sessions of National Semiconductordiscussed how his organization has incorporated external benchmark information into its strategic planning process. He provided guidelines for how other organizations can do this as well. Patrick Schaefer of Ernst & Youngbrought to the table his experiences as a consultant, discussing important linkages among strategic planning, performance measurement, and knowledge management. Finally, J.J. Gutierrez of Austin Energytook her audience on a journey through her company’s experiences with planning—narrowing the planning process from a silo-based structure to one that served the company as a whole. She shared the steps Austin Energy used, as well as the lessons the company learned.This white paper, based on those three presentations, gives a broad perspective of the strategic planning function and offers viable ideas for those holding strategic planning responsibilities.
MEMBERSHIP INFORMATION
For information about how to become a member of APQC’s International Benchmarking Clearinghouse, a service of APQC, and receive publications and other benefits, call toll-free (800) 776-9676 or (713) 681-4020 or visit our Web site at <www.apqc.org>.
COPYRIGHT
INTEGRATING EXTERNAL
BENCHMARKING INTO YOUR
S TRATEGIC PLANNING
PROCES S
N
ational Semiconductor used to have a central planning activity around strategic planning with three staff members and a six-member matrix team. These days, said Richard Sessions, director, Corporate Technology Strategy Planning, he serves as the whole staff in a coach-and-facilitator role. The organization moved away from central planning and requires groups (such as HR, manufacturing, and various product lines) to do the strategic planning for the corporation.“The doers are the planners and the planners are the doers,” he said. The objective is to get planning done where the action is.
Sessions described several “must haves” for organizations that decide to function in this way:
• a clear, well-understood vision and direction from the CEO; • a CFO who is a champion of the process;
• a culture that supports trust, truth, and accountability; • good benchmarking skills;
• good strategic skills;
• well-informed cross-functional, cross-group networks; • a good external view of success (listen and benchmark); and • exceptional communication.
Businesses are going to be managed differently in the next
millennium, according to Sessions. He believes organizations will man-age using a highly integrated, holistic business operating system that is fast, flexible, and accountable. These companies will be hard on issues and soft on people. Sessions stated organizations that use Baldrige as their balanced scorecard will be light years ahead of anyone else. He remarked that one of the key elements missing from Baldrige’s competi-tor, the Norton Kaplan balanced scorecard, is leadership.
“It’s leadership that makes the difference in the company,” Sessions said. “A tremendous difference.”
MODELING FOR SUCCESS
Success model planning is the one unique step, according to Sessions, that National Semiconductor completes as part of its strategic planning process. With more traditional approaches, most organizations go straight to strategic plans, operating plans, and the numbers. National Semiconductor treats success model planning as a front-end exercise for strategic planning.
“You really have to know what success looks like if you are going to do a good strategic plan,” Sessions said. “Success modeling is the ideal per-formance of a business benchmarked against best in class. This is where the truth and honesty comes in.”
National Semiconductor looks at critical success factors of the busi-ness and what’s important to the corporation from a success standpoint
(Figure 1). The success model involves benchmarking on mar-kets, portfolio, best-in-class mea-sures, and, most importantly, gaps. Sessions requires the different groups to benchmark on their own to discover the truth. He doesn’t do benchmarking himself because he wants the groups to be owners of the process and the findings.
“If you know what best in class is and know something about yourself, then you’ll know some-thing about the distance between yourself and best in class,” Sessions said. “And that forms a gap that you can close. Doing this in a group and doing it with senior executives really helps [the execu-tives] understand some of the com-monalities across the businesses.”
National Semiconductor benchmarks strategic imperatives, as well as financials. Sessions coached the worldwide
manufac-STRATEGIC BUSINESS PLAN
Figure 1
The Success Model Planning
Methodology
OPERATIONAL BUSINESS
turing locations through the success modeling exercise two years ago. The outcome revealed 40 to 50 independent improvement programs across all of the manufacturing sites. The group discovered after some discussion that every plant had the same issue as No. 1 or No. 2 on their list of priorities. So rather than working on 45 initiatives, the group focused on one across the entire company. This process drove the quantum manufacturing improvements that the organization has in place today.
NATIONAL’S STRATEGIC VISION
Sessions believes National’s strategic vision is easy to understand: “National Semiconductor will put systems on a chip for our key trend-setting data highway partners, using our analog expertise as a starting point for forward integration.” Sessions said that when National’s CEO articulated it, it was clear what businesses National was going to be in. But more importantly, it was clear what businesses National was not going to be in.
“This statement is extremely explicit,” Sessions said. “In fact, what we did is publish this vision statement with little breakout boxes around it just to make sure that people truly understood what division of the com-pany was involved and where we were headed.”
Sessions asked his audience to imagine doing a five-year strategic plan in the Internet environment where seven Internet business years equals one calendar year.
“You would be planning for 35 years out to the future,” Sessions re-marked. “How many of you would do a detailed budget for seven years? You shouldn’t do it. The numbers will always be wrong—I guarantee it.”
Sessions said the traditional planning methods just don’t work and will not deliver satisfactory results. The new methodology focuses more on developing and nurturing the ability to compete, picking a few target programs, driving for success, competing on time, and working toward more of a continuous strategic planning and budgeting type of process. Using this new methodology, National reduced its strategic planning manual from a 4-inch binder to only 10 pages of guidance on a Web site. The planning process was cut from a nine-month cycle to about one quarter and incorporated zero-based budgeting into the strategic planning process.
“We found that if the process was spread out over an extended period of time, there were often tremendous disconnects between what was strategically imagined and the realities of resource constraints to execute the strategy. This often led to great disappointments during the budget-ing phase of plannbudget-ing,” Sessions said. “To help eliminate this problem, we have bounded expectations with the success model front end and more closely tied budgeting to strategy. The key is to make the boundaries large enough to encourage strategic thinking yet small enough to keep the thinking realistic.”
DEEPER IN THE PROCESS
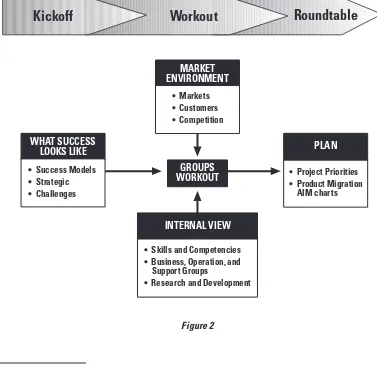
Session “peeled the onion” a little further for his audience to offer more details about the process. For example, as part of each phase of the process, National Semiconductor conducts three types of meetings: kick-off, workout, and roundtable (Figure 2, page 7).
During kickoff, the CEO provides the framework and sets the expec-tations. Workout meetings encourage tacit knowledge sharing as employees work in group sessions. The goal is to explore options and, where possible, reach consensus. If consensus is not reached, the issues are brought to the roundtable for report-out, review, and discussion with executive staff and direct reports.
One example Sessions provided related to the company’s technology group that was discussing an issue about employing engineers with the needed skill sets. After looking around the room, the group realized it didn’t have the right people in the room to talk about that subject. The group formed another team just to examine the types of engineers the company had and what kinds of skills the company would need in the future to hit its vision. Sessions said they uncovered some disturbing news.
SUCCESS MODEL MATRIX
Success in different kinds of markets demands different strategic approaches and has different results metrics. National Semiconductor uses a Success Model 4x3 Matrix that recognizes and categorizes the three kinds of markets and four resource approaches (Figure 3, page 8). Analyzing the 4x3 matrix by product/market and then rolling up by product line, business unit, and corporation can provide insights into how well a business entity is driving the success model criteria and what resource allocations will be required.
National Semiconductor included “invest” in this matrix because the company discovered that the group vice presidents weren’t investing
International Benchmarking Clearinghouse 7 American Productivity & Quality Center
Figure 2
Strategic Business Plan Process
GROUPS WORKOUT WHAT SUCCESS
LOOKS LIKE
• Success Models • Strategic • Challenges
MARKET ENVIRONMENT
• Markets • Customers • Competition
• Project Priorities • Product Migration AIM charts
PLAN
Kickoff
Workout
Roundtable
INTERNAL VIEW
• Skills and Competencies • Business, Operation, and Support Groups
enough patient money into long-term new product development.
“We found we were putting our money in some of the wrong places,” Sessions stated. “Without doing this kind of matrix and without
benchmarking, you would never, ever know this.”
Sessions pulled all these thoughts together with an Analysis-Action-Impact-Management (AIM) chart, which is a strategic management tool that National Semiconductor adapted from Ford Motor Company (Figure 4). The top left quadrant, Success Criteria/Trends, houses the benchmarking data. The top right quadrant, Analysis, includes gaps and discontinuities. Action, bottom left quadrant, is a thumbnail of the implementation. And the fourth quadrant is impact, answering the question: What is the expected benefit, measure of success, and progress for each action?
All this information is essential to the success of National’s strategic planning.
Figure 4
Analysis-Action-Impact Management (AIM) Charts
Put ACTION into Strategy
Red/yellow/green quantitative and benchmarked
(preferred) or qualitative data
Gap/discontinuity analysis— root cause or opportunity
for improvement Pareto
Thumbnail of implementation, constraint removal action plan
for each Pareto item
Completion criteria— expected benefit, measure
of success, and progress tracking for each action SUCCESS CRITERIA/TRENDS ANALYSIS
ACTION (Who-What-When) IMPACT
Figure 3
The 4x3 Success Model Framework
International Benchmarking Clearinghouse 9 American Productivity & Quality Center International Benchmarking Clearinghouse 9 American Productivity & Quality Center
AN EMERGING MODEL
FOR BUS INES S S TRATEGY:
THE S YNTHES IS OF
S TRATEGIC PLANNING
AND PERFORMANCE
MEAS UREMENT IN
LEARNING ENVIRONMENTS
A
ll businesses, no matter their industry, have in common the need to make strategic decisions that lead to certain courses of action, said Patrick Schaefer, principal, Ernst & Young. Such decisions and courses of action frequently require some form of commitment of an entity’s most valuable resources. Without an appropriate framework for strategic decisions involving performance measurement and knowledge manage-ment, key investments in human or financial capital are placed at increasing risk.While strategic planners have often relied on a variety of emergent and deterministic strategic planning models over the years, Schaefer calls for more empirical work directed at better understanding the basic strategic decision-making process itself. This process addresses such key areas as: How should the fundamental questions and hypotheses in the planning process be framed? On what intelligence will key planning decisions be based? What processes are we applying to ensure that sound judgments are made in the planning process? And, finally, how will we monitor our strategic decisions over time to ensure they are effective?
Schaefer addressed some of the important cognitive factors that limit effective answers to these questions:
• Lack of understanding in important causal relationships, i.e., business drivers and outcomes:“This whole issue of understanding cause-and-effect relationships—what are the key business drivers and the desired outcomes and how they correlate—is a critical dimension of strategy,” Schaefer emphasized.
systems of knowledge management—elegant systems of cataloging and retaining knowledge,” Schaefer said. “Frequently, much of the knowledge that is created doesn’t focus on the real strategic needs of the organizations. It is important that knowledge management programs are channeled appropriately.”
• Inability to connect strategic objectives to everyday operating activities:
This occurs when management cannot translate the grand strategic themes into everyday reality at the operating level of the organization. “Performance measurement management systems represent a compel-ling means of ensuring that strategies and everyday performance are linked,” he said.
• Dormant vs. dynamic learning processes:In many cases, information mined in the corporate environment does not advance to a state of maximum utility—that of created knowledge. Related Schaefer: “I am reminded of a public sector entity who we talked to which had an annual market research budget which exceeded $1 million. Executives there were perplexed because they had found that many managers did not have a profound sense of what this market research included. Ex post, they realized that even though they’d had an ongo-ing research program for years, many of the organization’s strategic decisions were still based on conventional wisdom and intuition. They wanted to change this by creating a dynamic learning process which transformed information to knowledge for better decisions.” • Poor analytical tools to support strategic decisions:One reason
information remains dormant, Schaefer said, is “there frequently aren’t adequate analytical tools being used to apply the information as a knowledge enhancement.” Key analytical techniques for ensuring applied knowledge include more effective use of scenario planning and simulation techniques.
• Narrow organizational/human capital focus:Despite the growing emphasis on learning in many companies, strategic decisions are often impaired because firms fail to appreciate the value of inputs from a wide variety of employees in favor of a top-down approach. “This can lead to a vast number of employees becoming an underleveraged resource,” he said.
(Dynamic character is a term created by Michael Porter.) How are we truly different from other organizations in our industry?”
“If we can’t determine what that differentiation is, it really should force us to rethink what it is we’re doing and how we’re allocating resources and choosing our courses of action,” Schaefer noted. • Issues related to framing/bias: Many cognitive errors in strategic
decision making occur because of issues of framing and bias. For instance, “confirmation bias” occurs when executives look for evidence that confirms, rather than challenges, their conventional beliefs. Companies show “recency bias” when they create strategies based on only the most recent events or information they’ve received. “Group-think bias” occurs when strategic decisions become too automatic, are based on perceived consensus, and there is a failure to appropriately manage key elements of the group decision-making process.
IMPROVING STRATEGIC DECISIONS
To cope with these issues, Schaefer suggested that strategic planners ask three categories of questions:
1. What is the fundamental logic of the strategic planning process we’ve defined? Is it comprehensive, objective, timely, and broad-based in terms of inputs from key parts of the organization?
2. How do we intend to link the strategic plan to everyday operations to ensure effective implementation?
3. How do we support this process through a learning and information process that is focused on the strategic objectives?
The strategic architecture, Schaefer explained, “represents how the values, purpose, and operating principles in an organization are
connected to its vision and a strategy. To avoid a disconnect between the planning and reality, strategic objectives must be tied to the everyday operating environment—usually through some form of well-reasoned, logical performance criteria.”
Performance measures come in many forms, including economic value measures, financial measures such as cash flow from return on investment, and a combination of methods for linking nonfinancial and financial measures. One of the more popular in this third category is the
International Benchmarking Clearinghouse 11 American Productivity & Quality Center
• Provide a complete set of performance measures that express the intent of organiza-tional strategy and a vital means for connecting it to operations • Define the key drivers of
organi-zational success, i.e., the most essential activities at which organizations must succeed • Develop a set of performance
measures that give management a quick, yet thorough, view of the business or organization that shows how results are achieved • Balance the focus on financial
outcome measures and opera-tional measures (in such areas as human resources, technology, marketing, and other nonfinan-cial areas) that most influence future financial performance • Emphasize joint accountability
for results and widespread understanding between an organization and its strategic partners of what those results should be
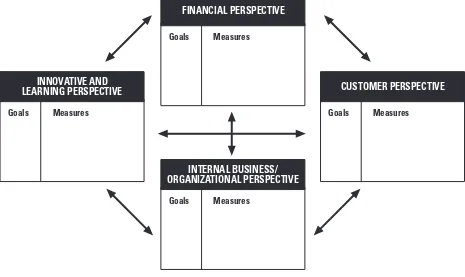
balanced scorecard method of performance measurement, developed by Kaplan and Norton, which creates a framework that ties or translates the strategic objectives of an organization to performance measures (Figure 5). While the benefits of performance measurement systems that include the balanced scorecard are numerous, Schaefer said, perhaps most important is that performance measurement allows an organization to express the intent of its strategy and how that strategy connects with everyday operations. Performance measurement systems also create an essential feedback and learning mechanism in support of key management decisions.
Learning processes, if dynamic, can influence both performance mea-sures and organizational strategies. The key needs in creating dynamic organizational learning processes, Schaefer said, are as follows:
Figure 5
Four Key Perspectives of the Balanced Scorecard
INTERNAL BUSINESS/ ORGANIZATIONAL PERSPECTIVE
Goals Measures INNOVATIVE AND
LEARNING PERSPECTIVE
Goals Measures
CUSTOMER PERSPECTIVE
Goals Measures FINANCIAL PERSPECTIVE
Goals Measures
• practices aimed at improving the quality of information/technology flows that support strategic decisions,
• capacity building—developing new individual and collective capabilities that support and are addressed by the strategic planning process,
• development of organizational learning infrastructures,
• development of systems for analyzing and cataloging tacit and explicit forms of knowledge, and
• productivity measures and analytical tools aimed at increasing the utility of knowledge and information as a dynamic element of strategic decisions.
By understanding how these three areas of strategic planning, perfor-mance measurement, and knowledge management interconnect, companies can find compelling new ways to improve the strategic decision process.
IMPLEMENTING A S TRATEGIC
PLANNING PROCES S BAS ED
ON BES T PRACTICES —
TURNING INTERNAL AND
EXTERNAL INFORMATION
INTO ACTION
A
ustin Energy, a Texas utility serving about 300,000 residential customers and 50,000 companies, has always done a lot of plan-ning. It plans for weather, it plans for load, it plans for maintenance, it plans for just about everything ... for the next 30 years.“You name it, we plan it,” said J.J. Gutierrez, an internal consultant with the company’s Corporate Improvement Services (CIS) management support group.
But until recently, the company’s planning process had some flaws. There were far too many planning groups and the many plans that were generated focused only on particular silos. There was no mention of a strategic plan for the company as a whole.
“We didn’t have one,” Gutierrez said. “We thought we’d put all these things in a notebook and that’s our plan. But that’s not effective at all.”
Once some of the problems were realized, Austin Energy (AE) sought answers by participating in several consortium benchmarking studies that focused on strategic planning. After gaining some eye-opening insights, the company redesigned its strategic planning process with an emphasis on simplification.
“That was a critical key, a critical step number one,” Gutierrez said. “Simplify it, make it something that everyone can understand. Every employee needs to be involved in this process, and they are.”
“So we’re providing information to our key processes at the time they need it,” Gutierrez said. “This whole [process] is timed so that when the other management processes are happening, strategic planning is provid-ing the information that they need.”
Before its revamping, the strategic planning process at AE was viewed simply as the process by which a budget is developed for the following year. Company leaders have since realized that by pulling a budget together first, they were inadvertantly planning for the next year. Now, a direct input into the budget process is AE’s strategic target, and a direct output from the budget is specific funding for projects. The new process helps the company clearly define what it will work on in the coming months and who will take part in the work.
International Benchmarking Clearinghouse 15 American Productivity & Quality Center
Figure 6
Austin Energy’s New Strategic Planning Process
COMPETITIVE INTELLIGENCE
PROCESS
PERFORMANCE MEASUREMENT
PROCESS ENERGY FORECAST AND SYSTEM
PLANNING
ANNUAL BUDGET PROCESS
3
Define Strategies
2
Set Strategic Direction
4
Strategy Rollout
5
Evaluation
1
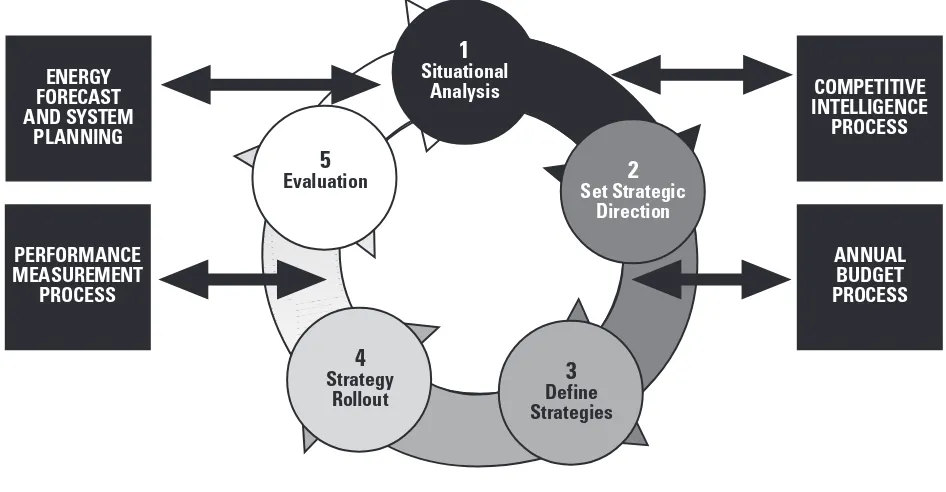
“We’re integrating our key management processes with the strategic planning process so that it’s not this separate entity that happens in isolation,” Gutierrez said. “It is an integral part of our management process, and it’s built that way.”
BEST-PRACTICE IDEAS
In addition to gaining new insights into strategic planning through participation in consortium studies conducted by the American Productivity & Quality Center, Austin Energy relied on the studies to uncover best practices that have led to its own process redesign.
For example, when the organization developed its planning model, it made sure that the model contained straightforward wording and a limited number of steps to increase ease of use, thus avoiding the confu-sion and complexity of other models that featured multiple acronyms and an excessive number of steps. By incorporating that best-practice idea, AE has enabled its employees and managers to use the new planning model to more easily determine what is happening and what outcomes may result.
Another change at Austin Energy that stemmed from examination of best practices involved the inclusion of business area representatives on a new strategic planning team that also comprised CIS members. The representatives—managers from each of the organization’s seven business areas (which have since been reduced to four)—were brought in to serve full time on the planning team during the annual three-month planning period. Afterward, they return to their regular jobs to “tie back to this process,” said Gutierrez, who noted that the recent infusion of new blood shook up the strategic planning system at Austin Energy.
“We brought the business area reps in, and they said, ‘Why are you doing that? Why are you sticking to this method when maybe it doesn’t fit our organization? Let’s tailor it,’” Gutierrez related. “We gained insight into the real issues facing the business areas because [the reps] were there to tell us, ‘This is what we’re facing, this is what we’re worried about, these are the possible implications of these competitive threats.’
Gutierrez said the combination of CIS members and business area representatives offers the organization a powerful communication tool and improves the planning capabilities of the individual business areas since the reps from the strategic planning team return to those areas.
The change allowed the CIS group to gain: • insight into the issues facing business areas, • an extra set of arms and legs to do work, and • a powerful communication vehicle.
The business areas have gained: • knowledge transfer capability,
• the ability to mold the process to better fit them, and • a powerful feedback vehicle.
THE NEW PROCESS
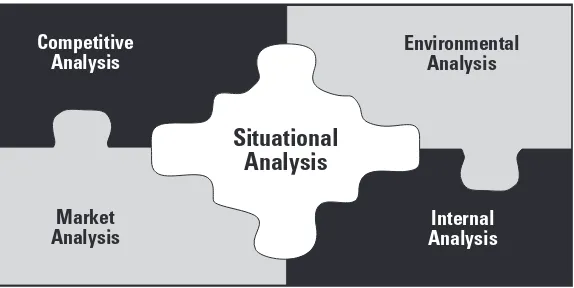
In describing the new strategic planning process at Austin Energy, Gutierrez focused heavily on the first step in the process loop, situational analysis. She explained step one as an assessment of the organization’s current state—what’s happening now. To determine that, AE’s situa-tional analysis involves four types of analyses: competitive analysis, envi-ronmental analysis, market analysis, and internal analysis (Figure 7).
Competitive Analysis
Gutierrez described AE’s competi-tive analysis efforts as “benchmarking with a twist” because the methods used by the organization were some-what unorthodox. According to Gutierrez, after identifying a group of competitor utilities, Austin Energy “went inside their organizations,” although not literally, to gather infor-mation such as facts and figures reported to the government, earnings data, etc. AE then purchased a data-base that housed the competitor information and served as the input in the analysis process.
International Benchmarking Clearinghouse 17 American Productivity & Quality Center
Figure 7
Internal Analysis Competitive
Analysis
Assessment of the State of the Organization
Once the information gathering was completed, the strategic
planning team identified a group of competitors to serve as a comparison group. The team selected a small set of mixed companies that
surrounded AE’s service territory and then determined ways to make comparisons between the six companies. Next, the team undertook the difficult task of selecting comparison ratios, or parameters of metrics.
“We had this huge database, and we could have run 1,200 different comparisons,” Gutierrez said. “But we needed to run comparisons that were interesting to our planners, our business reps, and eventually our executive team and vice presidents.”
So the group selected 80 comparison ratios, pulled in AE data and data from its six competitors, and ranked each of the organizations in the various categories. By doing so, AE was able to determine where it stood in relation to its competitors. The group then digested the numbers to determine the group average, whether AE’s performance was favorable or unfavorable, and its standing in relation to its competitors. The group even developed a color code system based on a performance measure-ment scorecard deemed best practice in a benchmarking study: Red equals something to worry about, yellow is lukewarm, green translates to no significant concerns.
“Our management team could quickly look at the ratios and say, ‘Wow, we’re ranked fourth out of seven in this study area based on these metrics, and this is important to us,” Gutierrez said. “It’s an easy way to assess how we’re doing and what the current state is.”
For each step of AE’s new strategic planning process, Gutierrez pro-vided a few bullet points regarding what worked well and what did not. With regard to competitive analysis, she offered several observations.
What worked well:
• Business area reps running the analysis for their respective areas • Summarization of findings
• Communication and discussion around the findings
What did not work well: • Too many metrics
• Management somewhat stunned by the findings
International Benchmarking Clearinghouse 19 American Productivity & Quality Center
Market Analysis
This quadrant of situational analysis is a fairly traditional process at Austin Energy that involved defining and analyzing markets and growth potential. At this stage, the organization relied heavily on a plethora of information housed within its marketing division. Gutierrez said the information was segmented into markets, which were segmented based on like customer needs and wants.
“A lot of this is marketing strategy, and we let the marketing business unit lead this analysis,” she said. “They were excited about the output and the forum to share this information with the rest of the organization.”
According to Gutierrez, the marketing professionals have been instru-mental in this type of analysis because they are able to transfer valuable knowledge to planners and because “that’s their territory, they know it, and they understand it.” The fact that the organization already possessed most of the necessary information also has made for a fairly smooth process, although digesting it all was difficult.
“We basically grabbed marketing studies and marketing reports, pulled in the pertinent information, and made it relevant to planning,” Gutierrez said. “So there wasn’t a lot of new development of data here. The majority of the time was spent on analyzing—seeing what’s perti-nent to strategic planning.”
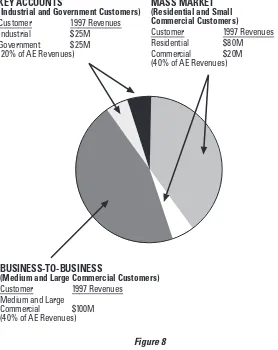
The market analysis revealed that AE essentially had three customer groups and showed where the organization needed to focus efforts and make changes (Figure 8, page 20). It was critical in determining trends that might impact the organization’s future direction.
Gutierrez noted that the incorporation of market analysis into the process represented the first time managers had been exposed to such information in that particular format. Thick marketing reports previ-ously were the primary format used, and they usually were not distri-buted to the complete management team.
What worked well:
• Marketing business area led the analysis • Used data from existing reports and databases
• Majority of time was spent on data analysis rather than data collection
What did not work well:
• There was so much information that it was hard to digest
• Marketing business area developed potential strategies; other managers had limited input
Environmental Analysis
This third quadrant of situational analysis involves researching current events and trends in Austin Energy’s industry to determine whether any of those pose potential harm to the organization’s quest for success. Information from all types of sources and competitive
intelligence avenues were used in this phase, including trade magazines, industry news reels, etc.
Figure 8
Sample Results From Market Analysis
KEY ACCOUNTS
(Industrial and Government Customers)
Customer 1997 Revenues Industrial $25M Government $25M (20% of AE Revenues)
MASS MARKET
(Residential and Small Commercial Customers)
Customer 1997 Revenues Residential $80M Commercial $20M (40% of AE Revenues)
BUSINESS-TO-BUSINESS
(Medium and Large Commercial Customers)
Customer 1997 Revenues Medium and Large
AE outsourced this function to the APQC Consulting Group because of its information-gathering capabilities and its experience in working with other companies on similar endeavors. After the external
consultants generate a comprehensive report, its contents are communi-cated to the AE’s planning, management, and executive teams. The executive team is left to determine the top five trends affecting Austin Energy. In the first year of this new strategic planning process, trends were identified in areas such as deregulation, technology, brand building, and marketing.
“We pulled the information together in these different areas and then put it in a nice format so that managers could quickly make some assess-ment,” Gutierrez said, noting that informational findings were reported in small management focus groups. “In those groups there was a great deal of discussion about the implications of those trends. We really began to develop our options for strategies and for strategic planning. So this was a real starter.”
What worked well: • Outsourced research
• Used research as discussion starter; managers added their own information
• Boiled information down to five trends
What did not work well:
• Discussions took off on irrelevant tangents
• Did not allow enough time to perform the research
• Did not direct the research to focus on specific issues of interest to the management team
Internal Analysis
The fourth and final component of the situational analysis phase is described by Gutierrez as being “the most fun” because it involved mem-bers of the organization’s management team. As part of AE’s internal analysis, the managers and the executive team worked in small focus groups as the strategic planning team members acted as facilitators. The inputs in this phase included all the analyses that had previously taken place: competitive analysis, market analysis, and environmental analysis.
“All of our information was at their fingertips,” Gutierrez said, “and then we did what is basically a SWOT analysis.”
The individual focus groups set out to determine strengths, weak-nesses, opportunities, and threats (SWOTs) as they related to their partic-ular business areas. Later, the groups came together to determine the corporate SWOTs.
During this phase, the focus groups also examined the strategic intent, vision, and mission for each business unit and developed a statement based on data and analyses (Figure 9).
“We let each group develop their own and then we held a session where all the business units developed one for the corporation,” Gutierrez said.
What worked well:
• Held individual sessions for each business area • Built synergy among management team • Generated many ideas and potential strategies
• Created momentum and excitement about strategic planning • SWOT analysis forced the team to analyze the organization’s
opportunities and threats
What did not work well: • Tried to combine several of the
smaller business areas into the same session
• Difficult to capture all of the good ideas in subsequent strategies • Developing vision, mission, and
strategic intent statements
THE REMAINING STEPS
Setting Strategic Direction
The second step of AE’s strategic plan-ning process involves setting strategic direction using all the information gath-ered in step one. By prioritizing what was accomplished in the focus groups and developing a hierarchy of important trends, AE set its corporate goals.
At this juncture, three levels of AE employees including vice presidents
Figure 9
Internal Analysis
Sample of the Results From the Internal Analysis
STRATEGIC INTENT
Power Production will be a profitable business enterprise capable of adapting to market changes.
VISION
Power Production is a profitable regional energy provider supplying a diversified energy product mix with a highly skilled
work force, state-of-the-art technology, and an aggressive wholesale marketing strategy.
MISSION
Power Production is committed to the profitable production and trading of energy. This will be performed by optimizing generation assets in
a safe, reliable, and community-responsive manner, recognizing the benefit to Austin Energy, its employees, and the citizens of Austin.
and directors came together for what Gutierrez called “an interesting session.”
“Just imagine 40 people in a room to come to a consensus or prioritize something,” she said. “I facilitated that session, and, believe it or not, by the end of an eight-hour day we had come to a consensus on what our corporate goals were, what our vision and mission statements should be, and what strategies we should go for.”
The only negative that arose from the meeting came about when the group “crossed the line into target setting.” Gutierrez said the meeting was intended to remain at a “high level” and address issues such as growth and potential new markets but degenerated into focused discus-sions about budget dollars and line items. “We didn’t want to go there,” she said.
Another component of this second step involved reporting to the rest of the utility what had been accomplished. A two-page handout, known as the Corporate Strategy Statement, summarized all the work that was done and presented the following:
• the company vision, mission, and values; • top external trends;
• corporate strengths, weaknesses, opportunities, and threats; • Austin Energy market segments; and
• corporate goals and objectives.
The statement was disseminated to every AE employee via the company’s intranet and e-mail system, offering employees opportunities to provide feedback, which was used in the next step of the strategic planning process—defining strategies.
Defining Strategies
The strategy definition phase involved evaluating 31 options of potential strategies in the various business areas of Austin Energy. The planning team performed a cost-benefit analysis of each option with the help of a self-produced spreadsheet template to determine whether it would be prudent to implement each.
Following analysis of the numerous options, the AE executive team selected 12 to become company strategies. Some of these included: • develop and implement an employee reward and recognition program, • strategically eliminate debt,
• build strategic alliances and community support, and • actively pursue development of new products and services.
“[The selected strategies] are very high level,” Gutierrez said. “These are not projects, and these are not initiatives. These determine whether or not we are going to go into debt, whether or not we’re going to build alliances, and what would be the result or benefit of doing that and when.”
Gutierrez said the strategy definition phase went well, even though the planning team quickly realized that the data required to complete the business analysis were scarce.
“We wanted to have all the information, all the data, and all the pieces of the puzzle, but it just wasn’t there,” she said. “We had to accept that we weren’t going to have all the information, but we still had to be able to make assessments and assumptions and go forth with what we thought was the best information we could provide within the time limit.”
Strategy Rollout
The fourth step in the AE strategic planning process involved developing action plans that describe what must be accomplished to achieve strategy and reach goals. This phase included the tactical aspects of strategy implementation such as:
• business area involvement,
• key steps and milestones to be completed, • estimated resources,
• estimated benefits, and • time line.
Austin Energy developed an online, Internet-based system called COMPASS to capture the action plans, and the system now serves as a means for tracking AE’s progress toward completion of them.
Gutierrez said the system, to which all employees have access, makes it possible to more easily determine what worked and what didn’t work— allowing for informed future planning.
Evaluating Progress
According to Gutierrez, this final step represents the organization’s follow-through on its strategic planning process. At this point the strate-gic planning team is disbanded, leaving AE’s Corporate Improvement Services Group to compile quarterly reports that review several aspects of the plan. The group measures progress by reviewing performance measures information and conducting gap analysis—evaluation methods that allow the organization to make mid-course changes in strategy if necessary. Performance measures become more than simply metrics for each manager; they track the metrics that measure the corporate strategic goals.
All of the organization’s performance measures are accessible via the organization’s intranet, and process managers directly update measure-ment information in the performance tracking system.
“We’re tracking not only measures that tell the manager about his area and what he needs to track or improve but also whether or not we’re on track with meeting our targets, meeting our goals, and completing our strategies,” Gutierrez said.
What Doesn’t
1 2 3 No rth Po s t Oak Lane , 3 rd Flo o r
Ho us to n, Te xas 7 7 0 2 4 -7 7 9 7
8 0 0 -7 7 6 -9 6 7 6 • 7 1 3 -6 8 1 -4 0 2 0
www.apqc .o rg • apqc info @ apqc .o rg © 1 9 9 8 APQC.