Kota Bogor Dalam Angka/Bogor City in Figures 2013
221
5
Pertanian/
Agriculture
Kota Bogor Dalam Angka/Bogor City in Figures 2013
223
PERTANIAN
Sebagian besar lahan pertanian di Kota Bogor adalah lahan bukan sawah
yaitu sebesar 2.476 ha atau sekitar 76 persen. Sementara 24 persen sisanya adalah
lahan sawah, dan sebagian besar berlokasi di Kecamatan Bogor Selatan (283 ha),
Bogor Barat (270 ha) dan Bogor Timur(178 ha).
Produksi palawija di Kota Bogor, tahun 2013 terbesar adalah ubi kayu
sebanyak 5.160 ton dan talas yang mencapai 2.360 ton. Sementara itu produksi
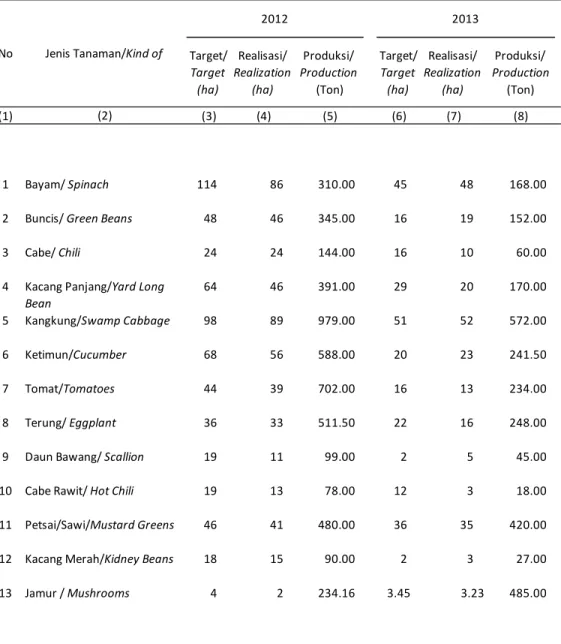
sayuran didominasi oleh kangkung, petsai dan jamur. Selama tahun 2013
produksinya masing-masing mencapai 572 ton (kangkung), 420 ton petsai dan 485
ton jamur.
Produksi buah-buahan selama tahun 2013 terbesar adalah jambu biji yang
menghasilkan 2.098 ton dan nangka sebanyak 1.050,6 ton. Selanjutnya disusul
oleh rambutan sebanyak 716,9 ton dan durian sebanyak 670,1 ton, sementara
buah-buahan lainnya hanya berproduksi tidak lebih dari 500 ton saja.
Pada 2013, produksi tanaman obat-obatan mengalami penurunan,
temulawak hanya menghasilkan 22,60 ton, selanjutnya mengkudu/pace hanya
sebesar 12,45 ton dan laos hanya berproduksi sebanyak 12,90 ton dan lidah buaya
hanya 13,37 ton. Demikian juga halnya dengan produksi tanaman hias dimana
selama tahun 2013 pada umumnya mengalami penurunan produksi
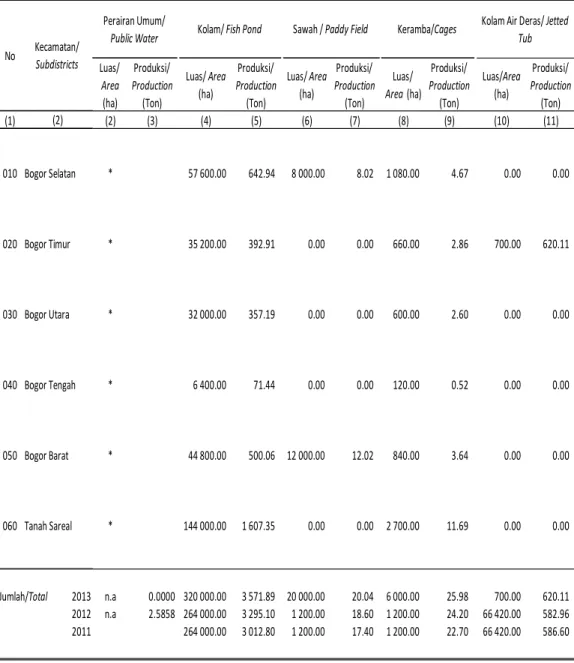
Produksi ikan di Kota Bogor tahun 2013 mencapai 4.192,0 ton, sebagian
besar berasal dari budi daya ikan kolam yaitu sekitar 85,21 persen atau sebesar
3.571,89 ton.
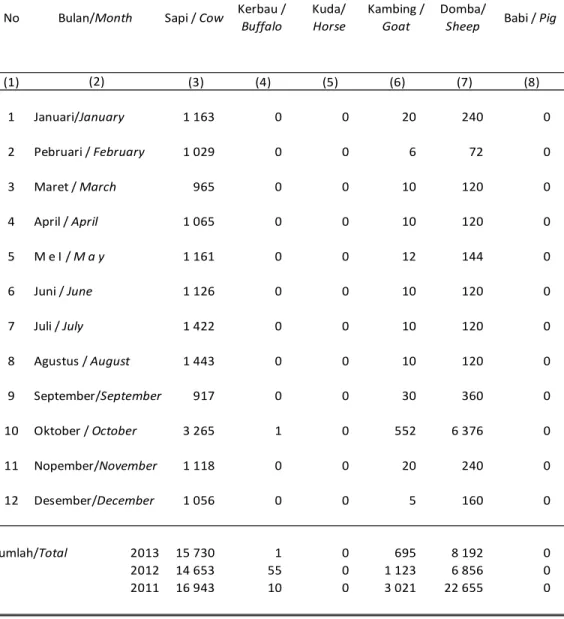
Populasi ternak selama 2013 banyaknya ternak yang dipotong terdiri dari
15.730 ekor sapi, 695 ekor kambing dan 8.192 domba. Dengan menghasilkan
daging masing-masing 3.044.008 kg daging sapi, sebanyak 8.582 kg daging kambing
dan sebanyak 88.831 kg daging domba.
224
Kota Bogor Dalam Angka/Bogor City in Figures 2013
AGRICULTURE
Most of the agricultural land in the city of Bogor is not a paddy field that is
equal to 2,476 ha, or about 76 percent. While 24 percent of the rest is wetland, and
most are located in Bogor Selatan sub-district (283 ha), Bogor Barat (270 ha) and
Bogor Timur (178 ha).
Production of crops in Bogor City, in 2013 is the largest cassava and taro as
much as 5,160 tons of which reached 2,360 tons. Meanwhile, vegetable production
is dominated by kale, cabbage and mushrooms. During the 2013 production
respectively reached 572 tonnes (kale), 420 tons of cabbage and 485 tons of
mushrooms.
Fruit production for the year 2013 is the largest guava and jackfruit
produce as much as 2,098 tons of 1050.6 tons. Next followed by as much as 716.9
tons of rambutan and durian as much as 670.1 tonnes, while other fruits are not
only producing more than 500 tons.
In 2013, production of medicinal plants has decreased, ginger only produce
22.60 tons, then noni / pace of only 12.45 tonnes and laos only produce as much as
12.90 tons and 13.37 tons of aloe only. Similarly, the production of ornamental
plants which during the year 2013 in general decreased production.
Fish production in the city of Bogor in 2013 reached 4192.0 tons, mostly
from aquaculture ponds which is about 85.21 percent or a total of 3571.89 tons.
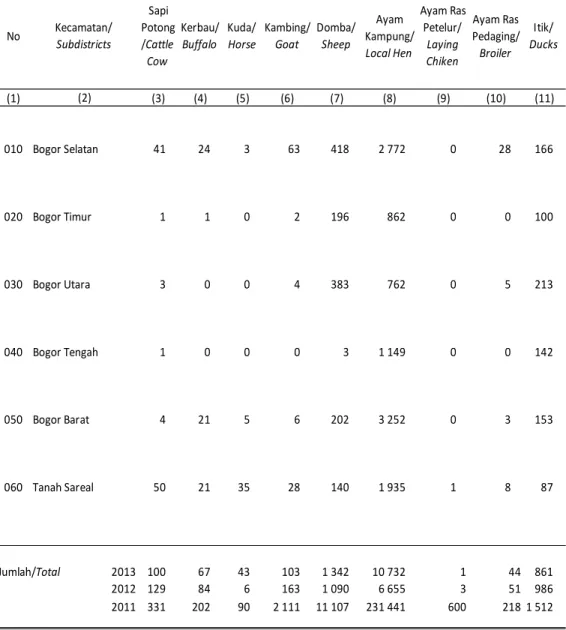
Livestock population during 2013 the number of cattle slaughtered
consisted of 15 730 cows, 695 goats and 8,192 sheep. By producing meat each
3,044,008 kg of beef, as much as 8582 kg of goats and sheep meat as much as 88
Kota Bogor Dalam Angka/Bogor City in Figures 2013
225
Tabel 5.1 Table 2013 (1) 010 Bogor Selatan 283 580 020 Bogor Timur 178 383 030 Bogor Utara 5 493 040 Bogor Tengah 0 22 050 Bogor Barat 270 574 060 Tanah Sareal 14 424 Jumlah/Total 2013 750 2 476 2012 750 2 476 2011 750 2 374Sumber : Dinas Pertanian Kota Bogor
Source : Department of Agriculture of Bogor City
Luas lahan Pertanian Menurut Kecamatan
Extensive Agricultural Land by Subdistricts
No Kecamatan/
Subdistricts
(2)
Lahan Sawah/Area
of Wet Land (ha)
Lahan Bukan Sawah/Area of Dry
Land (ha)
226
Kota Bogor Dalam Angka/Bogor City in Figures 2013
Tabel 5.2 Table 2013 (1) (3) (4) (5) (6) (7) (8) 010 Bogor Selatan 156 0 127 0 0 283 020 Bogor Timur 139 38 1 0 0 178 030 Bogor Utara 0 0 5 0 0 5 040 Bogor Tengah 0 0 0 0 0 0 050 Bogor Barat 0 66 204 0 0 270 060 Tanah Sareal 0 6 0 0 8 14 Jumlah/Total 2013 295 110 337 0 8 750 2012 295 110 337 0 8 750 2011 295 110 337 0 8 750Sumber : Dinas Pertanian Kota Bogor
Source : Department of Agriculture of Bogor City
No Kecamatan/
Subdistricts
Luas lahan sawah/Area of Wet Land (ha)
Jumlah/
Total
Sistim Irigasi/Irrigation Systems
Tadah Hujan/ Rain Fed Teknis/ Technical Setengah Teknis/Semi Technical Sederhana/ Non Technical Non PU/Non PU Luas Lahan Sawah Menurut Kecamatan dan Sistim Irigasi
Area of Wet Land by Subdistricts and Irrigation Systems
Kota Bogor Dalam Angka/Bogor City in Figures 2013
227
Tabel 5.3 Table 2012 (1) (3) (4) (5) (6) (7) (8) 010 Bogor Selatan 282 73 19 11 195 580 020 Bogor Timur 137 54 18 7 167 383 030 Bogor Utara 195 93 13 0 192 493 040 Bogor Tengah 3 3 5 0 11 22 050 Bogor Barat 128 102 8 0 336 574 060 Tanah Sareal 219 71 12 4 118 424 Jumlah/Total 2013 964 396 75 22 1 019 2 476 2012 964 366 75 27 942 2 374 2011 964 366 75 27 942 2 374Sumber : Dinas Pertanian Kota Bogor
Source : Department of Agriculture of Bogor City
No Kecamatan/
Subdistricts
Luas lahan bukan sawah/Area of Dry Land (ha)
Jumlah/ Total Tegal/ Ditanami Pohon/Trees Planted Kolam/ Fishpond Tidak Diusahakan/ Temporarily Non Cultivated Lainnya/ Others (2)
Luas Lahan Bukan Sawah Menurut Kecamatan
228
Kota Bogor Dalam Angka/Bogor City in Figures 2013
Tabel 5.4
Table Target and Realization of Paddy
2013 (1) (3) 010 Bogor Selatan 298 1 848.00 0 020 Bogor Timur 75 465.00 0 030 Bogor Utara 6 37.00 0 040 Bogor Tengah 0 0.00 0 050 Bogor Barat 308 1 910.00 0 060 Tanah Sareal 0 0.00 0 Jumlah/Total 2013 687 4 260.00 0 2012 1 347 8 149.35 0 2011 1 732 10 431.90 0
Sumber : Dinas Pertanian Kota Bogor
Source : Department of Agriculture of Bogor City
Padi Ladang/Dry
Land Paddy
Produksi/Production (ton) Target dan Realisasi Produksi Padi
No Kecamatan/ Subdistricts (5) (4) (2) Luas panen/ Area Harvested
(ha) Padi Sawah/Wet
Kota Bogor Dalam Angka/Bogor City in Figures 2013
229
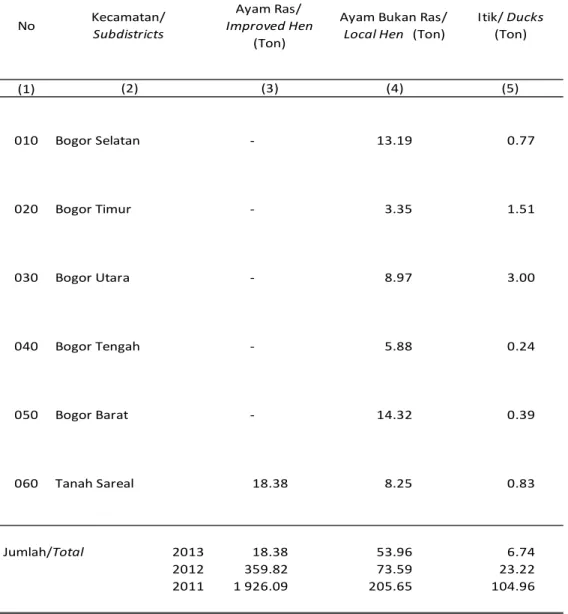
Tabel 5.5 Produksi Telur Unggas Menurut Kecamatan
Table Poultry Egg Production by Subdistricts
2013 (1) 010 Bogor Selatan - 13.19 0.77 020 Bogor Timur - 3.35 1.51 030 Bogor Utara - 8.97 3.00 040 Bogor Tengah - 5.88 0.24 050 Bogor Barat - 14.32 0.39 060 Tanah Sareal 18.38 8.25 0.83 Jumlah/Total 2013 18.38 53.96 6.74 2012 359.82 73.59 23.22 2011 1 926.09 205.65 104.96
Sumber : Dinas Pertanian Kota Bogor
Source : Department of Agriculture of Bogor City
No Kecamatan/ Subdistricts (2) Ayam Ras/ Improved Hen (Ton)
Ayam Bukan Ras/
Local Hen (Ton)
Itik/ Ducks (Ton)
230
Kota Bogor Dalam Angka/Bogor City in Figures 2013
Tabel 5.6 Luas Areal dan Jumlah Produksi Ikan Menurut Tempat Penangkapan/Pemeliharaan per Kecamatan
Table Total Area and Total Production of Fish According to the Place of Capture / Maintenance by Subdistricts
2013 (1) (2) (3) (4) (5) (6) (7) (8) (9) (10) (11) 010 Bogor Selatan * 57 600.00 642.94 8 000.00 8.02 1 080.00 4.67 0.00 0.00 020 Bogor Timur * 35 200.00 392.91 0.00 0.00 660.00 2.86 700.00 620.11 030 Bogor Utara * 32 000.00 357.19 0.00 0.00 600.00 2.60 0.00 0.00 040 Bogor Tengah * 6 400.00 71.44 0.00 0.00 120.00 0.52 0.00 0.00 050 Bogor Barat * 44 800.00 500.06 12 000.00 12.02 840.00 3.64 0.00 0.00 060 Tanah Sareal * 144 000.00 1 607.35 0.00 0.00 2 700.00 11.69 0.00 0.00 Jumlah/Total 2013 n.a 0.0000 320 000.00 3 571.89 20 000.00 20.04 6 000.00 25.98 700.00 620.11 2012 n.a 2.5858 264 000.00 3 295.10 1 200.00 18.60 1 200.00 24.20 66 420.00 582.96 2011 264 000.00 3 012.80 1 200.00 17.40 1 200.00 22.70 66 420.00 586.60
Sumber : Dinas Pertanian Kota Bogor
Source : Department of Agriculture of Bogor City
No Kecamatan/ Subdistricts Luas/ Area (ha) Produksi/ Production (Ton) Luas/ Area (ha) Produksi/ Production (Ton) Kolam/ Fish Pond Sawah / Paddy Field
Produksi/ Production (Ton) Luas/Area (ha) Produksi/ Production (Ton) Keramba/Cages Kolam Air Deras/ Jetted
Tub (2) Perairan Umum/ Public Water Luas/ Area (ha) Produksi/ Production (Ton) Luas/ Area (ha)
Kota Bogor Dalam Angka/Bogor City in Figures 2013
231
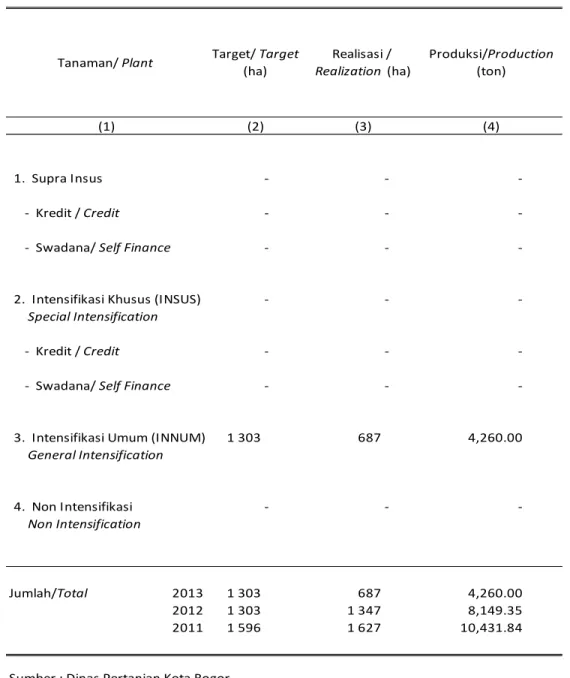
Tabel 5.7 Target, Realisasi dan Produksi Tanaman Padi Menurut Intensifikasi
Table Target, Realization and Actual Production of Rice Crop by Intensification
2012
1. Supra Insus - - - Kredit / Credit - - - Swadana/ Self Finance - -
-2. Intensifikasi Khusus (INSUS) - - Special Intensification
- Kredit / Credit - - - Swadana/ Self Finance - -
-3. Intensifikasi Umum (INNUM) 1 303 687 4,260.00 General Intensification 4. Non Intensifikasi - - Non Intensification Jumlah/Total 2013 1 303 687 4,260.00 2012 1 303 1 347 8,149.35 2011 1 596 1 627 10,431.84
Sumber : Dinas Pertanian Kota Bogor
Source : Department of Agriculture of Bogor City
(1) Target/ Target (ha) Realisasi / Realization (ha) Produksi/Production (ton) Tanaman/ Plant (2) (3) (4)
232
Kota Bogor Dalam Angka/Bogor City in Figures 2013
Tabel 5.8
Table Target and Actual Production of Crops
2013 (1) (3) (4) (5) (6) (7) (8) 1 Jagung/ Corn 197 202 727.20 134 146 525.50 2 Kedelai/ Soybean 0 0 0.00 0 0 0.00 3 Kacang Tanah/Peanuts 74 87 107.30 29 44 54.50 4 Kacang Hijau/Mungbean 0 0 0.00 0 0 0.00 5 Ubi Kayu/Cassava 312 244 3 140.28 387 344 5 160.00 6
Ubi Jalar /Sweet potatoes 96 110 1 441.00 129 128 1 664.00
7
Sorgum / Sorghum 0 0 0.00 0 0 0.00
8 Talas/ Taro 169 115 3 232.65 121 118 2 360.00
Sumber : Dinas Pertanian Kota Bogor
Source : Department of Agriculture of Bogor City
(2)
Target dan Realisasi Produksi Palawija
No Tanaman/plant 2012 2013 Target/ Target (ha) Realisasi/ Realization (ha) Produksi/ Production (Ton) Target/ Target (ha) Realisasi/ Realization( ha) Produksi/ Production (Ton)
Kota Bogor Dalam Angka/Bogor City in Figures 2013
233
Tabel 5.9 Target, Realisasi dan Produksi Tanaman Sayuran Menurut Jenis Tanaman di Kota Bogor
Table Target, Realization and Actual Production of Vegetables by Kind in Bogor City
2013
(1) (3) (4) (5) (6) (7) (8)
1 Bayam/ Spinach 114 86 310.00 45 48 168.00 2 Buncis/ Green Beans 48 46 345.00 16 19 152.00 3 Cabe/ Chili 24 24 144.00 16 10 60.00 4 Kacang Panjang/Yard Long 64 46 391.00 29 20 170.00
Bean
5 Kangkung/Swamp Cabbage 98 89 979.00 51 52 572.00 6 Ketimun/Cucumber 68 56 588.00 20 23 241.50 7 Tomat/Tomatoes 44 39 702.00 16 13 234.00 8 Terung/ Eggplant 36 33 511.50 22 16 248.00 9 Daun Bawang/ Scallion 19 11 99.00 2 5 45.00 10 Cabe Rawit/ Hot Chili 19 13 78.00 12 3 18.00 11 Petsai/Sawi/Mustard Greens 46 41 480.00 36 35 420.00 12 Kacang Merah/Kidney Beans 18 15 90.00 2 3 27.00 13 Jamur / Mushrooms 4 2 234.16 3.45 3.23 485.00
Sumber : Dinas Pertanian Kota Bogor
Source : Department of Agriculture of Bogor City
Produksi/ Production (Ton) Jenis Tanaman/Kind of No 2012 2013 Target/ Target (ha) Realisasi/ Realization (ha) Produksi/ Production (Ton) Target/ Target (ha) Realisasi/ Realization (ha) (2)
234
Kota Bogor Dalam Angka/Bogor City in Figures 2013
Tabel 5.10
Table The Number of Trees Planted Harvested and Production of Fruits Tree in Bogor City
2013 (1) (3) (4) (5) (6) (7) (8) 1 Alpukat/Alvocado 0 4 548 73.9 0 3 799 303.9 2 Belimbing/Starfruit 0 7 556 170.0 0 5 463 65.6 3 Jengkol/ Jengkol 0 1 028 1.3 0 308 23.1 4 Durian/Durian 0 8 712 222.7 5 4 467 670.1 5 Jambu Biji/ Guava 3 140 110 052 1 128.0 1 900 104 480 2 089.6 6 Jeruk/ Orange 0 6 836 35.9 100 5 370 64.4 7 Mangga/ Manggo 0 4 152 249.1 12 4 432 354.6 8 Manggis/Mangosteen 0 2 912 51.0 0 824 82.4 9 Nangka/Jack fruit 0 4 452 27.8 0 7 004 1 050.6 10 Nenas/ Pineapple 0 5 740 5.7 0 5 760 5.8 11 Pepaya/ Papaya 100 19 992 274.9 900 16 303 489.1 12 Pisang / Banana 200 23 044 345.7 3 685 27 664 415.0 13 Rambutan/Rambutan 0 16 776 209.7 10 11 928 716.9 14 S a l a k/ Zalaka 0 0 0.0 0 11 0.1 15 S a w o /Sapodillas 0 1 000 3.8 0 1 729 34.6 16 Sirsak /Soursop 0 14 264 82.0 0 12 347 185.2 17 Sukun /Breadfruit 0 7 880 69.0 0 7 151 536.2 18 P e t a i/ Petai 0 1 932 4.8 0 765 57.4 19 Melinjo /Melinjo 0 2 512 6.9 0 2 236 22.4 20 Jambu Air / Water Guava 0 33 416 108.6 0 16 303 489.1
Sumber : Dinas Pertanian Kota Bogor
Source : Department of Agriculture of Bogor City
(2) Pohon Ditanam/ Trees Planted Pohon Dipanen/ Trees Harvested Produksi/ Production (Ton) Jenis Tanaman/Type plant
2012 No Pohon Ditanam/ Trees Planted Pohon Dipanen/ Trees Harvested Produksi/ Production (Ton) Banyaknya Pohon Ditanam, Dipanen dan Produksi Tanaman Buah-buahan di Kota Bogor
Kota Bogor Dalam Angka/Bogor City in Figures 2013
235
Tabel 5.11
Table Area, Harvested Area and Production of Medicinal Plant by Kind
2013
(1) (3) (4) (5) (6) (7) (8)
1 Jahe / Ginger 12 400 18 750 65.29 880 11 300 22.60
2 Laos / Galangal 1 200 32 800 114.55 1 325 4 300 12.90
3 Kencur /Aromatic Ginger 100 9 850 22.66 1 155 2 790 6.42
4 Kunyit / Turmeric 250 4 500 12.60 950 375 1.05
5 Lempuyang /Zingiber Aromaticum 250 2 750 6.33 685 100 0.23
6 Temulawak / Curcuma 0 7 937 174.61 390 2 600 5.72
7 Temuireng /Curcuma aeruginosa 0 701 1.68 0 0 0.00
8 Kapulaga / Capollaga 750 6 610 9.92 350 450 0.68
9 Kejibeling / Strobilanthes 0 17 400 34.80 0 170 0.34
10 Mengkudu / Pace 0 8 231 143.50 0 830 12.45
11 Temukunci /Fingerroots 0 2 375 5.23 0 800 1.76 12 Sambiloto /Green chiretta 1 500 1 800 3.60 830 1 050 2.10 13 Lidah buaya /Aloe vera 3 650 31 950 86.27 400 4 950 13.37 Sumber : Dinas Pertanian Kota Bogor
Source : Department of Agriculture of Bogor City
Luas Tanam, Luas Panen dan Produksi Tanaman Obat-obatan Menurut Jenis Tanaman
2012 2013
(2)
Jenis Tanaman/Type plant
Luas Panen/ Harvested Area (m2) Luas Tanam/ Area (m2) Luas Tanam/ Area (m2) Luas Panen/ Harvested Area (m2) Produksi/ Production (ton) Produksi/ Production (ton) No
236
Kota Bogor Dalam Angka/Bogor City in Figures 2013
Tabel 5.12
Table The Number of Ornamental Plants, Planted, Harvested and Production of Ornamental Plants in Bogor City
2012
(1) (3) (4) (5) (6) (7) (8)
1 Anggrek/Orchid 4450 37350 448200Tangkai/stalk 8953 2546 30552
2 Anthurium/ 1600 7300 73000Tangkai/stalk 0 0 0
3 Anyelir/ Carnatin 0 12494 174916Tangkai/stalk 0 0 0
4 Gerbera (Herbas)/ 0 11990 179850Tangkai/stalk 0 200 3000
5 Gladiol/Gladiole 6050 29510 442650Tangkai/stalk 0 1580 23700
6 Heliconia/Heliconia 200 24650 295800Tangkai/stalk 2113 9786 117432
7 Krisan / 0 7868 251776Tangkai/stalk 0 968 30976
8 Mawar / Rose 550 26850 295350Tangkai/stalk 1584 2715 29865
9 Sedap Malam/ Tuberose 500 20100 241200Tangkai/stalk 4740 1466 17592
10 Dracaena / 0 16500 330000pohon/tree 5000 1100 22000
11 Melati / Jasmine 0 10170 193230Kg 0 273 5187
12 Palem / Palm 0 1750 2625pohon/tree 2830 2548 3822
13 Aglonema /Aglaonema 50 0 0pohon/tree 0 0 0
14 Adenium / 0 900 22500pohon/tree 350 0 0
15 Euphorbia / 0 3200 80000pohon/tree 0 700 17500
16 Phylodendron/ 2700 8620 215500pohon/tree 2000 0 0
17 Pakis / 0 1700 42500pohon/tree 0 0 0
18 Montera /Manteen 0 3700 9250pohon/tree 0 330 825
19 Soka (ixora)/ 0 3600 90000pohon/tree 200 200 5000
20 Cordyline / 8300 90800 908000pohon/tree 1600 2700 27000
21 Diffenbahia / 400 2750 68750pohon/tree 150 200 5000
22 Sansiviera/ 4950 31685 506960Rmpun/clump 0 750 12000
23 Anthurium Daun/ 650 4450 106800pohon/tree 640 1077 25848
24 Caladium/ 0 3310 52960pohon/tree 0 725 11600
Sumber : Dinas Pertanian Kota Bogor
Source : Department of Agriculture of Bogor City
(2)
Banyaknya Tanaman Hias yang Ditanam, Dipanen dan Produksi Tanaman Hias di Kota Bogor
2012 2013 Luas Tanam/ Area (m2) Luas Panen/ Harvested Area (m2) Produksi/ Production Satuan Pproduksi/ Production unit Luas Tanam/ Area (m2) Luas Panen/ Harvested Area (m2) Produksi/ Production Jenis Tanaman/Type Plant No
Kota Bogor Dalam Angka/Bogor City in Figures 2013
237
Tabel 5.13
Table Number of Farmer Groups by Subdistricts in Bogor City
2013 (1) (3) (4) (5) (6) (7) (8) 010 Bogor Selatan 17 377 38 796 4 94 020 Bogor Timur 9 184 10 206 0 0 030 Bogor Utara 10 211 10 188 0 0 040 Bogor Tengah 10 222 5 115 1 17 050 Bogor Barat 31 280 15 663 1 27 060 Tanah Sareal 12 211 20 319 0 0 Jumlah/Total 2013 89 1 485 98 2 287 6 138 2012 54 1 171 81 2 158 6 121 2011 54 1 271 81 2 158 6 121
Sumber : Dinas Pertanian Kota Bogor
Source : Department of Agriculture of Bogor City
(2)
Banyaknya Kelompok Tani di Kota Bogor Menurut Kecamatan
No Kecamatan/
Subdistricts
Wanita Tani/ Women
Farmer
Tani Dewasa/Mature
Farmer
Taruna Tani/ Cadets
Farmer Kelompok Tani/ Farmer Groups Anggota/ Member Kelompok Tani/Farme r Groups Anggota/ Member Kelompok Tani/Farmer Groups Anggota/ Member
238
Kota Bogor Dalam Angka/Bogor City in Figures 2013
Tabel 5.14
Table Population of Livestock and Poultry by Subdistricts in Bogor City
2013 (1) (3) (4) (5) (6) (7) (8) (9) (10) (11) (12) 010 Bogor Selatan 283 43 104 23 303 2 774 32 227 0 138 381 1 141 020 Bogor Timur 8 9 2 0 22 1 406 8 191 0 0 702 030 Bogor Utara 15 18 0 0 18 4 921 21 924 0 14 955 1 320 040 Bogor Tengah 6 56 0 0 0 29 14 364 0 0 513 050 Bogor Barat 29 20 46 18 72 1 849 34 993 0 15 200 895 060 Tanah Sareal 533 66 29 14 883 1 115 20 164 2 000 37 060 653 Jumlah/Total 2013 874 212 181 55 1 298 12 094 131 863 2 000 205 596 5 224 2012 857 222 187 76 1 163 8 948 201 890 408 180 250 3 583 2011 833 331 202 90 2 111 11 107 231 441 600 218 500 1 512
Sumber : Dinas Pertanian Kota Bogor
Source : Department of Agriculture of Bogor City
Kerbau/ Buffalo Kuda/ Horse Kambin g/Goat Domba/ Sheep Ayam Kampung/ Local Hen Ayam Ras Petelur/ Laying Chiken Ayam Ras Pedaging/ Broiler
Populasi Ternak dan Unggas Menurut Kecamatan
(2) No Kecamatan/ Subdistricts Sapi Perah/ Dairy Cow Sapi Potong /Cattle Cow Itik/ Ducks
Kota Bogor Dalam Angka/Bogor City in Figures 2013
239
Tabel 5.15 Banyaknya Rumahtangga Pemelihara Ternak dan Unggas Menurut Kecamatan
Table Number of Households Keepers Livestock and Poultry by Subdistricts
#### (1) (3) (4) (5) (6) (7) (8) (9) (10) (11) 010 Bogor Selatan 41 24 3 63 418 2 772 0 28 166 020 Bogor Timur 1 1 0 2 196 862 0 0 100 030 Bogor Utara 3 0 0 4 383 762 0 5 213 040 Bogor Tengah 1 0 0 0 3 1 149 0 0 142 050 Bogor Barat 4 21 5 6 202 3 252 0 3 153 060 Tanah Sareal 50 21 35 28 140 1 935 1 8 87 Jumlah/Total 2013 100 67 43 103 1 342 10 732 1 44 861 2012 129 84 6 163 1 090 6 655 3 51 986 2011 331 202 90 2 111 11 107 231 441 600 218 1 512
Sumber : Dinas Pertanian Kota Bogor
Source : Department of Agriculture of Bogor City
Ayam Ras Petelur/ Laying Chiken Ayam Ras Pedaging/ Broiler Itik/ Ducks Ayam Kampung/ Local Hen (2) No Kecamatan/ Subdistricts Sapi Potong /Cattle Cow Kerbau/ Buffalo Kuda/ Horse Kambing/ Goat Domba/ Sheep
240
Kota Bogor Dalam Angka/Bogor City in Figures 2013
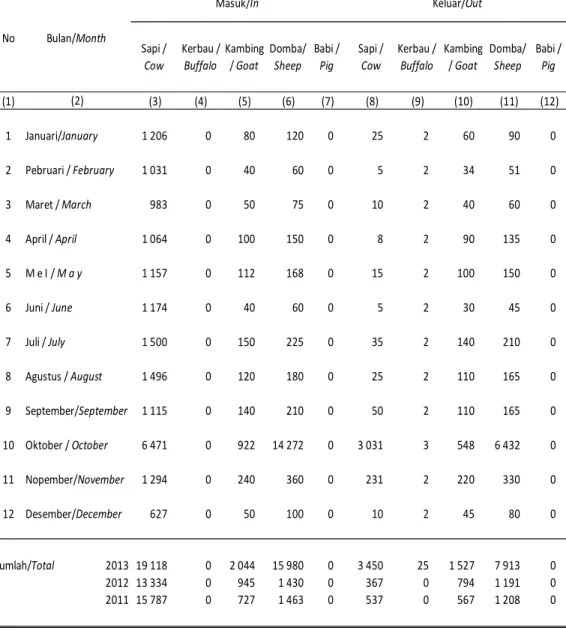
Tabel 5.16 Banyaknya Ternak yang Masuk dan Keluar dari Kota Bogor Menurut Jenis Ternak
Table Number of Livestock In and Out of The City of Bogor by Type of Livestock
2013 (1) (3) (4) (5) (6) (7) (8) (9) (10) (11) (12) 1 Januari/January 1 206 0 80 120 0 25 2 60 90 0 2 Pebruari / February 1 031 0 40 60 0 5 2 34 51 0 3 Maret / March 983 0 50 75 0 10 2 40 60 0 4 April / April 1 064 0 100 150 0 8 2 90 135 0 5 M e I / M a y 1 157 0 112 168 0 15 2 100 150 0 6 Juni / June 1 174 0 40 60 0 5 2 30 45 0 7 Juli / July 1 500 0 150 225 0 35 2 140 210 0 8 Agustus / August 1 496 0 120 180 0 25 2 110 165 0 9 September/September 1 115 0 140 210 0 50 2 110 165 0 10 Oktober / October 6 471 0 922 14 272 0 3 031 3 548 6 432 0 11 Nopember/November 1 294 0 240 360 0 231 2 220 330 0 12 Desember/December 627 0 50 100 0 10 2 45 80 0 Jumlah/Total 2013 19 118 0 2 044 15 980 0 3 450 25 1 527 7 913 0 2012 13 334 0 945 1 430 0 367 0 794 1 191 0 2011 15 787 0 727 1 463 0 537 0 567 1 208 0
Sumber : Dinas Pertanian Kota Bogor
Source : Department of Agriculture of Bogor City
Masuk/In Keluar/Out No Bulan/Month Sapi / Cow Kerbau / Buffalo (2) Kambing / Goat Babi / Pig Sapi / Cow Kerbau / Buffalo Kambing / Goat Babi / Pig Domba/ Sheep Domba/ Sheep
Kota Bogor Dalam Angka/Bogor City in Figures 2013
241
Tabel 5.17 Banyaknya Ternak yang Dipotong di Kota Bogor Menurut Jenis Ternak
Table Number of Cattle Slaughtered in The City of Bogor by Type of Livestock
2013 (1) (3) (4) (5) (6) (7) (8) 1 Januari/January 1 163 0 0 20 240 0 2 Pebruari / February 1 029 0 0 6 72 0 3 Maret / March 965 0 0 10 120 0 4 April / April 1 065 0 0 10 120 0 5 M e I / M a y 1 161 0 0 12 144 0 6 Juni / June 1 126 0 0 10 120 0 7 Juli / July 1 422 0 0 10 120 0 8 Agustus / August 1 443 0 0 10 120 0 9 September/September 917 0 0 30 360 0 10 Oktober / October 3 265 1 0 552 6 376 0 11 Nopember/November 1 118 0 0 20 240 0 12 Desember/December 1 056 0 0 5 160 0 Jumlah/Total 2013 15 730 1 0 695 8 192 0 2012 14 653 55 0 1 123 6 856 0 2011 16 943 10 0 3 021 22 655 0
Sumber : Dinas Pertanian Kota Bogor
Source : Department of Agriculture of Bogor City
(2)
Sapi / Cow Kerbau /
Buffalo Kuda/ Horse Kambing / Goat Domba/
Sheep Babi / Pig
Bulan/Month No
242
Kota Bogor Dalam Angka/Bogor City in Figures 2013
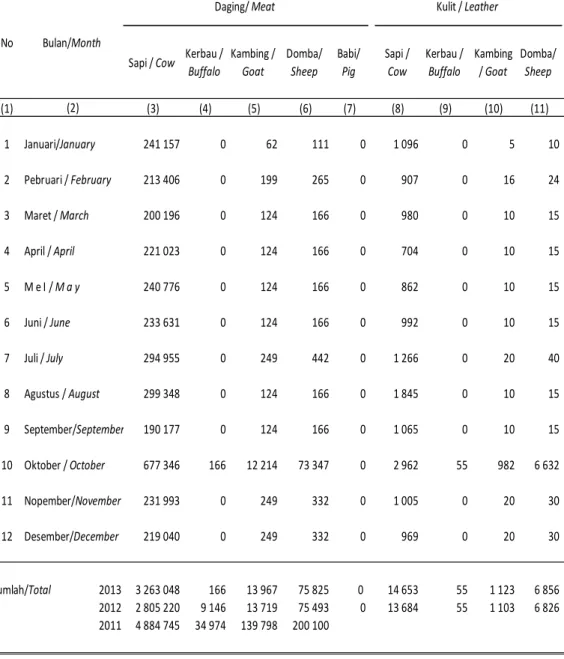
Tabel 5.18 Produksi Daging dan Kulit Menurut Jenis Ternak
Table Production of Meat and Leather by Type of Livestock
2013 (1) (3) (4) (5) (6) (7) (8) (9) (10) (11) 1 Januari/January 241 157 0 62 111 0 1 096 0 5 10 2 Pebruari / February 213 406 0 199 265 0 907 0 16 24 3 Maret / March 200 196 0 124 166 0 980 0 10 15 4 April / April 221 023 0 124 166 0 704 0 10 15 5 M e I / M a y 240 776 0 124 166 0 862 0 10 15 6 Juni / June 233 631 0 124 166 0 992 0 10 15 7 Juli / July 294 955 0 249 442 0 1 266 0 20 40 8 Agustus / August 299 348 0 124 166 0 1 845 0 10 15 9 September/September 190 177 0 124 166 0 1 065 0 10 15 10 Oktober / October 677 346 166 12 214 73 347 0 2 962 55 982 6 632 11 Nopember/November 231 993 0 249 332 0 1 005 0 20 30 12 Desember/December 219 040 0 249 332 0 969 0 20 30 Jumlah/Total 2013 3 263 048 166 13 967 75 825 0 14 653 55 1 123 6 856 2012 2 805 220 9 146 13 719 75 493 0 13 684 55 1 103 6 826 2011 4 884 745 34 974 139 798 200 100
Sumber : Dinas Pertanian Kota Bogor
Source : Department of Agriculture of Bogor City
Domba/
Sheep
Sapi / Cow Kerbau /
Buffalo Kambing / Goat Domba/ Sheep Babi/ Pig Sapi / Cow Kerbau / Buffalo Kambing / Goat Kulit / Leather (2) Bulan/Month Daging/ Meat No
Kota Bogor Dalam Angka/Bogor City in Figures 2013
243
Tabel 5.19 Hasil Pemeriksaan Susu di Laboratorium
Table Results in the Laboratory Examination of Milk
2013 (1) (4) (5) (6) (7) (8) (9) 1 Januari/January - - 1 - - - -2 Pebruari / February 6 2 - - 2 2 -3 Maret / March 3 1 - - 2 - -4 April / April 6 2 - - 3 1 -5 M e I / M a y 3 1 - - 2 - -6 Juni / June 4 1 1 - 1 1 -7 Juli / July 3 1 - - 2 - -8 Agustus / August 6 2 - - 4 - -9 September/September 3 1 - - 2 - -10 Oktober / October 3 1 - - 1 1 -11 Nopember/November 5 1 - - 3 1 -12 Desember/December 3 1 - - 2 - -Jumlah/Total 2013 45 14 2 - 24 6 -2012 96 51 9 - 36 - -2011 36 12 - - 22 1 1
Sumber : Dinas Pertanian Kota Bogor
Source : Department of Agriculture of Bogor City
(3) Baik/ Good Cukup/ Enough Buruk/ Bad
Susunan Air Susu/
Composition of Breast Milk
Kondisi Air Susu/Conditions of Milk Baik/ Good Cukup/ Enoug Buruk/ Bad
Hasil Pemeriksaan/ Examination Results
No Bulan/Month (2) Jumlah contoh yang Diperiksa / Number of Samples Examined
244
Kota Bogor Dalam Angka/Bogor City in Figures 2013
Tabel 5.20 Jumlah Orang yang Digigit Anjing, Banyaknya Pengamatan Terhadap Anjing yang Menggigit dan Vaksinasi
Table serta Eliminasi Rabies per Bulan di Kota Bogor / Number of People Bitten by Dogs, Many Observations of
The Dog Bite and Rabies Vaccination and Elimination per Month in Bogor Municipality
2012 (1) (5) (6) (7) (8) (9) 1 Januari/January 1 - - 1 1 0 -2 Pebruari / February - - - - - 0 -3 Maret / March - - - - - 0 -4 April / April 1 - - 1 1 0 -5 M e I / M a y - - - - - 0 -6 Juni / June - - - - - 160 -7 Juli / July - - - - - 200 -8 Agustus / August - - - - - 200 -9 September/September - - - - - 200 -10 Oktober / October - - - - - 120 -11 Nopember/November - - - - - 120 -12 Desember/December - - - - - 0 -Jumlah/Total 2013 2 0 0 2 2 1 000 0 2012 1 0 0 1 1 1 003 0 2011 0 0 0 0 0 556 0
Sumber : Dinas Pertanian Kota Bogor
Source : Department of Agriculture of Bogor City
(4) No Bulan/Month Vaksinasi/ Vaccination Eliminasi/ Elimination (2) Jumlah Orang yang Digigit/ Number of People Bitten (3) Tanpa Observasi/ Without Observation Mati/ Dead Bebas/ Free
Anjing Yang Menggigit/Tersangka /
Dogs that bite / Suspect
Observasi/ Observation Jumlah/
Kota Bogor Dalam Angka/Bogor City in Figures 2013
245
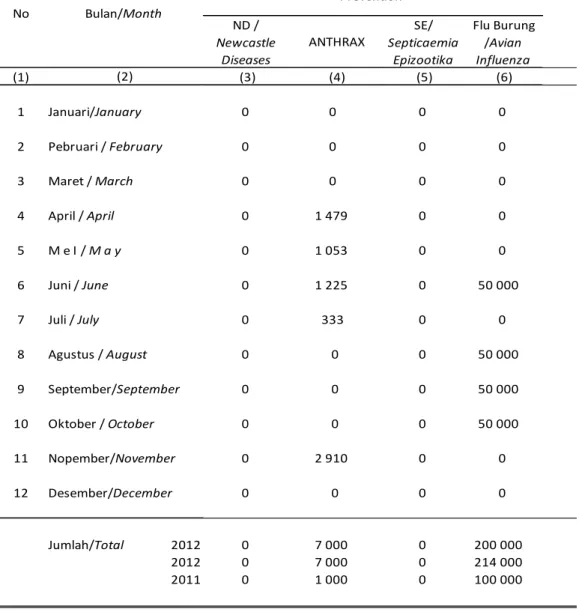
Tabel 5.21 Banyaknya Vaksinasi/Pencegahan Penyakit Ternak/Unggas Menurut Jenis Vaksin
Table Number of Vaccination/Disease Prevention of Livestock/Poultry by Type of Vaccine
2012 (1) (3) (4) (5) (6) 1 Januari/January 0 0 0 0 2 Pebruari / February 0 0 0 0 3 Maret / March 0 0 0 0 4 April / April 0 1 479 0 0 5 M e I / M a y 0 1 053 0 0 6 Juni / June 0 1 225 0 50 000 7 Juli / July 0 333 0 0 8 Agustus / August 0 0 0 50 000 9 September/September 0 0 0 50 000 10 Oktober / October 0 0 0 50 000 11 Nopember/November 0 2 910 0 0 12 Desember/December 0 0 0 0 Jumlah/Total 2012 0 7 000 0 200 000 2012 0 7 000 0 214 000 2011 0 1 000 0 100 000
Sumber : Dinas Pertanian Kota Bogor
Source : Department of Agriculture of Bogor City
No Bulan/Month
(2)
Vaksin/Pencegahan Penyakit / Vaccine / Disease
Prevention ND / Newcastle Diseases Flu Burung /Avian Influenza ANTHRAX SE/ Septicaemia Epizootika
246
Kota Bogor Dalam Angka/Bogor City in Figures 2013
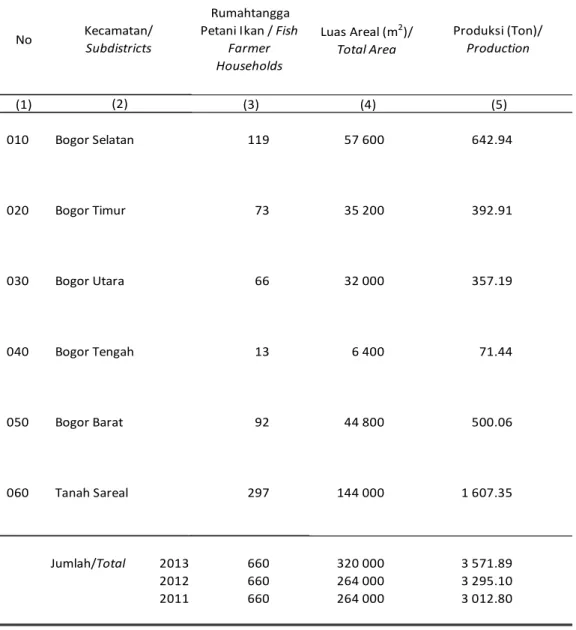
Tabel 5.22 Banyaknya Rumahtangga Petani, Luas dan Produksi Ikan Kolam Air Tenang
Table The Number of Farm Households, Spacious and Calm Water Pond Fish Production
2012 (1) 010 Bogor Selatan 119 57 600 642.94 020 Bogor Timur 73 35 200 392.91 030 Bogor Utara 66 32 000 357.19 040 Bogor Tengah 13 6 400 71.44 050 Bogor Barat 92 44 800 500.06 060 Tanah Sareal 297 144 000 1 607.35 Jumlah/Total 2013 660 320 000 3 571.89 2012 660 264 000 3 295.10 2011 660 264 000 3 012.80
Sumber : Dinas Pertanian Kota Bogor
Source : Department of Agriculture of Bogor City
No Kecamatan/
Subdistricts
Rumahtangga Petani Ikan / Fish
Farmer Households Luas Areal (m2)/ Total Area Produksi (Ton)/ Production (2) (3) (4) (5)
Kota Bogor Dalam Angka/Bogor City in Figures 2013
247
Tabel 5.23 Banyaknya Rumahtangga Petani, Luas dan Produksi Ikan Kolam Air Deras
Table Number of Farm Household, Widespread and The Productionof Heavy Water Fish Pond
2013 (1) 010 Bogor Selatan - - -020 Bogor Timur 40 700.00 620.11 030 Bogor Utara - - -040 Bogor Tengah - - -050 Bogor Barat - - -060 Tanah Sareal - - -Jumlah/Total 2013 40 700.00 620.11 2012 40 664.20 582.96 2011 40 664.20 518.83
Sumber : Dinas Pertanian Kota Bogor
Source : Department of Agriculture of Bogor City
(2)
Rumahtangga Petani Ikan / Fish Farmer
Households Luas Areal (m2)/ Total Area Produksi (Ton)/ Production (3) (4) (5) No Kecamatan/ Subdistricts
248
Kota Bogor Dalam Angka/Bogor City in Figures 2013
Tabel 5.24 Banyaknya Rumahtangga Petani Ikan Sawah, Luas Areal dan Produksi Ikan
Table Number of Households in Rice Field Fish Farmer , Acreage and The Production of Fish
2013 (1) 010 Bogor Selatan 4 8 000 8.02 020 Bogor Timur - - -030 Bogor Utara - - -040 Bogor Tengah - - -050 Bogor Barat 6 12 000 12.02 060 Tanah Sareal - - -Jumlah/Total 2013 10 20 000 20.04 2012 120 1 200 18.60 2011 120 1 200 17.40
Sumber : Dinas Pertanian Kota Bogor
Source : Department of Agriculture of Bogor City
No Kecamatan/
Subdistricts
(2)
Rumahtangga Petani Ikan / Fish
Farmer Households Luas Areal (m2)/ Total Area Produksi (Ton)/ Production (3) (4) (5)
Kota Bogor Dalam Angka/Bogor City in Figures 2013
249
Tabel 5.25 Banyaknya Rumahtangga Petani Ikan (Karamba), Luas Areal dan Produksi Ikan
Table Number of Farmer Households of Fish Cage , Acreage and The Production of Fish
2013 (1) 010 Bogor Selatan 22 1 080 4.67 020 Bogor Timur 13 660 2.86 030 Bogor Utara 12 600 2.60 040 Bogor Tengah 2 120 0.52 050 Bogor Barat 17 840 3.64 060 Tanah Sareal 54 2 700 11.69 Jumlah/Total 2013 120 6 000 25.98 2012 120 1 200 24.20 2011 120 1 200 22.70
Sumber : Dinas Pertanian Kota Bogor
Source : Department of Agriculture of Bogor City
Kecamatan/
Subdistricts
(2)
Rumahtangga Petani Ikan / Fish
Farmer Households Luas Areal (m2)/ Total Area Produksi (Ton)/ Production (3) (4) (5) No