See discussions, stats, and author profiles for this publication at: https://www.researchgate.net/publication/308968109
Residual Stress on K-Area of Link Element Using Neutron Diffraction Method
Conference Paper · September 2016
CITATIONS
0
READS
126
5 authors, including:
Some of the authors of this publication are also working on these related projects:
Application of Seismic Devices for Core Frames of High-rise BuildingsView project
Residual stress on link element using neutron diffraction methodView project Bambang Budiono
Bandung Institute of Technology
36PUBLICATIONS 108CITATIONS
SEE PROFILE
Kurdi Zamzami
Bandung Institute of Technology
9PUBLICATIONS 4CITATIONS
SEE PROFILE
Muslinang Moestopo Bandung Institute of Technology 18PUBLICATIONS 15CITATIONS
SEE PROFILE
Dyah Kusumastuti
Bandung Institute of Technology 24PUBLICATIONS 49CITATIONS
SEE PROFILE
All content following this page was uploaded by Kurdi Zamzami on 10 October 2016.
ScienceDirect
Procedia Engineering 00 (2017) 000–000
www.elsevier.com/locate/procedia
1877-7058 © 2017 The Authors. Published by Elsevier Ltd.
Peer-review under responsibility of the organizing committee of SCESCM 2016.
Sustainable Civil Engineering Structures and Construction Materials, SCESCM 2016
Residual Stress on K-Area of Link Element Using Neutron
Diffraction Method
Bambang Budiono
a, Kurdi
b, Muslinang Moestopo
a, Dyah Kusumastuti
a, M. Refai
Muslih
caStructural Engineering Group of Expertise, Civil Engineering Study Programme, Faculty of Civil and Environmental Engineering - Institut
Teknologi Bandung, Jl. Ganesa No.10 Bandung 40132
bDoctoral Programme of Structural Engineering Group of Expertise, Faculty of Civil and Environmental Engineering - Institut Teknologi
Bandung E-mail: [email protected] (Corresponding author)
cCenter for Science and Technology of Advanced Materials (PSTBM) –BATAN Nuclear Complex, Puspitek Serpong, Tangerang 15314 E-mail:
Abstract
This research focused on the experimental study on the residual stress magnitude and distribution resulted from the welding process in and around the k area, stiffener joint, web and flange plates of link element. The measurement was done with the Neutron Diffraction Method using the Neutron Diffractometer DN1-M PSTBM BATAN. A number of 15 points with 45 measurement directions were conducted on the k area in normal, transversal and longitudinal directions. The result of the experiment showed 185 Mpa and 160 Mpa residual stress magnitude in longitudinal and transversal directions in the same directions with the weld toe welding between the web and flange with the extent of the stress region 8 times of the flange thickness. The perpendicular welding of the weld toe resulted in 162 Mpa and 145 Mpa residual stress in longitudinal and transversal directions with 4 times of the extent of stress region from the flange thickness. The residual stress magnitude and the width of stress region indicated the k area as a vulnerable area to the initial crack occurrence which may decrease the link performance. Creating a welding gap 4 to 5 times of the flange between the stiffener and the flange may increase the link performance because it may minimize the residual stress magnitude and distribution.
© 2017 The Authors. Published by Elsevier Ltd.
Peer-review under responsibility of the organizing committee of SCESCM 2016.
Keywords: K-area, Residual stress, Link, Stiffener, Neutron Diffraction.
1.Introduction
2 Author name / Procedia Engineering 00 (2017) 000–000
as set forth by the regulation of AISC 341-10 [3]. The research on increasing link performances have been intensively studied such as the addition of web stiffener to avoid buckling [15], the type of joint between the link and column [13,14], replaceable link [11] and the distance of web stiffener and the loading pattern [10,15,17] the addition of diagonal stiffener [10] and built up link [12].
Based on the previous research results, the performance of a link is determined by several significant parameters, such as: section parameters, which include the thinness value of the flange and web, the web stiffener parameters, which include the thickness of stiffener and the distance of stiffener. AISC 341-10 [3] has regulated the use of web stiffener on the link, such regulations include: regulations on the distance of stiffener, the thickness of stiffener, “k” area and its relation to the length of link. These regulations were adopted from research results conducted in the University of California Berkeley [6,4, 7, 10] that are still valid until now.
The crack phenomenon on the link element occurred on the web or flange area. The crack occurred on the “k”
area which is a joint between the vertical stiffener, web and flange, or failures that occurred on the web near the stiffener or also known as the Heat Affected Zone (HAZ) that was not only experienced by the intermediate and long link (flexure) but also on the short link (shear link). This phenomenon can be seen in Figure 1.
Fig. 1 The failure of the “karea” of link [12]
Early indication of numerical or experimental showed that this phenomenon was caused by the residual stress of the welding that posed the hydrostatic stress effect on the HAZ area which caused the failure (fracture). This phenomena resulted in the inelastic rotation capacity of the link element cannot be achieved as required in AISC 341-10 for as much as 0.08 rad for the shear link. The residual stress magnitude and distribution of the link element on EBFS has not been studied in depth by previous researchers, the research were focused more on the T-joint [ 5,16], the joint between plates [15] or the tube joint [1]. Therefore this research is focused to study the magnitude and distribution of the residual stress caused by the welding process on the k area that caused the initial crack occurrence.
Several existing techniques to evaluate the residual stress such as sectioning, layer removal, hole-drilling, X-ray etc. have limitations on the depth of measurements and or most of the methods are destructive methods. This research used non-destructive method with the neutron diffraction technique. Since it has no electric charge, neutron easily interacts with the atomic nucleus of the materials and easily passes through it until several centimeters; these unique properties allow the directions of residual stress measurement to be set as desired. Several researchers also have used this method to measure the residual stresses [1,8,9,15,18,20].
2.Literature review
difference of diffraction angles between the stressed and stress-free samples. By deriving the Bragg equation, the equation below will be obtained:
(1)
The neutron diffraction is resulted from the neutron ray with constant wavelengths. The lattice distances were
measured by observing the position of the diffracted neutron using the Bragg equation =2d sin . The strain can be
calculated by comparing the lattice distance with the measured stressed and stress-free materials.
The Bragg Peak will be produced out of neutron diffraction as the neutrons with a certain wavelength hit the gap between the crystal materials. If wavelength and diffraction angles have been obtained then the gap between the crystal planes with respect to Miller index can be measured according to the Bragg law using the equation as depicted in Figure 3:
(2)
Where is the used wavelength, is the distance between planes with Miller index, h, k, l, dan is half of the
neutron diffraction angle
The determination of the position of neutron diffraction angle was done with great accuracy considering the minute difference of the diffraction positions. The peak was determined with the Gauss distribution calculated using the Origin 9 software. One of the fitting results from the measurements is shown in Figure 4.
Fig. 3. The Bragg law Fig. 4. The Gauss fitting curve
Meanwhile the equation of the Gauss distribution is as follows:
[ ( )] (3)
Where:
Y = intensity
= background number A = amplitude
= width of the curve centre that indicated the accuracy of the background number = peak angle position
Furthermore the stress value can be calculated in 3 directions using the following equation:
( ){
( )( )} Where ( )
3.Experimental Study of Sample Specifications
4 Author name / Procedia Engineering 00 (2017) 000–000
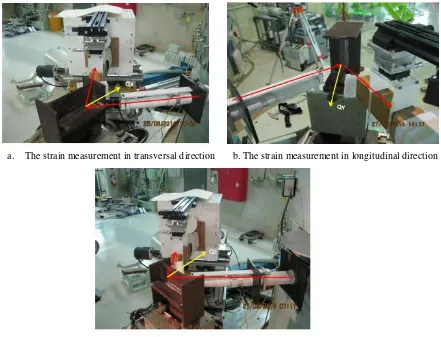
research was calculated in 3 directions that were named normal, transversal and longitudinal directions. Meanwhile the point locations were named x, y, and z directions. The measurement was done in normal, transversal and longitudinal directions parallel with the welding between the stiffener and web 5 mm from the weld toe and perpendicular on the welding between the stiffener and flange as far as 10 mm.
A number of 15 points with 45 measurement directions in transversal, longitudinal or normal directions were conducted measurements where 5 points were measured in x direction with each directions of 5 mm, 15 mm, 20 mm and 10 mm from point 1 that was the end of k area from the web. Furthermore 5 points were measured in y direction with each distance of 5, 2, 10 and 20 mm an in z direction as many as 3 points with distances of 6, 5 and 12 mm. The measurement was done on the centre of the web or flange thickness. Each of the points was measured in normal, transversal or longitudinal with the measurement directions as shown in Figure 5.
Fig. 5. The directions of sample measurement
4. Experiment Results and Discussion
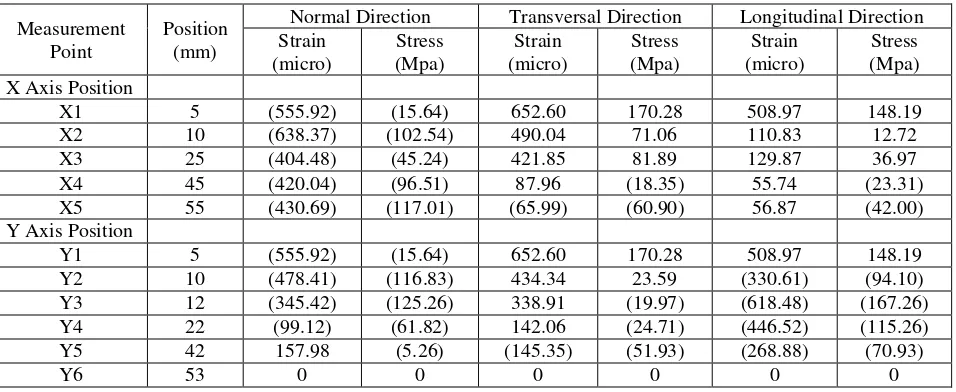
Using the equation 4 and the taken E 211 value was 2.10 Mpa and v 211 of 0.3 then the residual stress obtained is shown in Table 1.
4.1 The measurement in the direction of X Axis
4.1.1 Magnitude and distribution residual stress in transversal direction
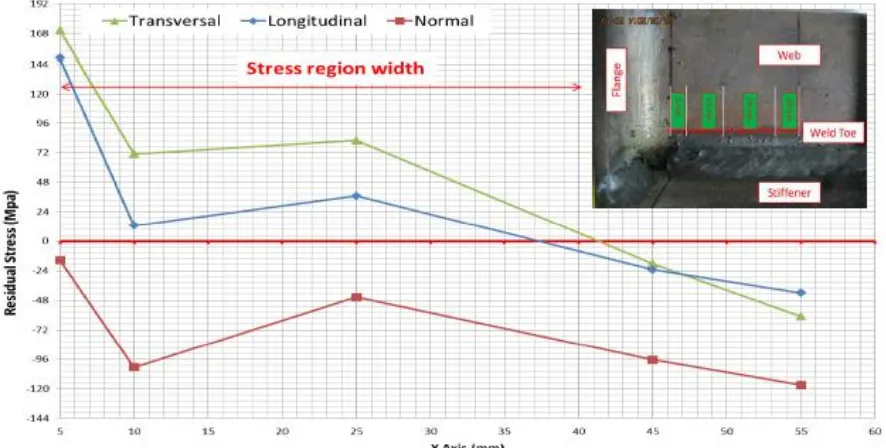
According to Table 1, the relation graph was further made between the residual stress and the position of the web ends welding as shown in Figure 6. The residual stress in transversal direction was very high around the k area and
a. The strain measurement in transversal direction b. The strain measurement in longitudinal direction
converted into the residual stress as it moved away from the k area or perpendicular from the weld toe welding between the stiffener and flange.
Table 1. The residual stress value in normal, transversal and longitudinal direction
Measurement Point
Position (mm)
Normal Direction Transversal Direction Longitudinal Direction
Strain
The value of the highest residual stress was obtained on point 1 as in the Figure 8 as much as 170.28 Mpa or 53.55% from the yield stress (fy). The smaller value of 71.06 Mpa was obtained on the position of 20 mm parallel with the welding between the stiffener and the web (point 2). It increased until 10 Mpa on the point 3 or as much as 81.89 Mpa on the position of 40 mm from the weld toe of flange (point 3). On the distance of 35 mm from the point 2 or the position of 40 mm parallel with the y axis (longitudinal), the value of residual stress were 18.35 Mpa and 20.46 Mpa for each of the points 4 and 5.
The results of residual stress magnitude in the k area was likely caused by three factors, first, the influence of geometry which is not only the influence of the welding thickness between the stiffener (10 mm) and the flange (7 mm) but also the influence of the welding thickness between the stiffener and the web (5 mm). The second cause was the influence of the extent of k area particularly the length of k area on the web that is parallel with the welding between the stiffener and the web.
Figure 6 also showed a quite wide stress region of 35 mm or 0.46 times of the flange width value (bf), in other
words, the width was equal to 7 times of the web thickness (tw). The width of the stress region caused the k area to
6 Author name / Procedia Engineering 00 (2017) 000–000
Fig. 6. The curve of residual stress in X axis
The widening of the k area is amongst the ways to minimize the velocity of the occurring crack around the k area. The widening of the k area will decrease the magnitude of the residual stress and restrict the width of the stress region. The given value of AISC 341-10 [3] has to be re-adjusted considering that the ratio of the welding between the stiffener and the web and flange, and also the ratio of profile width and height that influenced the magnitude and distribution of the residual stress on the k area. In this research it was suggested that the width of the k area is 4 to 5 times of the width of the web for small flange width from 0,5 times of the profile height (bf = 0.5d) and the ratio
smaller than 3 between the stiffener with the web thickness.
4.1.2 The magnitude and distribution of the residual stress in longitudinal direction
According to Figure 7 and Table 1 a similar pattern was observed from the magnitude and the distribution of the residual stress between the measurements in transversal or longitudinal directions. The resulted value of residual stress was quite high on point 1 which was 148.19 Mpa. This value was 13% less than the value of the residual stress in transversal direction. The residual stress value was decreasing along with the greater distance from the weld toe of flange. In the position of 20 mm the residual stress value was 12 Mpa and increase a little as in the pattern of the measurement in transversal direction as much as 36 Mpa. Next, the tensile residual stress becomes compressive
residual stresswith the value of 23.31 Mpa on the point 3 and became stress on the point 4 with the value of 52.35
Mpa on the point 5.
The magnitude and distribution in the k area from the measurement in transversal or longitudinal directions showed that the crack occurred on the link element may decrease the link performance as the link cannot broadlydeform because of the crack that quickly developed to other area, so that the standard link performance cannot be achieved particularly the condition of the inelastic capacity of AISC 341-10 [3] was not fulfilled.
4.1.3 The magnitude and distribution of the residual stress in normal direction
directions that produced the residual stress or compressive residual stress. The value of compressive residual stress were 15.64; 102.54; 45.24; 96.51 and 76.57 Mpa for each of the measurements on the points 1, 2, 3, 4 and 5. Due to the compressive residual stress value as the results, so that it was not considered as a loss, but was rather beneficial to decrease the crack influence in the k area.
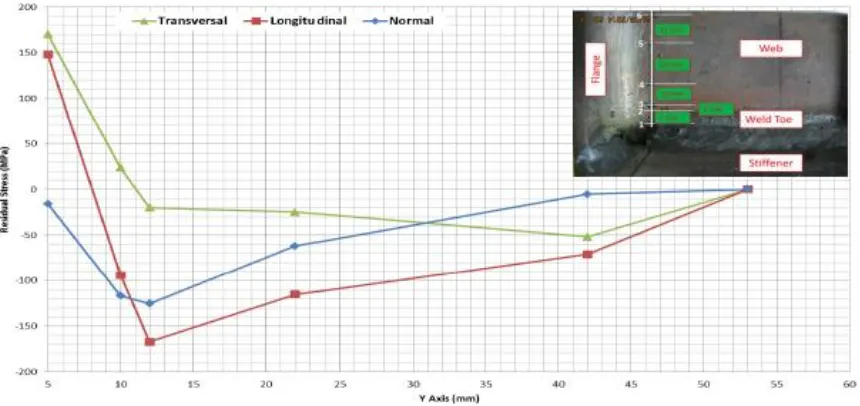
4.2 The measurement in the y axis
The magnitude and distribution of the residual stress in y direction has the stress or compressive region, except for the residual stress in normal direction in which all of them were compressive. The distribution pattern of residual stresses between the transversal and longitudinal direction were similar to the residual stress value reaching 170 and 148 Mpa for each of the directions.
Figure 7. The curve of residual stress in Y axis direction
The width of the resulted stress region was almost half of the stress region in x direction both for the residual stress on transversal and longitudinal directions. Next, the width of longitudinal stress region was half of the width of the transversal stress region. This was caused by the influence from the welding process between the stiffener and the web that overlapped with the welding of the stiffener and the flange. Considering the width of the stress region as in the point 3, this area is not vulnerable to the crack occurrence compared to the x axis measurement direction. The
highest value of residual stress was obtained on point 1 as far as 5 mm from the weld toe welding flange with the
value of 170 Mpa and 148 Mpa for longitudinal direction.
The cause of the magnitude and distribution of the residual stress was the same as in the x direction measurement, the real difference was the heat value and the cooling process that was different depended on the welding length. The value of the longitudinal residual stress was smaller along with greater distance of the welding from the weld.
Conclusion
The results of measurement conducted using the neutron diffraction method produced several conclusions as follows:
1. The magnitude and distribution of the residual stress on the link element may be measured accurately using the
8 Author name / Procedia Engineering 00 (2017) 000–000
2. The measurement was resulted in similar magnitude and distribution of residual stress between the transversal
and longitudinal directions. A high residual stress was obtained around the k area near the weld toe welding between the stiffener–web-flange with the value of 170 Mpa for transversal direction and 140 Mpa in longitudinal direction. The high value of residual stress and the resulted width of the stress region reached seven times of the web thickness indicated that the k area is vulnerable to the failure of crack that may decrease the link performance.
3. The widening of the k area is amongst the way to minimize the quick process of crack that occurred around the
k area. Widening the k area will cause a decrease in the magnitude of stress and restrict the width of stress region.
Acknowledgments
The author would like to express his gratitude to Mr. Drs. Gunawan, M.Sc as the Head of the Center of Science of
Technology of Advanced Material (PSTBM) BATAN whom granted the permission for the measurement at
PSTBM, also to Mr. Drs. Sutiarso, M.Sc as the Head of the Department of Neutron Ray Technology whom gave support, suggestion and permission in the usage of the tool DN1-M.
References
[1] C. Acevedo, J.M. Drezet J.P. Lefebre, L. D’Avise, A. Nussbaumer, Residual stresses in as-welded joints: finite element modeling and neutron diffraction stress measurements, Key Engineering Materials Vol. 488-469 (2012) pp. 333-338.
[2] American Welding Society (AWS), Structural Welding Code-Steel (AWS D1.1), Miami, US, (2008). [3] American Institute of Steel Construction. , Seismic Provision for Structural Steel Buildings, AISC,Inc, (2010).
[4] M.D. Engelhardt, E.P. Popov, Experimental performance of long links in eccentrically braced frames, Journal of Structural Engineering. Vol.118 No.11 (1992) 3067-3088.
[5] C.K. Lee, S.P. Chiew, J.Jiang, Residual stress study of welded high strength steel plate-to-plate joints, part 1: experimental study, Thin-Walled Struct, 56 (2012):103–12.
[6] K.D. Hjelmstad, E.P. Popov, Characteristics of eccentrically braced frame, Journal of Structural Engineering. Vol. 110 No. 2 (1984) 340-353.
[7] K. Kasai, E.P. Popov, General behavior of WF steel shear link beams, Journal of the Structural Division.Vol.112 No.2 (1986) :362-382. No.2:362-382, February, ASCE.
[8] S.H. Kim, J.B. Kim, W.J. Lee, Numerical Prediction and Neutron Diffraction Measurement of Residual stresses For a Modified 9Cr-1Mo
Steel Weld”, Journal of Material Processing Technology, pp. 3905-3913.
[9] Kurdi, B. Budiono, M. Moestopo, D. Kusumastuti M.R. Muslih, Experimental analysis of residual stress magnitude and distribution on the link element of the eccentrically braced steel Frame structure (EBSF) with the neutron diffraction method, National Conference of Masters of Civil Engineering, Bandung, 2014 (in Indonesian).
[10] J.O. Malley , E.P. Popov, Shear links in eccentrically braced frames, Journal of Structural Engineering, ASCE, vol. 109, no. 10 (1983). [11] M. Moestopo, D. Kusumastuti, A. Novan, Improved performance of bolt-connected link due to cyclic load, Jakarta: International
Conference on Earthquake Engineering and Disaster Mitigation (2008).
[12] M. Moestopo, M.A.R. Panjaitan, Experimental analysis of the performance improvements of shear link on the eccentrically braced steel frame structure, Jurnal Teknik Sipil Institut Teknologi Bandung. Vol.19 No.2 (2012) (in Indonesian).
[13] T. Okazaki, G. Arce,H.C. Ryu, M.D. Engelhardt, Experimental study of local buckling, over strength, and fracture of links in eccentrically braced frames, Journal of Structural Engineering. (2005) 1526-1535.
[14] T. Okazaki, M.D. Engelhardt, A. Drolias, E. Schell, J.K. Hong, C.M. Uang, Experimental investigation of link-to-column connections in eccentrically braced frames, Journal of Constructional Steel Research. 65 (7) (2009) pp. 1401-1412.
[15] M.J. Park, H.N. Yang, D.Y. Jang, J.S. Kim, T.E. Jin, Residual stress measurement on welded specimen by neutron diffraction, Journal of Material Processing Technology. pp155-156 (2004).
[16] M. Peric, Z. Tonkovic, A. Rodic, M. Surjak, I. Garašic, I. Boras, S. Švaic, Numerical analysis and experimental investigation of welding residual stresses and distortions in a T-joint fillet weld,, Materials and Design. 53 (2013) pp. 1052–1063.
[17] P.W. Richards, C.M. Uang, Effect of flange width-thickness ratio on eccentrically braced frames link cyclic rotation capacity, J. Struct. Eng. (2005) 1546-1552.
[18] T. Suzuki, H. Oikawa, M. Imafuku, H. Suzuki, M. Sugiyama, T.Nose, Y. Tomota, A. Moriai, Residual stress measurement of welding area by neutron diffraction methode, Nippon Steel Technical Reports (2011).
[19] Yurisman, B. Budiono, M. Moestopo, S.Made, Behaviour of sLink of WF section with diagonal web stiffener eccentrically braced frame (EBF) of steel structure, Institut Teknologi Bandung Journal of Engineering Science . Vol. 42 No. 2 (2010).
[20] P.J. Webster, Spatial Resolution and Strain Scanning. Measurement of Residual and Applied Stresses using Neutron Diffraction (Eds. Hutchings, M.T. and Krawitz, A.D.), Kluwer Academic Publishers, Netherlands, (1992) 235-251.
![Fig. 1 The failure of the “k area” of link [12]](https://thumb-ap.123doks.com/thumbv2/123dok/4035426.1978846/3.544.48.503.243.366/fig-failure-k-area-link.webp)