March 2018
VOL.16 NO.1
print ISSN: 2234-8255 online ISSN: 2234-8883 http://jicce.org
Aims and Scope
Journal of Information and Communication Convergence Engineering (J. Inf. Commun. Converg. Eng., JICCE) is an of-ficial English journal of the Korea Institute of Information and Communication Engineering (KIICE). It is an international, peer reviewed, and open access journal that is published quarterly in March, June, September, and December. Its objective is to provide rapid publications of original and significant contribu-tions and it covers all areas related to information and com-munication convergence engineering including the following areas: Communication System and Applications, Networking and Services, Intelligent Information System, Multimedia/Digital Convergence, Semiconductors and Communication Devices, Imaging and Biomedical Engineering, Computer vision and Au-tonomous Vehiclesces.
Full text PDF files and XML are also available at the official website (http://www.jicce.org)
Volume 16 Number 1 March 2018
Published on 31 March 2018
Published by The Korea Institute of Information and Communication Engineering
Editorial Office (Manuscript Editing) Editor-in-Chief Yun Seop Yu, Ph. D.
Department of Electrical, Electronic & Control Engineering, Hankyong National University 327, Jungang-ro, Anseong-si, Gyeonggi-do, 456-749, Korea
Tel: +82-31-670-5293 Fax: +82-31-670-5299 e-mail: [email protected]
Editorial and Publishing Office
The Korea Institute of Information and Communication Engineering
#1802, Yuwon-officetel, Seomyeonmunhwa-ro, Busanjin-gu, Busan 614-731, Korea Tel: +82-51-463-3683 Fax: +82-51-464-3683 http://www.kiice.org/
e-mail: [email protected] e-submission: http://jicce.org
Printing Office Hanrimwon Co., Ltd.
13F Toegyero 20, 51 Gil, Jung-gu, Seoul 04559, Korea
Tel: +82-70-7865-4287 Fax: +82-2-2179-9083 e-mail: [email protected]
Copyright © The Korea Institute of Information and Communication Engineering
It is identical to the ‘Creative Commons Attribution Non-Commercial License’ (http://creativecommons.org/licences/by-nc/3.0/) This paper meets the requirements of KS Q ISO 9001:2009 / ISO 9001:2008 (Permanence of Paper).
This journal is supported by the Korean Federation of Science and Technology Societies. Background
It has been published since 2003 with a title of International Journal of Maritime Information and Communication Sci-ences. In 2012, this journal was greatly reformed to further improve the quality of journal, for example, title, research ar-eas and policy of journal etc. The title was changed from the year of 2012 as Journal of Information and Communication Convergence Engineering.
Subscription
JICCE is not for sale, but is freely distributed to members of the Korea Institute of Information and Communication Engi-neering and relevant institutions. Circulation number of print copies is 800. Individuals or Institutions, who wish to sub-scribe this journal, please contact the editorial office through mail ([email protected]).
All or part of JICCE is indexed/covered by Google Scholar, Korea Citation Index (KCI), DBpia, KSCI, CrossRef,
print ISSN: 2234-8255 online ISSN: 2234-8883
http://jicce.org
The Korea Institute of Information and Communication Engineering Editorial Board
Editors
print ISSN: 2234-8255 online ISSN: 2234-8883
http://jicce.org
print ISSN: 2234-8255 online ISSN: 2234-8883
Contents
Volume 16 Number 1 March 2018
Communication System and Applications
1
Nonlinear Compensation Using Artificial Neural Network in Radio-over-Fiber System Andres C. Najarro1 and Sung-Man Kim6
A New Technique for Localization Using the Nearest Anchor-Centroid Pair Based on LQI Sphere in WSN Sagun Subedi and Sangil Lee12
10-GHz Band Voltage Controlled Oscillator (VCO) MMIC for Motion Detecting Sensors Sung-Chan Kim, Yong-Hwan Kim, and Keun-Kwan Ryu17
Alternating-Projection-Based Channel Estimation for Multicell Massive MIMO Systems Yi Liang Chen, Rong Ran, and Hayoung Oh23
Implementation of Spectrum-Sensing for Cognitive Radio Using USRP with GNU Radio and a Cloud Server Huynh Thanh Thien, Rene Tendeng, Hiep Vu-Van, and Insoo KooNetworking and Services
31
Capacity Design of a Gateway Router for Smart Farms Hoon Lee38
Measurement Allocation by Shapley Value in Wireless Sensor Networks Sang-Seon ByunSemiconductors and Communication Devices
43
Analysis of Flat-Band-Voltage Dependent Breakdown Voltage for 10 nm Double Gate MOSFET Hakkee Jung and Sima DimitrijevThe Korea Institute of Information and Communication Engineering
http://jicce.org
Multimedia/DigitalConvergence
48
Keyword Analysis Based Document Compression System Kerang Cao, Jongwon Lee, and Hoekyung JungIntelligent Information System
52
Odoo Data Mining Module Using Market Basket Analysis Yulia, Gregorius Satia Budhi, and Stefani Natalia HendrathaComputer Vision and Autonomous Vehicles
J. lnf. Commun. Converg. Eng. 16(1): 52-59, Mar. 2018 Regular paper
52 Received 15 March 2018, Revised 22 March 2018, Accepted 23 March 2018 *Corresponding Author (E-mail: [email protected], Tel: +62-8973127237)
Department of Informatics, Petra Christian University, Siwalankerto, Surabaya 60236, Indonesia.
https://doi.org/10.6109/jicce.2018.16.1.52 print ISSN: 2234-8255 online ISSN: 2234-8883
This is an Open Access article distributed under the terms of the Creative Commons Attribution Non-Commercial License (http://creativecommons.org/licenses/by-nc/3.0/) which permits unrestricted non-commercial use, distribution, and reproduction in any medium, provided the original work is properly cited.
Copyright ⓒ The Korea Institute of Information and Communication Engineering
Odoo Data Mining Module Using Market Basket Analysis
Yulia*, Gregorius Satia Budhi, and Stefani Natalia Hendratha, Member, KIICE
Department of Informatics, Petra Christian University, Surabaya 60236, Indonesia
Abstract
Odoo is an enterprise resource planning information system providing modules to support the basic business function in companies. This research will look into the development of an additional module at Odoo. This module is a data mining module using Market Basket Analysis (MBA) using FP-Growth algorithm in managing OLTP of sales transaction to be useful information for users to improve the analysis of company business strategy. The FP-Growth algorithm used in the application was able to produce multidimensional association rules. The company will know more about their sales and customers’ buying habits. Performing sales trend analysis will give a valuable insight into the inner-workings of the business. The testing of the module is using the data from X Supermarket. The final result of this module is generated from a data mining process in the form of association rule. The rule is presented in narrative and graphical form to be understood easier.
Index Terms: Data mining, FP-Growth, Market Basket Analysis, Odoo
I. INTRODUCTION
Information System plays an important role in improving business competitiveness in all aspects. An enterprise resource planning (ERP) provides an ideal platform to answer those needs, though demanding high risks and costs to implement [1]. Those risks and cost can be minimized using Odoo.
Odoo is an ERP system developed as an open source application. Therefore, Odoo supports the reuse of the library built previously. The quality of Odoo is also good as there are many people involved in its development. More than 1,500 developers have been involved in the Odoo com-munity. It also has developed more than 4,500 modules to meet the business needs.
Out of those modules owned by Odoo, none of them can meet the needs of Business Intelligence using data mining methodology. Therefore, an additional feature of business intelligence using data mining is needed to equip the capability
of Odoo in increasing the competitiveness of companies. One of the functions of the data mining used in analyzing sales is the association function which is often called Market Basket Analysis (MBA). MBA uses an algorithm to search for products bought at the same time. FP-Growth algorithm was used for this research. The choice was based on the sta-bility and speed owned by this algorithm. The above men-tioned stability means that the algorithm will always have a good performance when tested at low and high minimum support. The sales data of a supermarket was used to test the module.
II. LITERATURE REVIEW
A. Odoo System
Odoo Data Mining Module Using Market Basket Analysis
53 http://jicce.org
Therefore, Odoo supports the reuse of the library developed previously. The great number of people involved in its devel-opment guarantees the good quality of this application. More than 1,500 developers are involved in the Odoo community and have been developing 4,500 modules to meet the busi-ness needs of the users. The users of Odoo has been reaching up than 2,000,000 spread all over the world [2].
The Odoo system consists of three main components: PostgreSQL, Odoo server application, and web server [3]. The open source PostgreSQL database [4] accommodates all Odoo data and configuration. Web server is a separate appli-cation making it possible for users to get access directly to the Odoo server application.
B. Data Mining
Data mining is used to deal with very large amount of data which are stored in the data warehouses and databases, to discovering interesting knowledge and information [5]. For the purpose of discovering, digging or mining the knowl-edge, data mining has several functions. Six functions in data mining are description function, estimation function, and prediction function, classification function, grouping function and association function [6].
The data at operational database comes from many sources. Therefore, it is susceptible towards inconsistent data such as empty fields and invalid data. The low quality of data will result in low quality of mining results as well. Thus, the data has to be prepared through the preprocessing stage before entering the mining stage [7].
There are several preprocessing techniques such as data cleaning and data reduction. Data cleaning is used to erase noise and correct the inconsistent data. Data reduction is a process in reducing the data volume representation but not reducing the quality of the analysis result. One part of the data reduction is data discretization focusing at data numeric [7].
C. Market Basket Analysis
MBA is one of the methods in data mining focusing at the identification of products bought together at one transaction. There are some terms such as support and confidence at MBA algorithm. Support is the percentage of all transactions containing the chosen item set. Confidence is the percentage of all transactions containing leading item and depending item. Leading item is a reference product.
The output from MBA is a series of rules identifying the products bought at the same time. This algorithm belongs to
The Top Ten Algorithms in Data Mining [8]. MBA has sev-eral algorithms in producing association rules, such as Apri-ori and Find Pattern Growth (FP-Growth).
D. Find Pattern Tree
Find Pattern Tree (FP-Tree) is a compressed representation from input data. Each transaction data is read, mapped into a path at FP-Tree. Transactions having the same items will cre-ate overlapping paths. The more overlapping paths crecre-ated, the more compressed an FP-Tree structure is formed [9, 10].
Every node at a tree shows an item name, support counter indicating the amount of transaction path crossing over that node, and a linking pointer linking nodes with the same item between paths.
The algorithm in buiding FP-Tree is as follows [11]:
E. Find Pattern Growth
FP-Growth algorithm is an alternative algorithm using a radical different approach to find frequent itemsets [9]. This algorithm does not use generate-and-test paradigm which is used at Apriori. Instead, FP-Growth is using a special data structure called FP-Tree. Frequent itemsets is extracted directly from FP-Tree. Therefore, the FP-Growth algorithm is faster than the Apriori algorithm.
Zheng et al. [12] were doing a comparison towards the performance of four MBA algorithms: Apriori, FP_Growth, Charm and Closet. The performance was measured from how fast an algorithm produced frequent itemsets from four datasets. Table 1 shows the result of the test conducted with high minimum supports and low minimum supports. From each test, the FP-Growth algorithm never had the lowest per-Algorithm 1. The building of FP-Tree
Input: a DB transaction database and the desired minimum support
Output: FP-Tree, frequent-pattern tree from DB Method: FP-Tree is built in the way as follows:
1. Scan the DB transaction database once. Get F, frequent items sets, and support from each frequent item. Sort descendingly the support from F. Put the order list from frequent items into the Flist.
2. Make root from FP-Tree and label it as “null”. Each Trans transaction at DB, is treated as follows:
• Each frequent item in Trans is sorted based on the order list at Flist. The list of the frequent item in the sorted Trans, is defined as [p|P], where p is the first element and P is the remaining list. Call the insert tree ([p|P], T]) function.
J. lnf. Commun. Converg. Eng. 16(1): 52-59, Mar. 2018
https://doi.org/10.6109/jicce.2018.16.1.52 54
formance. It was concluded that the FP-Growth was a stable algorithm in various situation [12].
F. FP-Growth Algorithm
FP-Growth is one of the algorithms in producing association rule. This algorithm is conducting mining frequent pattern using FP-Tree which has been previously developed [11]
III. RESEARCH METHOD
Fig. 1 is the research method stages. The first step in this research is the identification of needs. The case study in this research is a supermarket in Surabaya, Indonesia which has been operating for more than 10 years. Stored transaction data has not been well utilized to improve the competitive-ness of supermarkets in the midst of the increasingly wide-spread mini market business in Surabaya.
The second step is data collection and analysis. The researcher collects the sales transaction data for the last 5 years and then analyzes the data. From the result of data analysis, the process to determine the method used in man-aging the data into information useful for the user to improve the company business strategy. In this process, we had used market basket analysis method with FP-Growth algorithm. The next steps are the process design, implemen-tation and testing.
A. Identification Needs
From those above problems, it was concluded that the owner of X Supermarket needed an IT-based system to assist him in decision making process. The criteria of the system were as follows:
• Data mining application that can produce information on the level of association in the inter data of the goods. The required system has to have a multi dimension concept Algorithm 2. FP-Growth: Mining Frequent Pattern Using
FP-Tree with Pattern Fragment Growth
Input: a DB database represented by FP-Tree which has been developed based on Algorithm 1 and desired minimum support
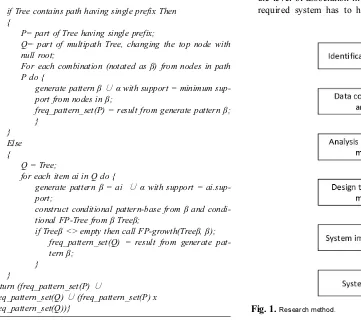
Output: the complete collection of frequent pattern Method: Calling FP-Growth function (Tree, null) Procedure FP-Growth (Tree,a)
{
if Tree contains path having single prefix Then {
P= part of Tree having single prefix;
Q= part of multipath Tree, changing the top node with null root;
For each combination (notated as β) from nodes in path P do {
generate pattern β∪ α with support = minimum sup-port from nodes in β;
freq_pattern_set(P) = result from generate pattern β; }
construct conditional pattern-base from β and condi-tional FP-Tree from β Treeβ;
if Treeβ <> empty then call FP-growth(Treeβ, β); freq_pattern_set(Q) = result from generate pat-tern β;
} }
return (freq_pattern_set(P)∪
freq_pattern_set(Q)∪ (freq_pattern_set(P) x
freq_pattern_set(Q))} Fig. 1. Research method.
Table 1. The capability ranking algorithm
High min support Low min support
IBM-Artificial Ap > FP > Ch > Cl FP > Ch > Cl > Ap
BMS-POS Ap > Cl > Fp > Ch Ch > FP > Ap > Cl
BMS-WebView-1 Ap > FP > Cl > Ch Ch > FP > Ap > Cl
BMS-WebView-2 Ap > FP > Ch > Cl Ch > FP > Ap > Cl
Odoo Data Mining Module Using Market Basket Analysis
55 http://jicce.org
showing the existing relation. The dimension used is the dimension of the goods, customers, suppliers and time. • The required system can provide information on sales
transaction to the owner of X Supermarket.
B. Data Collection and Analysis
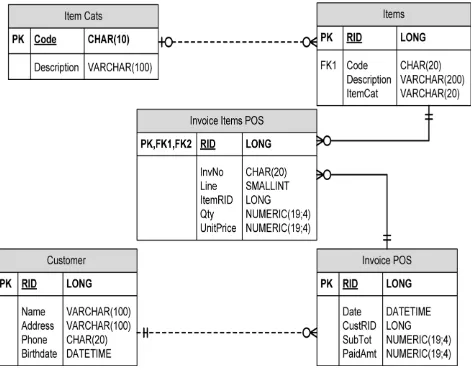
X Supermarket had more than 16,000 types of goods. X Supermarket had already had an IT-based system since 2006. All transaction data had been saved into a database. The big amount of data had not been much used to produce meaning-ful information. The promotion for sales often just trailed the promotion of the supplier. The product bundling had also been based on estimation. Besides, the purchase of goods had also been based on current condition and estimation. The owner had not been using the previous transaction for deci-sion making process. Therefore, X Supermarket needed an application able to process the transaction data into useful information for top-level management in the decision mak-ing process. The source of data used in X Supermarket can be viewed at Fig. 2. There were five tables such as: saving goods category data, goods data, customer data, sales data and detailed purchasing data.
C. System Design
The design of the module was started by designing the overall system design using data flow diagram (DFD). There were some processes conducted, among others:
• The setting process was a process in setting the period of data being used, filter and minimum support. This process needed the data in the form of transaction period and mini-mum support from external entity user.
• The preprocessing process was a preparation process
toward the data processed at the next stage. This process covered the cleaning process toward the invalid data and the interval arrangement at the data needed to be normal-ized. The required data for this process was the transaction data and the product price data from the database. The result of this process was a processed data.
• The generate frequent itemsets process was a process for forming frequent itemset. This process required the data on transaction period, filter and minimum support from data-base setting, and the transaction data from the datadata-base. This process resulted in the form of frequent itemset saved at HT and PHT data store.
• The generate FP-Tree process was a process on developing FP-Tree based on the data from the process of generate fre-quent itemsets. The result of this process was FP-Tree which would be used later at the next process.
• The generate association rule process was a process to pro-duce association rule. This process required the data in the form of FP-Tree from the process of generate FP-Tree, conditional pattern-base from the database rule criteria and minimum confidence from the external entity user. The result of this process was conditional-pattern base, frequent pattern base and association rule, saved in data store. • The generate graph and report process was a process to
present graphics and reports. The data required was in the form of type and content of the graphics as well as reports to be presented to the owner. This result of this process was graphics and reports.
• The sales process has been available at Odoo and was not covered at this research. This process is the process on sales requiring customer and product data. This process produces transaction data. Those data were inputted into the database. The data from the database will be used at the process of preprocessing.
D. Design the Proposed Method
The data is taken from company data source. After that, the data is inserted into the table in the Odoo database as fol-lows:
• Table PRODUCT_TEMPLATE: contains product template data.
• Table PRODUCT_PRODUCT: contains data product mas-ter data.
• Table PRODUCT_CATEGORY: contains product category data.
• Table SALES_ORDER: contains sales transaction data. • Table SALES_ORDER_LINE: contains detailed sales
transaction data.
Fig. 3 is the design of flowchart and algorithm of MBA data mining module.
J. lnf. Commun. Converg. Eng. 16(1): 52-59, Mar. 2018
https://doi.org/10.6109/jicce.2018.16.1.52 56
be used and minimum support for mining process. The data preprocessing process was retrieving data in accordance with the desired period of user. The data through this process is the sales transaction and sales detail data. In the process of generating frequent itemsets (Fig. 4), the system will read the sales data. Items that have support equal to or more than the minimum support will be saved into the header table. The items in the header table corresponding to the sales data will be stored into the IPM table for reference in the creation of the FP-Tree.
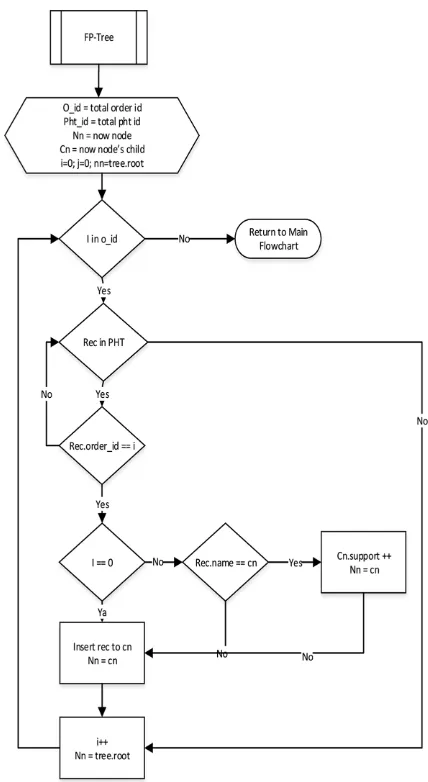
Fig. 5 is a tree-building process, in which FP-Tree is formed according to the IPM table. FP-Tree is used to sim-plify the path retrieval process of each item.
In the generating association rule process, it will generate some combination of items that often occur in X Supermar-ket sales data. Combination results obtained through FP-Growth algorithm.
Fig. 3. System flowchart.
Fig. 4. Generate frequent itemsets flowchart.
Odoo Data Mining Module Using Market Basket Analysis
57 http://jicce.org
IV. RESULTS AND ANALYSIS
The application was developed using Python programming language at Odoo framework using PostgreSQL database. As described at DFD, there were several processes conducted. This testing was conducted in accordance to those processes. This paper did not show the two starting processes: setting and preprocessing.
A. Generate Itemset
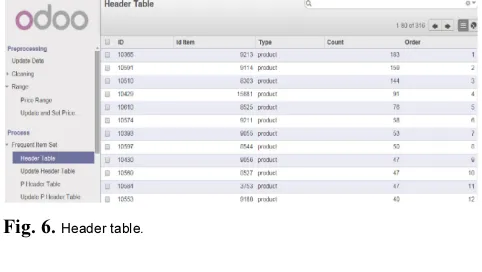
At the generate itemset function there were two main menus: header table (HT) and frequent header table (FHT). These menus were used to process the data before being able to be entered into the tree. At the sample case, the dimension processed was product dimension. So the item data entered into the HT was the product type only. Based on the mini-mum support that had been set as 0.2% from the total trans-action, 316 items at HT fulfilled the minimum support. This result can be seen at the HT as shown at Fig. 6.
The FHT can be seen at Fig. 7. This figure shows that the products with ID 8033 and 9055 were at the same transac-tion, which was transaction 13091. The item was saved according to the order of the HT from the smallest up to the biggest. The data from the FHT was later formed into a tree.
B. Generate FP-Tree
At the generate FP-Tree function, there were two menus: update and view FP-Tree. These menus were used to form
FP-Tree from the data originated from FHT. At the update FP-Tree, the system conducted the forming of a tree. The system was then reading the data of the FHT, then the data having the same selling ID was united into one path. The result from this function became a tree which can be viewed at the menu of view FP-Tree at Fig. 8.
C. Generate FP-Growth
At the FP-Growth function, there were two menus: View Conditional Pattern Base and View Generated Pattern Set. The path for each item at the HT was presented at the menu
Fig. 6. Header table.
Fig. 7. Update frequent header table.
Fig. 9. The view conditional pattern menu interface.
Fig. 8. FP-Tree.
J. lnf. Commun. Converg. Eng. 16(1): 52-59, Mar. 2018
https://doi.org/10.6109/jicce.2018.16.1.52 58
of View Conditional Pattern Base. At this case study, 1,878 conditional pattern base were generated, each with its sup-port as seen at Fig. 9.
The view frequent itemset menu showed the frequent pattern set and support from each pattern set. At the case study, 319 pattern sets were generated with the support showing how many times that patter appeared at the transaction. Fig. 10 shows that at 10,639 pattern item, there were 10 transactions. The 16th line indicates that the item pattern 10,365 and 10,591 appeared together at the transaction 11 times as seen at Fig. 10.
D. Generate Association Rule
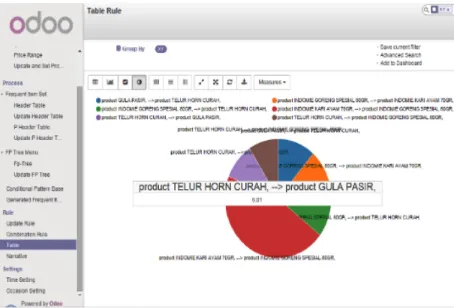
At the Generate Association Rule function, there were three menus: Table View, Narrative Views, and Chart View. At the Table View menu, the result of the rule was displayed in the form of a table showing the support and confidence from each table. At this study case, six rules were resulted as shown at Fig. 11. The rule at the first line means that the products of eggs were bought together with sugar with 0.25% support and 6.01% confidence.
Fig. 12 displays the pie diagram for each pattern set. One of the pattern sets as when eggs were bought then sugar have to be bought as well, shows 6.01% confidence.
V. CONCLUSION
Based on the result of the design and development of the application, it can be concluded that the development of the application was able to complete the features provided by Odoo. The FP-Growth algorithm used at the application was able to produce multidimensional association rules.
ACKNOWLEDGEMENTS
This research was funded by DIPA Directorate General of Research and Development Reinforcement (Direktorat Jen-deral Penguatan Riset dan Pengembangan).
REFERENCES
[ 1 ] L. W. Santoso and Yulia, “Data warehouse and big data technology for higher education,” Procedia Computer Science, vol. 124, pp. 93– 99, 2017. DOI: 10.1016/j.procs.2017.12.134.
[ 2 ] G. Moss, Working with openERP. Brimingham: Packt Publishing, 2013.
[ 3 ] D. Reis, Odoo Development Essentials. Brimingham: Packt Publishing, 2015.
[ 4 ] S. Riggs and H. Krossing, PostgreSQL 9 Administration Cookbook. Brimingham, UK: Packt Publishing, 2010.
[ 5 ] M. Narvekar and S. F. Syed, “An optimized algorithm for association rule mining using FP tree,” Procedia Computer Science, vol. 45, pp. 101–110, 2015. DOI: 10.1016/j.procs.2015.03.097.
[ 6 ] D. T. Larose, Discovering Knowledge in Data: an Introduction to Data Mining. Hoboken, NJ: John Wiley & Sons, 2005.
[ 7 ] J. Han, M. Kamber, and J. Pei, Data Mining: Concepts and Techniques, 3rd ed. San Fransisco, CA: Morgan Kaufman, 2012. [ 8 ] X. D. Wu and V. Kumar, The Top Ten Algorithms in Data Mining.
Boca Raton, FL: CRC Press, 2009.
[ 9 ] P. T. Tan, M. Steinbach and V. Kumar, Introduction to Data Mining. Boston, MA: Pearson, 2005.
[10] J. Li and D. T. Ming, “Research of an association rule mining algorithm based on FP tree,” in Proceedings of IEEE International Conference on Intelligent Computing and Intelligent Systems, Xiamen, China, pp. 559-563, 2010. DOI: 10.1109/ICICISYS.2010. 5658443.
[11] J. Han, J. Pei, Y. Yin, and R. Mao, “Mining frequent patterns without candidate generation: a frequent-pattern tree approach,” Data Mining and Knowledge Discovery, vol. 8, no. 1, pp. 53–87, 2004. DOI: 10.1023/B:DAMI.0000005258.31418.83.
[12] Z. Zheng, R. Kohavi, and L. Mason, “Real world performance of association rule algorithms,” in Proceedingof the 7th ACM SIGKDD International Conference on Knowledge Discovery and Data Mining, San Francisco, CA, pp. 401–405, 2000. DOI: 10.1145/ 502512.502572.
Fig. 11. The interface of table view menu.
Odoo Data Mining Module Using Market Basket Analysis
59 http://jicce.org
Yulia
is a professor in Informatics Department, Petra Christian University, Surabaya, Indonesia. She received her bachelor degree in Informatics Department from Surabaya University, Indonesia, and master degree in Information Technology from University of Indonesia. Her research interests are enterprise resource planning and data mining.
Gregorius Satia Budhi
is a professor in Informatics Department, Petra Christian University, Surabaya, Indonesia. He received his bachelor degree in Informatics Department from Institute Technology Adhi Tama, Surabaya, Indonesia, and master degree in Computer Science from Institute Technology 10 Nopember, Surabaya, Indonesia. His research interests are artificial intelligence, data mining/ machine learning.
Stefani Natalia Hendratha