1
European Association for the
Development of Renewable Energies, Environment and Power Quality (EA4EPQ)
International Conference on Renewable Energies and Power Quality (ICREPQ’12)
Santiago de Compostela (Spain), 28th to 30th March, 2012
THE USE OF DIGITAL SIGNAL PROSESSING CARD
IN ACTIVE POWER FILTER DESIGN
TO MITIGATE HARMONIC DISTORTION
Daniel Rohi
1),Limboto Limantara
2), David Wailanduw
3,Resmana L
4),Stephanus Ananda
5), Yusak Tanoto
6)1,2,3,4,5,6)
Electrical Engineering Department, Faculty of Industrial Technology, Petra Christian University Jl.Siwalankerto 121 – 131 Surabaya, Phone/Fax number:+00620318418026, e-mail: [email protected]
Abstract.
Nowadays most of factories use non-linear loads, such as VSD (Variable Speed Drive), rectifier, UPS system, computer, etc. They cause the harmonics and will be reduce the cost of power quality in the electric distribution system. Harmonics also influence the performance of the loads, which is used in that system.To reduce the harmonics in the system, we applied active filter by using a DSP card that connected with a PC. A sinusoidal waveform distorted with the harmonics will be processed, by using LabView 7 software, so the harmonics could be reduce or eliminated.By using DSP card, the harmonics which appear in the system, caused by of non-linear loads usage, can be reduced until 25th harmonics, so the cost of the power quality in that system will increased. In this case, we using a Sheldon Instrument’s DSP Card, SI-C33DSP-PCI, which is plugged by an analog I/O module, SI-MOD68xx, which is used for signal processing inside the computer. Furthermore, we must add a library for LabView 7, called QuVIEW, which is used to operate that DSP card.From the anlaysis that have been done, we can take a conclusion, the cost average of eliminated harmonics in distorted waveform is up tu 80%. Which on pure triangle waveform, cost of %THD decreased from 13.4376% become 3.12239%Keywords
:Harmonics, Active power filter, LabView 7, DSP
card, QuVIEW.
1. Introduction
The use of non-linear load such as electronic equipment, VSD (Variable Speed Drive), rectifier, UPS system, computer, television, low energy lamp or fluorescent lamp, photocopy machine and many others have increased and varied. Non-linear load will produce such wave that flows into the electric power system, thus causes particular defect in the wave system. This phenomenon is called harmonic distortion. The harmonic effect in the electric power system depends on the source and the location of that harmonic. Harmonic in electric power system can cause some unwanted effects, namely the electronic equipment have rapidly heated and reduced life-time, even can break the equipment, interference signal (e.g. noise in phone line) and over voltages. In a simple word, harmonic distortion decreases the efficiency
of the electronic equipment that economically affects the increasing of its maintenance cost.
In order to decrease the harmonic distortion, it generally uses a filter, such as passive, active, and hybrid filter. Active filter has certain advantage compared to the passive and hybrid filter. Active filter is created by using Digital Signal Processing (DSP) card connected to the computer. It is such a very effective way to reduce the harmonic distortion in a power distribution system.
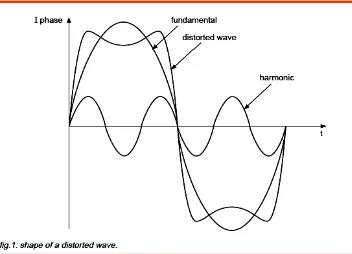
2. Harmonic
Harmonics is a change in voltage and current wave forms that interferes the electrical distribution system and reduces the quality of the electrical power system. A defect in a sine wave is caused by the interaction between sinus waveform system and other wave which is called harmonic. Harmonic is another wave components with integer multiple frequencies of its fundamental frequency.
Figure 1. Fundamental and distorted sine signals
Percentage of the total voltage distorted by harmonics of the fundamental frequency is known with VTHD% and percentage of the total amount of current distorted by the harmonics of the fundamental frequency is denoted by% ITHD.
1 2
2
V
V
THD
N
n n
∑
2
where:Vn = harmonic component
V1 = fundamental component
k = observed maximum harmonic component
A. Harmonic Filter
Harmonic filter is used to reduce harmonics trouble that can spread harmonic current to other parts of an electrical system. Besides, the use of harmonic filter in its fundamental frequency can compensate the reactive power and improve the power coeficient into the average of 0.80-0.94.
The quality of a filter (Q) denotes the tune sharpness. In filter tuning, the quality of the filer (Q) can be defined as a comparison of the impedance (inductance/capacitance) to the resistance in its resonance frequency. That quality is best described by equation below:
(2)
(2.1)
Another general equation:
(2.2)
(2.3)
(2.4)
(2.5)
(2.6) where:
L = filterinductance (H)
C = filtercapasitance ( F) R = filterresistance( ) BW = tuning bandwidth(Hz)
However, the calculation of the distribution of filter capacity can be done if the value of filtered current frequency (
I
H(TH))and total amount of the current (∑
I
H )before using filter are known.(2.7)
B. The Principle of the Active Filter
The function of active filter is to eliminate harmonic waves from the power supply as an effect of non-linear load in electrical distribution lines. There are some processes used to make an active filter. The scheme in figure 2 explains the working principle of active filter: IFis net current, ILis load current containing fundamental
current and harmonic, while Ih is filter current similar to
harmonic current in IL. Simply, it can be formulated
IF=Ih+IL. The active filter has to inject the minus current
(-Ih) so that IF = IL. Active filter will detect changes in the
fundamental sine wave then send a wave to reduce the wave in that fundamental wave.
Figure 2. The Active Filter
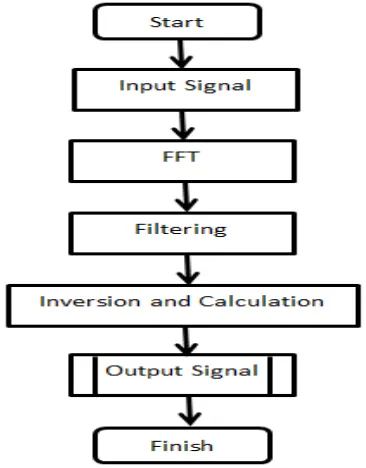
3. Method
DSP card has many functions to be selected as needed so that the function of the program that can be used to form an ideal active filter will not be expanded. Ideal means the ability to directly control and monitor the use of the filter. However, the use of the DSP card functions is limited by its memory, the more complex a program, the greater the memory used to run that program. Therefore, the program is designed according to the function and working principle of the active filter.
Some important parts in this program are the establishment of the fundamental signal processed, the calculation of the power spectrum, filter making, and the process of removing these signals through the analog I/ O.
Program made by using DSP card is merely to produce certain wave that will neutralize harmonic wave
R
X
Q
=
0BW
f
Q
=
RC
L
C
L
X
NN
=
=
=
ω
ω
1
0LC
N1
=
ω
RQ
X
C
N Nω
ω
1
1
0=
=
N NRQ
X
L
ω
ω
=
=
0 0 2 0x
2
f
3
in electric distribution lines. Some stage to be tested is theability analog I/O module to pull out the waves by using a program, then that wave will neutralize the harmonic wave. Some important parts in this program are the establishment of the fundamental signal processed the calculation of the power spectrum, filter making, and the process of removing these signals through the analog I/O.
Figure 3 Flowchart ofActive filter Program
Below are the testing procedures.
Firstly,input signal is made by combining some sinusoidal waves with different frequencies that make up the multiples 3, 5, 7, 9, 11 etc. from the fundamental frequency. The scheme is described in Figure 3.
Figure 4 Block diagram creation with the merger wave of sinusoid signal
Secondly, use triangle and square waves as the ideal waves to describe the harmonic in a distribution line. If we analize a triangle or square wave with certain
frequency and amplitude by using Fourier transformation and its result is included in the graph, thus we will find that there are several frequency signal that has smaller amplitude value than the actual, namely in the frequency that make up the multiples 3, 5, 7, 9, etc. towards the fundamental frequency. Wave that contains those multipled frequencies is harmonic wave or harmonic distortion. This wave will be processed by the active filter to return to the standard fundamental wave.
Figure 5 Signal making by combining the sinusoidal waves
Here is the shape of the signal produced by the analog module I/O in the DSP card that its results can be pulled out and checked by using oscilloscope. Signal making does not always use sine signal or sawtooth or pure triangular. Those making process can also be added certain noise, in this case there will be tested additional white gaussian noise in a signal.
Figure 6 Block diagram of the making of triangle signalwith additional white gaussian noise
4
Figure 7 Block diagram of FFT in triangle signal
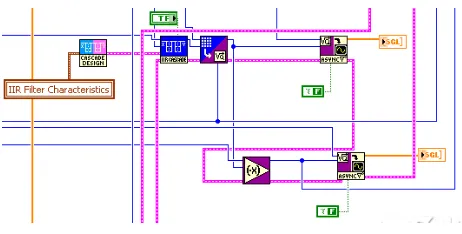
Third stage is filtering. In this stage, fundamental stage is separated from other additional waves that caused harmonic. The separation results in two components namely fundamental and harmonic cause waves. This process uses harmonic cause wave to continue to the next process. Filtering process is descibed in figure 5.
Figure 8 Block diagram of filtering in triangle signal
Forth stage is reversal and calculation. In this process, wave produced by filtering process will be inverted or multiplied with minus one (-1). As a result, there is a wave whose value is inversely proportional to the value of harmonic cause wave in the source. As it seen in figure 6, that negative wave is calculated to the source wave and resulted output signal which is similar to pure sine signal.
Figure 9 Block diagram of inversing process of filtering on triangle signal
Final stage. The calculation of the total precentage of harmonic distortion (%THD) and individual harmonic distortion (% IHD). This process is done twice, on pure triangle wave at first and the second is on the output wave from the active power filter process. It is done to get the comparison of the harmonic value before and after getting into this process. The final filtering process is described on figure 10.
Figure 10 Block diagram of calculating %THD and %IHD on the wave (input or output)
4. Results And Discussions
In this experiment, block diagram has been designed so that wave resulted from a program can be taken out through the analog module I/O in the DSP card and be analized by using oscilloscope. The shape of the signal is shown in figure 11.
Figure 11 The measurement results by using oscilloscope
5
Therefore, this wave is not suitable to be simulated in thisactive power filter. In this experiment, it is used triangle wave that contains harmonic spectrum. Its harmonic then will be reduced by the active filter controlled by the DSP. Harmonic spectrum of triangle wave is shown in Figure 12.
Figure 12 Triangle wave and its harmonic values
A. The Calculation of Fast Fourier Transform (FFT)
The calculation of Fast Fourier Transform (FFT)
is designed to analize the harmonics in a signal comes from the source by using triangle wave. This based on the wave characteristic that has value in multiplication frequency or harmonic orde 3, 5, 7, etc depends on signal amplitude which is similar to harmonic wave characteristic in a network system.
In this analysis, there will be a calculation on triangle signal with frequency 50Hz and amplitude value is 2. The analysis is going to find the fundamental value of that wave, the harmonic wave of that signal and calculate the precentage of the total harmonic distortion (%THD). The precentage of total harmonic distortion (%THD) is used as a reference to determine whether the final signal after the filter has a better quality or not. Also, it will be proved whether the filter can run well or not. By using program Lab VIEW, FFT value will be counted as shown in Figure 13.
Figure 13 FFT result of triangle wave on LabVIEW
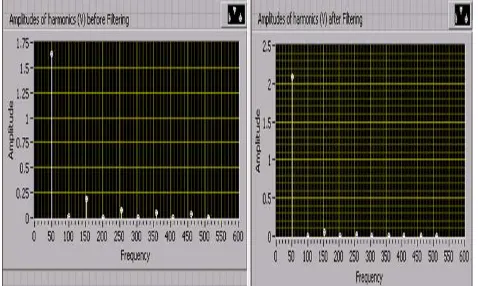
In figure 12, it is shown that the signal has fundamental frequency for about 50Hz, harmonic wave frequency for about 3, 5, 7, and 9; or on frequency 150Hz, 250Hz, 350Hz, 450Hz. The amplitude of each frequency is different with the value of the spectrum, so there is a calculation to detect and find the amplitude.
Figure 14 Harmonic graph and %THD of triangle wave before and after the filtering process
By knowing the amplitude of each frequency, then we can know the value of %IHD and %THD of each frequency. We can see in on Table 1.
Table 1 Harmonic calculation on a pure triangle wave
h(n) IHD (%) Frequency RMS Value
1 100.00 51.2002 1.63
2 0.638 100.495 0.0104
3 11.902 153.606 0.194
4 0.326 202.498 0.00532
5 4.804 255.97 0.0783
6 0.191 304.499 0.00312
7 3.086 358.42 0.0503
8 0.199 406.499 0.00325
9 2.485 460.773 0.0405
10 0.150 510.5 0.00245
Total Harmonic
Distortion: 13.4%
Note : h(n) : Harmonic number
IHD (%) : Individual harmonic distortion
The value of %IHD is obtained from the comparison of the RMS value which is from fundamental wave as the first harmonic wave and the RMS value from the wave that sought, for instance the 2nd, 3rd, 4th, 5th, etc harmonic wave, multiplied by 100%.
%IHDn = In/I1 * 100%
(3)
where:
In = RMS value from harmonic component
I1 = RMS value from fundamental component
6
Filtering process can be done only after weanalize and know the amount of harmonic wave of a source signal, so we can consider the filter limitation used. If we know signal that is going to be analized has fundamental wave for about 50Hz, so the harmonic inverting wave should have frequency more than the fundamental wave. By looking at the data, the signal then has frequency above 100Hz. If we look at the spectrumk figure, it is assumed that the RMS value on a wave between 50Hz and 100Hz near zero or nothing at all. Filter used is highpass filter with limitation of 100Hz.
On Figure 15, we get certain result from a filtering process and multiplied with minus 1 (-1) to get the harmonic inverting signal. That harmonic inverting signal is immediately inserted with source signal in order to get signal shape that resembles a pure sine signal. This signal is assumed as a signal that will getting into the loads attached to the network.
Figure 15 The graph of highpass filter result and inverting value of triangle wave
Figure 15 shows triangle wave that has been distoted is being made into a deformed sine wave. That wave is used as its opposite. After passing through the filter active, so the filter active controlled by the DSP will separate the harmonic wave to its fundamental wave. Afterwards, that harmonic wave will be eliminated by the DSP so output of the deformed wave becomes perfect is as shown in figure 16.
Figure 16 Output graph of triangle wave after filtering process
The last stage to be done is counting the %THD on the last wave whether the filter can run and function well.
By comparing the results of calculation on Table 1 and Table 2, the value of %THD before and after
filtering process on the signal and harmonic, so it can be concluded that output signal resulted from active filter has better quality than the input signal. The %THD is reduced until 77% from its original value, which is from 13.4% become 3.1%. If we refer to table limit of harmonic distortion, so it is concluded that filter can get over and reduce the harmonic in particular distribution network.
Table 2 Harmonic calculation on output signal of triangle signal
h(n) IHD (%) Frequency RMS Value
1 100.00 51.1984 2.09
2 0.385 100.493 0.00804
3 2.995 153.61 0.0626
4 0.090 202.497 0.00189
5 0.670 255.953 0.014
6 0.0335 304.498 0.000701
7 0.3153 358.418 0.00659
8 0.0207 406.499 0.000433
9 0.214 460.769 0.00448
10 0.01244 510.5 0.00026
Total Harmonic Distortion : 3.1%
Note : h(n) : Harmonic number
IHD (%) : Individual harmonic distortion
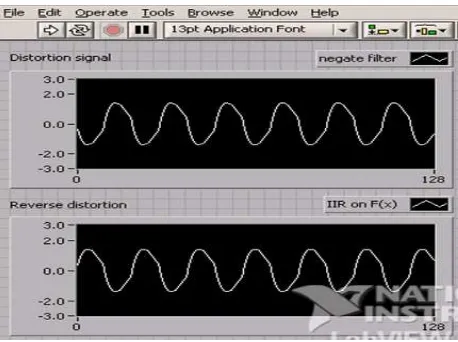
The experiment of triangle wave with noise. To get a maximum result, the experiment is done by using triangle wave that has particular noise. By using LabVIEW program, we get FFT of triangle wave with noise on LabVIEW as seen on Figure 17 and the result is in Table 3, the total of harmonic distortion is about 15.1%. It is then made a deformed sine wave as seen on Figure 18. This wave will be processed through the active filter controlled by DSP. After passing the DSP, the distorted wave will be filtered or reduced. The output is the perfect sine fundamental wave as shown in Figure 19.
Table 3 Harmonic calculation on triangle wave with noise
h(n) IHD (%) Frequency RMS Value
1 100.00 51.1932 1.61
2 2.1553 103.627 0.0347
3 12.422 153.602 0.2
4 1.795 204.356 0.0289
5 5.4285 255.824 0.0874
6 2.5093 304.414 0.0404
7 2.9627 358.358 0.0477
8 1.913 408.745 0.0308
9 3.354 460.764 0.054
10 1.795 508.619 0.0289
Total Harmonic Distortion 15.1% IHD (%) : Individual harmonic distortion
h(n) : Harmonic number
7
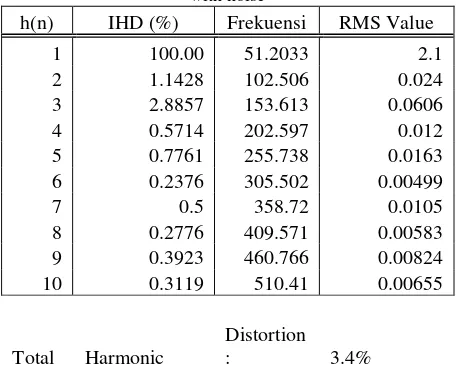
be eliminated by the active filter and the result is in Figure19 and 20, and Table 4, which shows the harmonic reduction that %THD is reduced up to 78%, from 15.1% becomes 3.4%.
Figure 17 Output graph of triangle wave with noise after filtering process
Figure 18 Graph of harmonic value and %THD of triangle wave with noise before and after filtering process
Table 4 Harmonic calculation of output signal on triangle wave with noise
h(n) IHD (%) Frekuensi RMS Value
1 100.00 51.2033 2.1
2 1.1428 102.506 0.024
3 2.8857 153.613 0.0606
4 0.5714 202.597 0.012
5 0.7761 255.738 0.0163
6 0.2376 305.502 0.00499
7 0.5 358.72 0.0105
8 0.2776 409.571 0.00583
9 0.3923 460.766 0.00824
10 0.3119 510.41 0.00655
Total Harmonic
Distortion
: 3.4%
5. Conclusion
1. If the wave is being connected with the signal source outside the PC, so analog wave that can be received and tranceived is ±10Vp. While the number of analog inputs and analog outputs that can be used depend on the type of modules used. In this case, we used SI-MOD6816-100-8DAC, where it can only be used for 16 analog inputs and 8 analog outputs.
2. The average of harmonic elimination on a wave distorted until 80% where on a pure triangle wave the %THD change from 13.4% becomes 3.1% .
3. The system can also be used to eliminate the harmonic wave with noise, the value is up to 80% where on the triangle wave with noise, the %THD change from 15.1% become sebesar 3.3%.
4. The amplitude wave resulted is bigger than the original wave. It is caused by a time shifting on a highpass filter process where the transceived signal is slower in a matter of millisecond.
5. System made depends on the memory in DSP card, the higher the value, the more complex and precies the system can be made.
Acknowledgement
This research was supported and funded by Research Centre of Petra Christian University
References
Anthony, J. Pansini. Electrical Distribution Engineering. Singapore: McGraw-Hill Company, 1983.
Arrilaga, Jos and Watson, Neville. Power System Harmonics. Chicester: John Waliey and Sons, 2003.
C. Sankaran. Power Quality. Florida: CRC Press, 2002. Noel, Qillon and Pierre, Roccia. Harmonic in Industrial
Network. Merlin Gerin, 1994. 15 September 2007 <http://www.cn.co.kr/enuser/power/powerpdf/ect15 2.pdf>
QuVIEW for use with LabVIEW QuBASE for use with Visual Basic. San Diego : Sheldon Instruments, 2007.
Saadat, Hadi. Power System Analysis. New Delhi: McGraw-Hill Inc, 1992.
SI-C33DSP User’s Guide. San Diego: Sheldon Instruments, 2007.
SI-MOD68xx User’s Gude. San Diego: Sheldon Instruments,2007
.