MASKED CORRELATION FOR IMPROVEMENT OF 2D GLACIER MOTION
ESTIMATION BASED ON TERRASAR-X IMAGERY
L. Fang, U. Stilla
Photogrammetry & Remote Sensing, Technische Universitaet Muenchen (TUM), Munich, Germany - [email protected]
Commission VI, WG VI/4
KEY WORDS: Glacier, 2D Motion, SAR, Masked Cross-correlation
ABSTRACT:
In this paper, the impacts of the non-glacier information in the template window used in cross-correlation calculation for 2D motion estimation of glaciers are discussed and illustrated by the example of the Taku glacier, which is the biggest glacier in the Juneau Icefield, Alaska. For this, the glacier motion maps are extracted by the traditional normalized cross-correlation technique and the masked cross-correlation method, which uses a manually generated binary mask to threshold the non-glacier pixels, based on geo-coded high resolution TerraSAR-X images. Based on the comparison of the different results, it was found that without the disturbing information (e.g., mountain, water) the accuracy of the cross-correlation of sequential patches in masked cross-correlation method is improved and the estimation results are much more reasonable, which respect the law that glacier flows like a river with higher velocity in the middle and than that in the sides.
1. INTRODUCTION
The glacier motion rate serves as a control parameter determining the mass balance of ice sheets and furthermore helps for the understanding of the local and global climate change. Remote sensed data has been extensively applied on understanding glacier dynamics. Especially SAR data have provided invaluable tools for monitoring glacier velocities. Compared with remote-sensing data the conventional in situ observations of glacier motion are costly and limited at the spatial coverage, although they can be of high accuracy. Spaceborne remote-sensing data acquired from different sensors can help in those cases. Satellite optical imagery, providing visible features (e.g., crevasses, debris) for the motion tracking procedure, have been applied extensively for many glaciers with different characteristics (Scambos et al., 1992; Kääb, 2002; Berthier et al., 2005). However, the optical sensors are passive and rely on illumination by the sun, resulting in a strong dependence on weather phenomena which will disturb the scene backscattering characteristics in the sequential images. Active sensors like SAR have the ability to obtain timely data with a spatial resolution compatible with the topographic variation (Høgda et al., 2010).
2. SAR TECHNIQUES FOR VELOCITY ESTIMATION
Due to the unique advantages of SAR data, recently, glacier surface velocity estimation using SAR techniques has become more and more popular. Based on SAR images, there are many methods available for estimating glacier motions. The ones mainly used can be divided into two groups: D-InSAR and correlation-like method.
2.1 Differential SAR Interferometry
A complex SAR image includes both the amplitude and phase of the backscattered signals. The phase information is proportional to the range from sensor to ground objects along the line of sight and depends also on the radar center frequency. Generally, after an interferometric image pair is precisely aligned pixel by pixel, an map of phase changes (i.e. a differential interferogram) can be generated by adding sequentially registered SAR images. Then, the glacier motion patterns between the acquisitions with the same frequency and over the same area can be derived. SAR interferometry, which is able to achieve a precision in the order of a fraction of radar frequency, is the most accurate technique compared to other SAR techniques (Joughin et al., 1998; Strozzi et al., 2002; Luckman et al., 2007; Trouve et al., 2007)
2.2 Correlation-Like Method
The other frequently used techniques complementary to SAR interferometry can be called offset tracking or ‘correlation like’ methods. All these method are using various matching algorithms (e.g., normalized cross-correlation) and are based on different features, like isolated point targets, distributed targets, textures described by wavelets or other higher order statistics, as well as phase information.
2.2.1 Intensity tracking: (or cross-correlation optimization) method, based on normalized cross-correlation (NCC), can estimate the relative displacements in 2 dimensions: the range and azimuth directions. (Strozzi et al., 2002; De Lange et al., 2007; Floricioiu et al., 2008; Fallourd et al., 2011; Schubert et al., 2013).
2.2.2 Speckle tracking: a variant of intensity tracking, depends on the fact that the speckle patterns appears in sequential coherent observations by SAR sensors which can be correlated between the aligned blocks (Gray et al., 2001; Joughin et al., 2010).
2.2.3 Coherence tracking: a phase based measurement like D-InSAR, also known as the fringe visibility algorithm or coherence optimization procedure, selects small data patches from a pair of single-look complex products and constructs a series of small interferograms with changing displacements for which the coherence is estimated (Strozzi et al., 2002).
2.3 Limitations of 2D Motion Tracking
Comparing with other velocity estimation techniques using SAR data, SAR interferometry has the ability to map ice flow in many applications with the most accurate precision (Joughin et al., 1998; Strozzi et al., 2002; Luckman et al., 2007; Trouve et al., 2007). Nevertheless, two main limitations of D-InSAR remain: 1) the temporal decorrelation of the signal over the ice surface between the sequential acquisitions and 2) the restriction to only one-directional measurements (i.e. along line of the sight). These obstruct the more extensive application of this technique.
Within opposite to this, the feature tracking method has been extensively applied to obtain 2D motion maps of glaciers successfully in glaciers located around the globe with different characteristics due to its advantages making it suitable for a large time span between image acquisitions and even for fast flowing glaciers.
However, there are mainly two limitations of 2D motion tracking methods using SAR data (Fang et al., 2014). The first is that these correlation-like techniques do not take the flow based surface topography into account, resulting in the obvious fact that not all three dimensions of the velocity can be measured directly. In areas with a steep slope in the topography this results in a significant error regarding the real magnitude of the velocity. The other limitation arises in the velocity estimation especially around the boundary line between glacier and the surroundings (e.g., mountain, water). When the template window is dominated by other information than that of the glacier, the similarity match will be influenced disturbing the final motion estimation result.
3. DATA SET AND METHOD
3.1 Study Area and Data Preprocessing
The Juneau Icefield is a low-latitude glacier system of small scale located in southeast Alaska, with the Taku glacier, the outlet glacier, having the biggest content in this area. In this paper, the scenes of Juneau Icefield imaged by high resolution TerraSAR-X in summer, 2009, are applied for experiments. All the experimental works in this paper are based on 2 TerraSAR-X repeat cycle scenes acquired in stripmap mode from a descending track (see Table 1).
Imaging
02T15:27:08 26,94 30,57 descending
Table 1. TerraSAR-X data delineation used for experiment (SM-stripmap mode)
The TerraSAR-X Single Look Slant Range Complex (SSC) data are firstly orthorectified and geocoded using precise available DEM data (courtesy of the Chair of Geodesy, TU München). The enhanced data have a ground resolution of 3m with pixel spacing of 1.5m in both azimuth and range direction. Then, the region of interest (ROI) – the Taku Glacier – is extracted from every scene using the geometric annotation information available in the metadata.
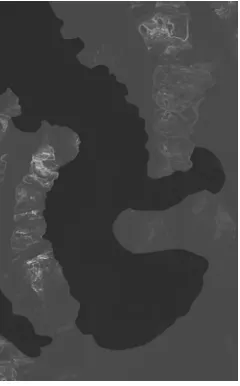
Based on the SAR data, a binary mask, describing the glacier and non-glacier areas which will be used in the next masked cross-correlation experiments, was generated manually (Fig. 1).
Fig.1. Binary mask plotted on the geo-coded gray SAR scene. Black part: glacier area; other part: non-glacier area (e.g., mountain, water).
3.2 Masked Cross-correlation for 2D Glacier Motion Estimation
The traditional feature tracking techniques, with the NCC as the similarity function, described in detail in (Strozzi et al., 2002; de Lange et al., 2007; Fang et al., 2013) which has been proved to be precise enough for the application of 2D glacier surface motion vectors analysis, do not take the negative contribution of the non-glacier information into account when applying the similarity processes. It has been demonstrated that when the template window is dominated by other information than that of the glacier, the similarity match will be influenced disturbing the final motion estimation result.
Different with the NCC function for each template window, the MCC, based on the binary mask, will only take the glacier information into the cross-correlation process ignoring the non-glacier information, in order to avoid disturbing the final non-glacier motion estimation result. This means in a rectangular window
used for cross-correlation, the non-glacier pixels are re-assigned as ‘NaN’.
4. EXPERIMENT RESULTS AND DISCUSSION
4.1 2D Glacier Motion Results
The 2D velocity vectors map of the Taku Glacier and the corresponding signal-to-noise ratio (SNR) image generated by the NCC similarity function are illustrated in Fig.2. In the lower part of the glacier body, the velocities are successfully estimated with higher SNR values which are employed as a confidence measure expressing the comparison of the modeled correlation peak, by a regression fit, relative to the average value of the remaining original correlation field. The feature tracking method fails to derive the motions in the upper part of the glacier body (the noise areas in the glacier motions map in Fig.2) which is mainly because of the snow cover in this area.
Fig.2. Velocity estimation results by NCC method. Upper image: the magnitude of glacier velocities (m/d); Lower image: SNR map.
The 2D velocity vectors map of the same area using MCC method presented in this paper is shown in Fig. 3. After
applying the MCC method ignoring the non-glacier information in the cross-correlation process, the magnitude of the glacier velocities and SNR values are more smooth and comparable. The velocities and SNRs of non-glacier area are estimated with almost zero value. On the contrary, in the main body of the glacier (except the area which are covered by snow), the velocities are successfully estimated with higher SNR values.
Fig.3. Velocity estimation results by MCC method. Upper image: the magnitude of glacier velocities (m/d); Lower image: SNR map.
4.2 NCC VS MCC
Several glacier patches around the boundary line between glacier and the surroundings are randomly chosen to illustrate the performances of these two similarity functions in glacier motion estimation.
And it was found that without the disturbing information (e.g., mountain, water) the accuracy of the cross-correlation of sequential patches in MCC method is improved and the estimation results are much more reasonable, which respect the law that glacier flows like a river with higher velocity in the middle and than that in the sides.
For comparison and better visibility, one part of the SAR scene including glacier and the surroundings is applied for velocity
estimation using both NCC and MCC methods, and the results are shown in Fig. 4.
Fig.4. Examples show the velocity estimation differences of NCC and MCC in glacier boundary areas. Yellow line: boundary line between glacier and other classes derived manually; Red arrows: the velocity vectors of each template window. Upper image: the estimation result by NCC; Lower image: the estimation result by MCC.
In Fig.4, the non-glacier area (mountain rock) is wrongly assigned with non-zero velocity values by NCC method, and on the contrary this area is estimated with zero by MCC method. In Fig. 5, a template window including glacier and even more mountain pixels is selected for velocity estimation. The NCC estimation is first applied on the original window including mountain information (upper part of Fig. 5). Then, this patch is applied by MCC method which only uses glacier information in this block to find the best similarity match (lower part of Fig. 5). Finally, the magnitudes of the velocity estimated in the original sized window (NCC) and masked block (MCC) are 0.36m/d and 0.01m/d, separately, with significant differences both in magnitude and direction.
This proves that when a template window is dominated by other information than that of the glacier, the similarity match will be influenced disturbing the final motion estimation result.
Fig.5. One cross-correlation template shows the velocity estimation difference of NCC and MCC in glacier boundary area. Yellow line: boundary line between glacier and other classes derived manually; Red arrows: the velocity vector of this template window. Upper image: the estimation result by NCC; Lower image: the estimation result by MCC.
5. CONCLUSION AND RECOMMENDATION
It can be concluded that when the template window used for cross-correlation is dominated by other information than that of the glacier, the similarity match will be influenced disturbing the final motion estimation result. In order to reduce these negative effects in glacier velocities estimation, a masked cross-correlation (MCC) is applied in this paper, which has shown its improvements comparing the traditional NCC method.
However, there are still many improvements left for further research. For instance, to mask out the non-glacier information automatically from every template window is needed to be achieved. For this, one possible solution might be that all the pixels belong to non-glacier information are thresholded according to a probability distribution. Furthermore, when dealing with the challenge faced when the template window includes glacier ice and other stationary-like surroundings (e.g., mountain, water) around the glacier boundary areas, a multi-scale template for cross-correlation becomes even more important.
6. REFERENCES
Berthier, E., Vadon, H., Baratoux, D., Arnaud, Y., Vincent, C., Feigl, K. L., F., R. and B., L., 2005. Surface motion of mountain glaciers derived from satellite optical imagery. Remote Sensing of Environment, 95, pp. 14-28.
de Lange, R., Luckman, A. and Murray, T., 2007. Improvement of satellite radar feature tracking for ice velocity derivation by spatial frequency filtering. IEEE Transactions on Geoscience and Remote Sensing, 45(7), pp. 2309-2318.
Floricioiu, D., Eineder, M., Rott, H. and Nagler, T., 2008. Velocities of major outlet glaciers of the Patagonia Icefield observed by TerraSAR-X. IEEE International Geoscience and Remote Sensing Symposium (IGARSS).
Fang, L., Maksymiuk, O., Schmitt, M. and Stilla, U., 2013. Improvement of motion estimation of the Taku glacier using spaceborne SAR images. In: Seyfert H (Eds.) Proceedings of 33. Wissenschaftlich-Technische Jahrestagung der DGPF, 22, pp. 62-70.
Fang L,, Maksymiuk O., Schmitt M., and Stilla U., 2014. Limits and Potentials of Comprehensive 2D Glacier Motion Estimation using Satellite SAR Data. In: Seyfert H (Hrsg) 34. Wissenschaftlich-Technische Jahrestagung der DGPF, 23 Fallourd, R., Harant, O., Trouve, E., Nicolas, J., Gay, M., Walpersdorf, A., Mugnier, J., Serafini, J., Rosu, D., Bombrun, L., Vasile, G., Cotte, N., Vernier, F., Tupin, F., Moreau, L. and Bolon, P., 2011. Monitoring temperate glacier displacement by multi temporal TerraSAR-X images and continuous GPS measurements. IEEE Journal of Selected Topics in Applied Earth Observations and Remote Sensing, 4, pp.372-386. Gray, A., Short, N., K.E., M. and Jezek, K., 2001. Velocities and flux of the Filchner ice shelf and its tributaries determined from speckle tracking interferometry. Canadian Journal of Remote Sensing, 27, pp.193-206.
Høgda, K. A., Storvold, R. and Lauknes, T. R., 2010. SAR imaging of glaciers. In: P. Pellikka, and W. G. Rees (Eds). Remote Sensing of Glaciers. Taylor & Francis Group, London: 153.
Joughin, I., Kwok, R. and Fahnestock, M., 1998. Interferometric estimation of three-dimensional ice-flow using ascending and descending passes. IEEE Transactions on Geoscience and Remote Sensing, 36, pp. 25-37.
Joughin, I., Smith, B. and Abdalati, W., 2010. Glaciological advances made with interferometric synthetic aperture radar. Journal of Glaciology, 56, pp.1026-1042.
Kääb, A., 2002. Monitoring high-mountain terrain deformation from repeated air- and spaceborne optical data: examples using digital aerial imagery and ASTER data. ISPRS Journal of Photogrammetry and Remote Sensing, 57, pp. 39-52.
Luckman, A., Quincey, D. and Bevan, S., 2007. The potential of satellite radar interferometry and feature tracking for monitoring flow rates of Himalayan glaciers. Remote Sensing of Environment, 111, pp, 172-181.
Scambos, T. A., Dutkiewicz, M. J., Wilson, J. C. and Bindschadler, R. A., 1992. Application of image cross-correlation to the measurement of glacier velocity using satellite image data. Remote Sens. Environ., 42(3), pp. 177–186. Strozzi, T., Luckman, A., Murray, T., Wegmüller, U. and Werner, C. L., 2002. Glacier motion estimation using SAR offset-tracking procedures. IEEE Transactions on Geoscience and Remote Sensing, 40(11), pp. 2384-2391.
Schubert, A., Faes, A., Kääb, A. and Meier, E., 2013. Glacier surface velocity estimation using repeat TerraSAR-X images wavelet- vs. correlation-based image matching ISPRS Journal of Photogrammetry and Remote Sensing, 82, pp.49-62.
Trouve, E., Vasile, G., Gay, M., Bombrun, L., Grussenmeyer, P., Landes, T., Nicolas, J., Bolon, P., Petillot, I., Julea, A., Valet, L., Chanussot, J. and Koehl, M., 2007. Combining Airborne Photographs and Spaceborne SAR Data to Monitor Temperate Glaciers: Potentials and Limits. IEEE Transactions on Geoscience and Remote Sensing, 45, pp.905-924.