MULTISPECTRAL PHOTOGRAMMETRIC DATA ACQUISITION AND PROCESSING
FOR WALL PAINTINGS STUDIES
A. Pamarta∗, O. Guillonb, S. Faracic, E. Gatteta, M. Genevoisd, J. M. Valletb, L. De Lucaa
a
Mod`eles et simulations pour l’Architecture et le Patrimoine [UMR 3495 CNRS/MCC MAP], Marseille, France bCentre Interdisciplinaire de Conservation et de Restauration du Patrimoine [MCC CICRP], Marseille, France
c´
Ecole Nationale Sup´erieure Louis-Lumi`ere, La Plaine Saint-Denis, France d
Institut de Microbiologie de la M´editerran´ee [FR3479 - IMM], Marseille, France
Commission II
KEY WORDS:Close-range photogrammetry, technical photography, multi-source data, multi-sensors, multispectral, multi-band reg-istration
ABSTRACT:
In the field of wall paintings studies different imaging techniques are commonly used for the documentation and the decision making in term of conservation and restoration. There is nowadays some challenging issues to merge scientific imaging techniques in a multimodal context (i.e. multi-sensors, multi-dimensions, multi-spectral and multi-temporal approaches). For decades those CH objects has been widely documented with Technical Photography (TP) which gives precious information to understand or retrieve the painting layouts and history. More recently there is an increasing demand of the use of digital photogrammetry in order to provide, as one of the possible output, an orthophotomosaic which brings a possibility for metrical quantification of conservators/restorators observations and actions planning. This paper presents some ongoing experimentations of the LabCom MAP-CICRP relying on the assumption that those techniques can be merged through a common pipeline to share their own benefits and create a more complete documentation.
1. INTRODUCTION
1.1 A short review of image-based multimodality for CH studies
The documentation and study framework of Cultural Heritage (CH) objects requires nowadays a wide range of skills, knowl-edge and experts coming from different domains and research fields (Boochs et al., 2014). The CH community is currently try-ing to redefine such interdisciplinar approaches into a complex entanglement of multimodality and interoperability issues. Simi-larly the documentation process is also led by the use of different and complementary scientific imaging techniques which benefit nowadays of the technological advancements in both hardware or software. In the field of wall paintings studies several imag-ing techniques are commonly used firstly to provide documen-tation supports for diagnosis and analysis purposes and subse-quently used for decision making and action planning in term of conservation and restoration. Regardless of the complete 2D/3D sensing technologies the CH community is currently benefiting (NIR, SWIR, TIR, HSI, infrared reflectography, X-ray, RTI, mi-croscopy, tomography...) this paper will focus only two photo-graphic-based techniques ; Technical Photography (TP) and Close-Range Photogrammetry (CRP). Digital CRP has been used widely by CH community to document geometrical features providing accurate footprints of the visible surface of an artifact (i.e. the appearance of this object with a definite spatial resolution and at a given time). Indeed recent development of algorithms in term of automation enables quite straightforwardly to provide decent results as point clouds or orthophotos. The latters are more and more requested for wall paintings studies because it enables met-rical quantification of conservators/restorators observations on a user-friendly 2D supports. However, those CH objects also have been broadly documented for decades with TP imaging, formerly as a film-based technique which turned into digital-based thanks
∗Corresponding author : [email protected]
to the development of digital still cameras (DSCs). It consists of capturing modified spectral pictures among different part of the
Electromagnetic Spectrum(EM). Indeed even common DSCs of-fer possibilities to take pictures under difof-ferent radiations in the range of the full spectrum sensor’s sensitivity (i.e. in a range of 360-1000 nm). Each techniques of the TP imaging collection en-ables to reveal specific and precious information to understand or retrieve the painting layouts and history :
• Visible (VIS); is the common image in visible spectrum and enable to restitute fine details thanks to the high resolution of digital sensors.
• Raking-light (RAK); is obtained by a light source obliquely set (almost parallel) to highlight surface features like re-touches paint losses and brushed strokes providing layering or painting techniques information and their executions.
• Ultraviolet induced fluorescence (UVf); is captured by emit-ting UV radiation on the surface and using a filter to restraint some (UV) wavelength to detect chemical material with a UV fluorescence response in the visible range (e.g. inpaints, varnishes...).
• Reflected ultraviolet (UVr); reproduces the UVf set-up with different filter and require a full spectrum modified sensor to capture non-visible UV reflectance on top of painting sur-faces or to detect specific pigments.
• Infrared (IR); is captured by emitting VIS and IR radiation passing through some surface layers and using a filter to block visible wavelength to reveal under-drawings. It re-quires a modified sensor to acquire some information in the Near-Infrared (NIR).
wave-length to detect chemical material with a IR fluorescence response.
• False color (IRfc/UVfc...); are composite images digitally computed by swapping RGB layers in between IR/UV and VIS to link non-visible areas of interest with a visible false-color relevancy but could be also used for pigment mapping.
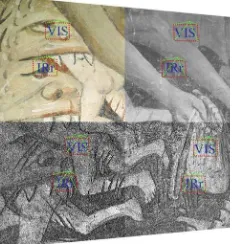
Figure 1: Example of TP documentation onThe Denial of Saint-Peterfresco from the case-study of Notre-Dame des Fontaines chapel; respectively VIS, semi-RAK (from right), RAK (from down), UVf, IR and IRfc
An overview of the literature in this field permits to find all re-quired technical set-up specifications for IR (Bridgman and Lou-Gibson, 1963, Verhoeven, 2008, Cosentino, 2016), UV (Cosentino, 2015) and false-color (Aldrovandi et al., 1993, Aldrovandi et al., 2005) practices. Commonly, CH examination surveys are often done by simultaneous applications of TP techniques and at dif-ferent time range (see Fig.1) according to object’s specificity and context, sometimes including experimental or hybrid techniques (e.g RAK/IR (Cosentino et al., 2014). TP techniques have to be seen as complementary tools enabling by comparison to re-veal similarities and differences in materials or pigments. Most of the time their application is required on different areas of a painted surface necessitating multiples handled acquisition which are hardly reproducible. However a registration issue remains concerning the combined multispectral aspect of TP documenta-tion due to incoherent spatial overlapping (Cosentino, 2016) also known asshort focusingand technically explained by longitudi-nal chromatic aberrationphenomenon (Verhoeven, 2008, Hack-forth, 1960).
Moreover this registration issue could be extended to most of 2D/3D multimodal approaches dealing with cumulated multi- sen-sors, multi-dimensions, multi-spectral and multi-temporal stud-ies, currently explored by several CH oriented research projects; COSCH (Boochs et al., 2014), Scan4Reco (Dimitriou et al., 2016), FIATLUX (Pamart et al., 2016). Hence other interesting works transposed the state of the art in image fusion from other domains like medical imaging and remote-sensing (Verhoeven et al., 2016, Lanaras et al., 2014). However it remains an important gap in high-resolution/accuracy registration of 2D/3D data in a multi-spectral context where some recent works achieved promising re-sults but still using constraining hardware/software requirement (Simon et al., 2010, Chane et al., 2013). Regarding the regis-tration of multimodal images within a photogrammetric process some related works explore possible combination ofSIFT fea-tures andMutual Information(MI) also popularly used in med-ical imaging fusion (Corsini et al., 2013, Shen et al., 2014). Fi-nally, most of multispectral photogrammetric approaches are
re-lated to aerial or airborne surveys rather than close-range ones (Gehrke and Greiwe, 2013). Nevertheless some recent works ex-plored 2D/3D photogrammetric registration for CH objects on Reflected Infrared (Webb, 2015) or Transmitted Infrared (Ben-nett, 2015). Nevertheless while those hybrid photogrammetric approaches focus on a single technique, our current methodology enable to merge several of them.
As far as common photographic equipment is actually used for the data acquisition our ongoing experimentation presented in this paper relies on the assumption that those techniques can be merged through a common pipeline to share their own benefits and create a consolidated documentation. This hypothesis is that a direct multiband photogrammetric pipeline could be reached by combining both methodologies and requirements of TP and CRP techniques, see Fig.2. Therefore, the idea presented in this paper is to combine them through a multiband data acquisition proto-col followed by an optimized data processing to obtain multiband photogrammetric results benefiting of a certain degree of automa-tion, versatility and reproducibility.
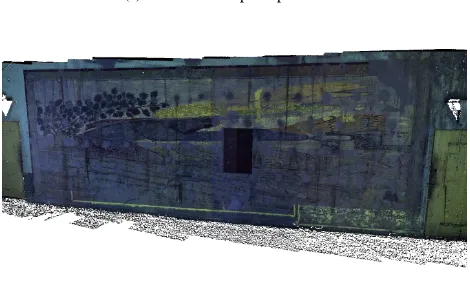
(a) VIS/IR/UVF sparse point cloud
(b) UVf dense point cloud
Figure 2: Results of the multiband data acquisition and process-ing (VIS/IR/UVF) onAnamorphosiscase-study
1.2 Context
This work presents the first results of the LabCom (Common Laboratories) MAP/CICRP, a research partnership in between the
2. MULTIBAND ACQUISITION AND PROCESSING
2.1 Mechanical structure design
After some trials with existing data sets, a solution emerge to im-prove the promising results by creating anad-hocdata acquisi-tion methodology and facilitate the multimodal data registraacquisi-tion, as shown in Fig.2. The necessity of such a system was guided by previous experiments (see Fig.3) showing the relevancy of dedi-cated hardware development to ensure best accuracy possible for the specific purposes of data acquisition campaign (Gattet et al., 2015). Wall paintings can cover extended surfaces or encom-pass a whole inner space thus TP acquisition are done on repre-sentative but restricted samples pre-selected for the purposes of study while interesting information could potentially be revealed everywhere else. Indeed TP documentation need a high repro-ducibility and a rigorous acquisition process thus an handled hy-brid CRP/TP survey would have been too constraining and time consuming.
(a) Multistereo CRP rig (b) Scalable H-RTI dome
Figure 3: Examples of low-cost 3D printed prototype hardware acquisition systems realized by E. Gattet.
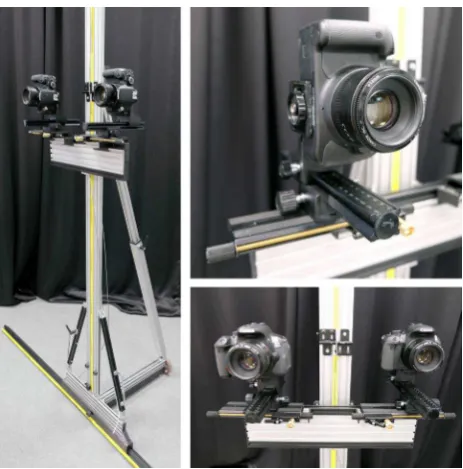
To fit this goal, a versatile mechanical structure has been con-ceived and realized. This also helped to fasten the acquisition stage and prepare the data for a multisensor automatic registra-tion. This system is similar to an XY table adapted for vertical surface and tiltable along the X axis: a plate can support two cameras (or more) and freely move vertically from 50 centime-ters above the ground up to 2.75 mecentime-ters.
Figure 4: Schema of the versatile mechanical structure showing XY (blue/red) translation and X (green) rotation system
The main structure is mounted on 5 meters horizontal traveling rail (divided in 5 elements of 1 meter each and possibly extend-able) parallely set to the surface to acquire. Micrometric plates allows to set the baseline in between cameras for a precise over-lapping while operating a translation along the X axis. The same system has been added on Z axis to correct the position of each sensor to facilitate theshort-focusingeffect (enounced in 1.1). Fi-nally the structure can be tilted up to fifteen degrees past upright to align the focal plane with the slope of the painting surfaces and ensure a correct depth of field setting on the whole surface, even with long focal length or macro photographic equipment. There-fore, the structure can cover a motion area of 11,25m2 in one
set-up in all overlapping and GSD prerequisites. It has been de-signed to be folded flat so as to fit in car trunk. In a near future it will be motorized and robotized for a fully automatic data acqui-sition. Equipped with two similar cameras and lenses remotely controlled, one for visible spectrum and one modified on for IR photography, this system notably allows simultaneous multiband photogrammetric survey in a very short time. This multiband photogrammetric data acquisition RIG ensures the automatic reg-istration process of different sensors thanks to a reproductible protocol. It terms of processing, multispectral acquisition are merged using an optimized script for each spectral domains so as to obtain multiband 2D/3D data continuum.
Figure 5: Views of the mechanical structure ; complete system on the traveling rail (left), close-up on the double micrometric plates (X and Z) with a camera vertically mounted (upper-right) and close-up on Y translation plate with two cameras in horizontal position (bottom-right)
2.2 Data acquisition
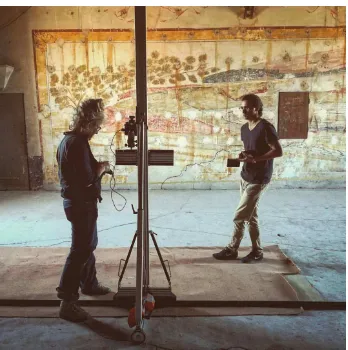
Figure 6: In-situ view of the data acquisition set-up during
Anamorphosiscase-study survey
2.2.1 Settings :
On one hand, best camera settings are chosen and fixed for each spectral acquisition sometimes compromising with both TP and CRP requirements according to the context of the survey (i.e. ob-ject specificity, lighting conditions, environment...). All technical specifications of the equipment (camera and lens) used need to be taken in consideration to guaranty the optimal image quality in terms of signal to noise ratio, aperture/shutter speed, focus, white balance in order to obtain sharp and correctly exposed pictures minimizing post-processing steps (Verhoeven, 2016). Obviously data acquisition are performed in RAW file format which keeps color information for later processing to a specific color space. The images will be post-processed to correct colors and tonal re-sponses for archiving and afterward enabling comparisons within the CICRP documentation database. Furthermore, in a RAW file, the color space is just a meta data from the shooting, and does not limit its potential in any way. However, archiving RAW must be thought with a concern of recording the process and the tools used for RAW processing as applied algorithms change during time and software, the comparison with older acquisition cam-paigns may be difficult (Verhoeven, 2005). Furthermore, archiv-ing RAW files open up to future processarchiv-ing possibilities with new and more efficient tools for better photogrammetric results. On the other hand, every CRP data acquisition needs to answer to a targeted spatial resolution and accuracy (i.e point cloud den-sity, orthophoto definition). Similarly to UAV flight planning, theGround Sample Distance(GSD) computation is used to pre-pare and define off-site the optimum data acquisition protocol and photographic equipment mobilized. It helps to foresee and check the distance to the object, focal length, overlap, XY baselines, numbers of pictures that could be transposedin-situto the struc-ture set-up to obtain the requested or expected results in term spatial resolution and accuracy.
2.2.2 Setup :
The data acquisition is operated as follows, the structure is set ac-cording the GSD planning using laser meter for the parallaxes of the traveling rail and digital level for the coplanarity of the struc-ture to the painted surface. For VIS/RAK and IR acquisition, a lighting system composed of studio flash light and umbrellas (ELINCHROM kit Ranger RX Speed AS) is disposed to obtain a diffuse and homogeneous render on the area to acquire. Flashes are radio controlled and their power is set to discard any effect of the ambient light. The system is powered by batteries to be fully
autonomous according electric supply conditions of data acquisi-tion sites. Colorimetric calibraacquisi-tion is done using a color checker in a preliminary picture for each spectral acquisition. Contrarily to VIS and IR there is not official standardized reference exist yet for UV calibration even if an aid for color balancing can be done using theAIC PhDtarget completed with known samples of emit-ters activated under UV radiation (Cosentino, 2015). Even tough it remains an open-issue concerning the time life of those UV charts, a short-term reliable solution could be the use of Target-UVTMandUV-GrayTMprovided byUV InnovationTM despite of its cost. Once the cameras are properly installed their settings are manually fixed and will be re-used to acquire all necessary data set for geometric camera calibration. A wireless remote control system (CamRanger) is used to control, preview and shoot all along the acquisition process.
2.2.3 Shooting :
Multi-spectral acquisitions could be done simultaneously (VIS/IR) or sequentially (VIS,RAK,UVf) following the protocol fastly and straightforwardly displacing the structure along the millimetered traveling rail defining the X axis, then rising the cameras plate along the Y axis. This acquisition system allows to reproduce quite precisely, with a different technique, the matrix protocol ex-tracted from the GSD calculation according to a predefined pho-togrammetric overlap and baseline. It also has the advantage that a protocol could be repeated at a different time range to create multi-temporal data set for comparison and assessment of degra-dation or restoration process (Peteler et al., 2015).
The visible light (VIS) from 380nm to 780nm is acquired with a non-modified camera with the same lighting equipment used for RAK and IR. Near-infrared (NIR) acquisitions are ranged from 780nm to 1000nm, the limits depending of the transmission of the filter used (see Fig.7) and the characteristics of the camera. The camera needs to be modified in order to be sensitive to wave-lengths beyond the visible. The hot filter on top of the sensor is removed and may be replaced with a clear glass preventing dust. NIR creates a response in the red channel only, therefore pictures will be desaturated in post-production. Afterwards, UV lamps are installed after the interior space has been occluded from sunlight. UVf acquisitions are done in the visible spectrum under ultravio-let sources (16 tubes typePhilips TL-D 36W BLB, distributed in 2 ramps of 8 tubes). The wavelengths emitted by the surface under this light are photographed and the colors of the different fluores-cence can lead to assumptions about the materials used and the history of modifications. It is important, as under visible light, to keep the post-production of the pictures as identical as possible between waves of acquisition in order to compare them properly. This technique require long time exposure (around 30s) with a classic DSLR but high sensitivity sensor such asFuji X-Trans
will be used soon to slightly decrease the time required for the acquisition and gain in image quality but also because UV expo-sure could damage the surface which are not protected by varnish unlike other painting supports (e.g. canvas, wood...).
(a) Wratten 87 filter (IR) (b) Wratten 2E filter (UV)
2.3 Data Processing
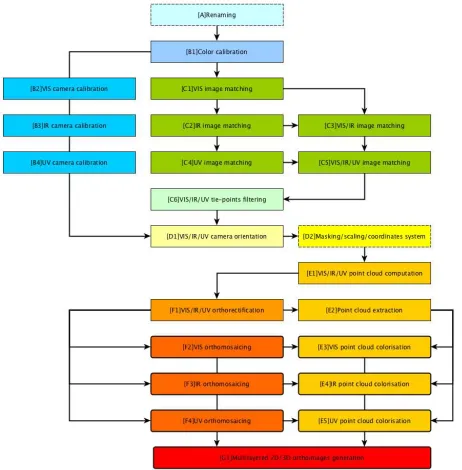
Multispectral photography implies getting information in differ-ent part of the EM thus some pre-processing stages are neces-sary but not detailed below. Some of the TP acquisitions have been implemented so far on different case-studies: VIS, RAK, IR, UVf. Other like IRf and UVr will be added further to com-plete this multiband photogrammetric documentation using the work flow described in Fig.8 below. From a technical point of view, the whole pipeline is operated thanks to the flexible and open-source photogrammetric tool chain Pastis-Apero-MicMac
(Deseilligny and Clery, 2011). This software solution appears to be the most relevant choice to fit and optimize data processing with the peculiar hardware used for data acquisition. Moreover it is giving enough degrees of freedom and advanced parametriza-tion to make possible this multispectral CRP-based data registra-tion in an automated way.
Figure 8: Diagram of the pipeline described below
2.3.1 Pre-processing :
Data are semi-automatically renamed (Fig.8[A])in-situby modi-fying naming and numbering setting directly through the camera oroff-siteby a metadata-aware scripting method, to embed the technique used (i.e. VIS, IR, UV added as a prefix). This is help-ful for file management all along the pipeline but also compulsory to be injected into an automated data processing. Additionally, images could be renamed according to the data acquisition pro-tocol to embed their respective position in gridded system where rows are alphabetical and columns numerical (e.g. VIS-A-06.tif) in order to optimize the processing step such as 2D image match-ing.
A special care is given to color calibration (Fig.8[B1]) to ensure colorimetric accuracy along different sensors, lenses, lightning conditions and spectral sensitivities. Raw data are batched to fit precisely color space, white balance and exposure with min-imal modifications and exported inTiff file format without com-pression for an optimum image quality. As data have been ac-quired using a strict parallel axis acquisition protocol (i.e. with-out oblique images) self-calibration using those data should be avoided. The geometrical calibration of cameras is done using an
initial calibration data set takenin-situfor each sensor and fixed settings (aperture, focus, distance). The demandingFraser pho-togrammetric camera calibration model is used to ensure the low-est error of reprojection (i.e. below the 1 pixel or less)(Fig.8[B2-B3-B4]).
2.3.2 Image matching :
At this step data has been properly pre-processed to be integrated into an incremental photogrammetric process. At the current stage of the development, tie-points are derivated from the clas-sicalSIFTfeatures, but other options (Local Contrast Enhance-ment, Wallis filter) or descriptors could be implemented to gain in velocity (ASIFT, SURF) or robustness (Maximal Self-Dissimilarities). Thanks to the controlled data acquisition image matching is straight-forward using an incremental approach ; sequentially in between a spectral acquisition (Fig.8[C1-C2-C4]) and then across several of them (Fig.8[C3-C5]). While all image blocks have been matched, a tie-points filtering step is added to the pipeline (Fig.8[C6]) to discard inter-spectral false matches and to decrease uncertainty in calibration and alignment.
2.3.3 Cameras orientation :
Images are spatialized using a two-steps approach (Fig.8[D1]). Firstly, data are roughly oriented using anSfM method based on triplets and tri-focal constraint to provide orientation files for each pictures. Secondly, the global orientation is refined using the classicalbundle-adjustmentmethod and giving as input both initial camera calibration and orientation calculated previously. A sparse point cloud is generally computed to verify and val-idate camera positions (see Fig.2(a)). Moreover optional and manual steps could be integrated to create a 3D mask from the sparse point cloud or to define scaling and coordinates system (Fig.8[D2]).
2.3.4 Geometric registration :
An automatic dense matching algorithm is used on all pictures to obtain a first raw and temporary point cloud to a given den-sity (e.g. 1 point for 4 pixels) and according to the GSD re-quirement (Fig.8[E1]). This temporary result is used for a per-picture orthorectification intermediary process, preparing data for orthophoto production (Fig.8[F1]). Once every pictures have been orthorectified according to a reference plane, automatically de-fined byRANSACplane detection for clean and planar surface or user-defined for more complex geometry (thus [D2] manual input becomes mandatory), they are implicitly stored all together in the same space coordinates reference system.
2.3.5 Multiband 2D/3D output generation :
An orthophotomosaic is then computed for every spectral acquisi-tion to have a perfect multispectral per-pixel matching (Fig.8[F2-F3-F4]). A final point cloud is extracted from the orthophoto to create a continuum in between 2D pixel coordinates and 3D points (Fig.8[E2]). This point cloud is colored by each spec-tral orthophomosaics (as is Fig.2(b)) to obtain a multiband point cloud (Fig.8[E3-E4-E5]).
for each spectral domain. Our goal is to compile all those in-formation and possibly completed them with other useful fea-tures calculated from different descriptors (e.g. ambient occlu-sion, roughness, curvatures, shaded maps, hypsometric values...), as shown in Fig.11 but also with other attributes coming from automatic, semi-automatic or manual segmentation and their in-tercorrelation with all relevant layers, as detailed in Fig.12.
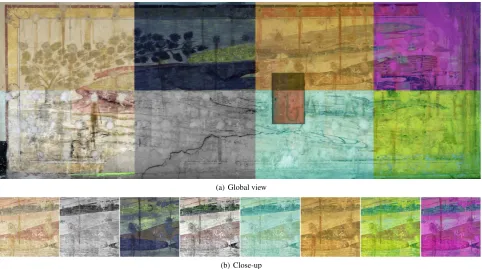
(a) Global view
(b) Close-up
Figure 9: Example of multi-spectral orthophoto (VIS/IR/UVF/Composite),Anamorphosiscase-study
3. CONCLUSIONS
3.1 Results and future works
At the current stage of development and regarding to the first re-sults obtained, we proved the benefits of a relevant methodology from a dedicated data acquisition system to an optimized data processing providing innovative and efficient solution for the doc-umentation, studies and analysis of wall-paintings. Nevertheless, this pipeline will continue to be improved toward an expected dissemination into conservation/restoration routines.
The use of orthophotographies in multispectral analysis helps to superimpose precisely multispectral information for easy reading and comparison asked by conservators and restorators. It also makes further correction easier on a whole assembled image in-stead of a collection of unstitched images. If CRP processing is done on RAW files instead ofTiffit opens possibilities to modify or update outputs without reprocessing. For example, applying a global contrast curve can be used as a tool for easier reading of underlying elements. An other interesting application is the possibility to compute straightforwardly false-color IR and UV from the orthophoto, instead of the previous manual technique which include inaccurate pixel shifting in between RGB layers (Aldrovandi et al., 2005, Fent and Meldrum, 2016). From the assumption that only the red channel is used in NIR. The visi-ble fluorescence under ultraviolet light will generally be captured under the green or blue channel, we imagined a synthetic mul-tispectral false-color image with the red channel of the NIR im-age, green channel of the UV imim-age, and a third channel from the VIS image or inversely (Fig.10). Infrared false-color images are made assembling blue and green channel from the visible and recombining them with the red channel of the NIR image while swapping channel order.
Therefore, this multi-layered orthophotomosaic offers wide pos-sibilities in term of false-color image generation while 18 RGB
Figure 10: Example of synthetic VIS/IR/UV false-color or-thophotomosaic ; on the left IR(R)/UV(G)/VIS(B), on the right IR(R)/VIS(B)/UV(G) onAnamorphosiscase-study
combination is possible within IRfc or UVfc classical procedure. It could also open new lead toComputational Photography tech-niques and more precisely in the field ofImage Processingby explorating multiband mixing and correlations for features ex-tractions similarly as it could be made on hyperspectral pixels (Doneus et al., 2014). As a basic example, composite images have been processed using MeanorMedian (possibly ponder-ated by a polynomial approach) among each pixel of different RGB layers and orthoimages assuming that those images as no scientific values it could nevertheless enhance or highlight some specific features to help restorators (Fig.9, 10 & 13).
Besides all of the technical considerations in term of computa-tional exploration cited above, one final step will be to discuss possibilities for an operative and user-friendly visualisation sys-tem so as to enable intercorrelation and transfer of features among this complex multi-layered data set. The goal of this future work could be reachable by creating a multilayered data visualisation and annotation system or using existing solutions such as; Spa-tial Image analysis and Viewing Tool aka SIVT developed by
i3Mainz(Wefers et al., 2015), Toolbox for Archaeological Im-age Fusion aka TAIFU developed byLudwig Boltzmann Institute
(Verhoeven, 2015) or the Image-based 3D annotation cloud ser-vice aka AIOLI in development byMAP-CNRS(Manuel et al., 2016). Indeed as bottom-up intercorelation approaches appears to be exponential our idea is to involve CH experts to experiment and reveal by themselves what could be the most relevant combi-nations for their studies purposes. Hence the idea to offer an inter-active tool for analysis guided by cumulated expert observations (even though it implies a trial and error process) rather than a blind and unsupervised learning only computer-driven approach. While the semantic enrichment of CH 2D/3D documentation re-mains a challenge in the near future, we rely on the idea that integrating expert’s knowledge could be the most relevant way to explore all 2D/2,5D image processing possibilities (Verhoeven et al., 2016) or 3D multispectral feature extractions (Del Pozo et al., 2016, Lerma, 2005, Bianco et al., 2011).
Figure 12: Structure of the multi-layered output: I.) Set the matrix of pixels locations defining the local xy coordinates from the orthophotomosaic. II.) Gather colorimetric information composed of RGB layer for each spectral band (e.g. VIS, IR, UV...) or composite images. III.) Concern geometric information like 3D world space coordinates (X;Y;Z) and points normal (Nx;Ny;Nz). IV.) Store additional features extracted from any 2D or 3D descriptors (n) likeAmbient Occlusion(AO),Roughness(R) orCurvatures(k) can be juxtaposed in this section. V.) Enable to complete the data set with other kind of attributes like segmentation methods usingMean Shift/K-Meansclusters computed on colorimetric/geometric layers (S), hand-made masks (M) or any relevant analytic combinations (in
)
(a) Global view
(b) Close-up
Figure 13: Multilayered orthophoto generated onAnamorphosiscase-study : (a) Mosaic view of TP techniques implemented and some colorimetric computational possibilities; (b) Samples extracted from the same area (from the left to the right), VIS, IR, UVf, Median composite, IRfc, UVf composite and synthetic VIS/IR/UV false-color
3.2 Perspectives
We believe that the continuum of information created by this multiband photogrammetric data acquisition and processing could be a new step in the field of investigation of multimodal data cor-relation (Fig.12) for CH objects studies. Even tough our method-ology is limited to geometrically simple morphologies (i.e. wall-paintings, frescoes...), it succeed to provide so far a complete, traversal and interoperable data set for conservation/restoration works. Finally one could foresee some possible and interesting applications in term of automatic semantic annotations propaga-tion, to linkin-situ orin-lab observations and action planning
supported by mobile devices development for real-time sharing of qualitative and quantitative aspects useful for the follow-up of transformation dynamics of our heritage.
REFERENCES
Aldrovandi, A., Buzzegoli, E., Keller, A. and Kunzelman, D., 2005. Investigation of painted surfaces with a reflected uv false color technique. Proceedings of Art.
Bennett, T., 2015. Photogrammetry and transmitted infrared imaging to document the support of a 19th c. british landscape painting. COSCH e-Bulletin, http://cosch.info/bulletin-2-2015.
Bianco, S., Colombo, A., Gasparini, F., Schettini, R. and Zuffi, S., 2011. Applications of spectral imaging and reproduction to cultural heritage. Digital Imaging for Cultural Heritage Preserva-tion pp. 183–209.
Boochs, F., Bentkowska-Kafel, A., Degrigny, C., Karaszewski, M., Karmacharya, A., Kato, Z., Picollo, M., Sitnik, R., Tr´emeau, A., Tsiafaki, D. et al., 2014. Colour and space in cultural her-itage: Interdisciplinary approaches to documentation of material culture*. International Journal of Heritage in the Digital Era 3(4), pp. 713–730.
Bridgman, C. F. and Lou-Gibson, H., 1963. Infrared lumines-cence in the photographic examination of paintings and other art objects. Studies in Conservation 8(3), pp. 77–83.
Chane, C. S., Schtze, R., Boochs, F. and Marzani, F. S., 2013. Registration of 3d and multispectral data for the study of cultural heritage surfaces. Sensors 13(1), pp. 1004.
Corsini, M., Dellepiane, M., Ganovelli, F., Gherardi, R., Fusiello, A. and Scopigno, R., 2013. Fully automatic registration of image sets on approximate geometry. International journal of computer vision 102(1-3), pp. 91–111.
Cosentino, A., 2015. Practical notes on ultraviolet technical pho-tography for art examination. Conservar Patrim´onio 21, pp. 54.
Cosentino, A., 2016. Infrared technical photography for art ex-amination. e-Preservation Science 13, pp. 1–6.
Cosentino, A., Gil, M., Ribeiro, M. and Di Mauro, R., 2014. Technical photography for mural paintings: the newly discovered frescoes in aci santantonio (sicily, italy). Conservar Patrim´onio 20, pp. 23–33.
Del Pozo, S., Herrero-Pascual, J., Felipe-Garc´ıa, B., Hern´andez-L´opez, D., Rodr´ıguez-Gonz´alvez, P. and Gonz´alez-Aguilera, D., 2016. Multispectral radiometric analysis of fac¸ades to detect pathologies from active and passive remote sensing. Remote Sensing 8(1), pp. 80.
Deseilligny, M. P. and Clery, I., 2011. Apero, an open source bun-dle adjusment software for automatic calibration and orientation of set of images. ISPRS-International Archives of the Photogram-metry, Remote Sensing and Spatial Information Sciences.
Dimitriou, N., Drosou, A. and Tzovaras, D., 2016. Scan4Reco: Towards the Digitized Conservation of Cultural Heritage Assets via Spatiotemporal (4D) Reconstruction and 3D Printing. In: C. E. Catalano and L. D. Luca (eds), Eurographics Workshop on Graphics and Cultural Heritage, The Eurographics Association.
Doneus, M., Verhoeven, G., Atzberger, C., Wess, M. and Ruˇs, M., 2014. New ways to extract archaeological information from hy-perspectral pixels. Journal of Archaeological Science 52, pp. 84– 96.
Fent, L. and Meldrum, A., 2016. A foveon sensor/green-pass fil-ter technique for direct exposure of traditional false color images. Journal of Imaging 2(2), pp. 14.
Gattet, E., Devogelaere, J., Raffin, R., Bergerot, L., Daniel, M., Jockey, P. and De Luca, L., 2015. A versatile and low-cost 3d acquisition and processing pipeline for collecting mass of archae-ological findings on the field. The International Archives of Pho-togrammetry, Remote Sensing and Spatial Information Sciences 40(5), pp. 299.
Gehrke, R. and Greiwe, A., 2013. Multispectral image capturing with foveon sensors. International Archives of the Photogramme-try, Remote Sensing and Spatial Information Sciences 1, pp. W2.
Hackforth, H. L., 1960. Infrared radiation. McGraw-Hill.
Lanaras, C., Baltsavias, E. and Schindler, K., 2014. A compar-ison and combination of methods for co-registration of multi-modal images. In: Proceedings of 35th Asian Conference on Remote Sensing, Nay Pyi Taw, Myanmar, Vol. 2731.
Lerma, J. L., 2005. Automatic plotting of architectural facades with multispectral images. Journal of surveying engineering 131(3), pp. 73–77.
Manuel, A., V´eron, P. and Luca, L. D., 2016. 2D/3D Seman-tic Annotation of Spatialized Images for the Documentation and Analysis of Cultural Heritage. In: C. E. Catalano and L. D. Luca (eds), Eurographics Workshop on Graphics and Cultural Heritage, The Eurographics Association.
Pamart, A., Guillon, O., Vallet, J.-M. and Luca, L. D., 2016. To-ward a Multimodal Photogrammetric Acquisition and Process-ing Methodology for MonitorProcess-ing Conservation and Restoration Studies. In: C. E. Catalano and L. D. Luca (eds), Eurographics Workshop on Graphics and Cultural Heritage, The Eurographics Association.
Peteler, F., Gattet, E., Bromblet, P., Guillon, O., Vallet, J.-M. and De Luca, L., 2015. Analyzing the evolution of deterioration patterns: A first step of an image-based approach for comparing multitemporal data sets. In: 2015 Digital Heritage, Vol. 2, IEEE, pp. 113–116.
Shen, X., Xu, L., Zhang, Q. and Jia, J., 2014. Multi-modal and multi-spectral registration for natural images. In: European Con-ference on Computer Vision, Springer, pp. 309–324.
Simon, C., Huxhagen, U., Mansouri, A., Heritage, A., Boochs, F. and Marzani, F. S., 2010. Integration of high resolution spatial and spectral data acquisition systems to provide complementary datasets for cultural heritage applications. In: IS&T/SPIE Elec-tronic Imaging meeting, Vol. 7531number 1, San Jose, United States, pp. 75310L–1, 75310L–9.
Verhoeven, G., 2005. Its all about the format. a raw picture of photographing raw. In: Proceedings of AARG Annual Confer-ence, September 19-21 2005.
Verhoeven, G., 2008. Imaging the invisible using modified dig-ital still cameras for straightforward and low-cost archaeologi-cal near-infrared photography. Journal of Archaeologiarchaeologi-cal Science 35(12), pp. 3087–3100.
Verhoeven, G., 2015. Taifu: toolbox for archaeological image fusion. In: AARG 2015, AARG, pp. 36–36.
Verhoeven, G., 2016. Basics of photography for cultural heritage imaging. In: 3D recording, documentation and management of cultural heritage, Whittles Publishing, pp. 127–251.
Verhoeven, G., Nowak, M. and Nowak, R., 2016. Pixel-level im-age fusion for archaeological interpretative mapping. In: 8th In-ternational Congress on Archaeology, Computer Graphics, Cul-tural Heritage and Innovation (ARQUEOL ´OGICA 2.0), Editorial Universitat Polit`ecnica de Val`encia, pp. 404–407.
Webb, E. K., 2015. Reflected infrared imaging revisiting the fun-damentals. In: 2015 Digital Heritage, Vol. 1, IEEE, pp. 51–54.