UNDERSTANDING URBAN TRAFFIC FLOW CHARACTERISTICS FROM
THE NETWORK CENTRALITY PERSPECTIVE AT DIFFERENT
GRANULARITIES
P. X. Zhao a, S. M. Zhao a, *
a
School of Remote Sensing and Information Engineering, Wuhan University, Wuhan, China – (pxzhao, smzhao)@whu.edu.cn
Commission II, WG II/3
KEY WORDS: taxi trajectory, granularity, network centrality, correlation analysis
ABSTRACT:
In this study, we analyze urban traffic flow using taxi trajectory data to understand the characteristics of traffic flow from the network centrality perspective at point (intersection), line (road), and area (community) granularities. The entire analysis process comprises three steps. The first step utilizes the taxi trajectory data to evaluate traffic flow at different granularities. Second, the centrality indices are calculated based on research units at different granularities. Third, correlation analysis between the centrality indices and the corresponding urban traffic flow is performed. Experimental results indicate that urban traffic flow is relatively influenced by the road network structure. However, urban traffic flow also depends on the research unit size. Traditional centralities and traffic flow exhibit a low correlation at point granularity but exhibit a high correlation at line and area granularities. Furthermore, the conclusions of this study reflect the universality of the modifiable areal unit problem.
1. INTRODUCTION
The rapid development of GNSS and communication technology has resulted in the emergence of large amounts of GPS trajectory data, thereby facilitating the analysis of urban dynamics (Ahas et al., 2010; Jia and Jiang, 2012; Kang et al., 2014). Taxi trajectory data, which is a common GPS trajectory data, record urban transportation and reflect citizens’ daily travel; such information has been extensively used in traffic state assessment (Kerner et al., 2005; Jiang, 2009; Castro et al., 2012). Vehicle mobility is restricted by the road network, and traffic flow is a traffic phenomenon dependent on the road network; hence, this relationship reflects the process of moving vehicles along the road. Therefore, urban traffic flow is considerably influenced by the road network. In recent years, numerous studies have extensively analyzed urban traffic flow from the road network perspective. In particular, network centrality is an important indicator of road network characteristics and has been broadly used in the analysis of urban traffic flow. Jiang et al. (2008) studied the formation of self-organized natural roads from the perspective of complex network, and analyzed the correlation between road network centrality and traffic flow based on the joint principles. Betweenness centrality is utilized to characterize urban traffic flow, and the results demonstrate that the traditional betweenness centrality is unsuitable for analyzing the dynamic process of traffic flow and needs to be further improved (Kazerani and Winter, 2006a). Kazerani and Winter (2006b) implemented a modified betweenness centrality to study the dynamic and temporal aspects
of people’s travel demands. The results indicate that modified centrality is better at and more suitable for predicting traffic flow than the traditional index. Gao et al. (2013) maximized taxi trajectory data in evaluating actual traffic volumes and analyzed the feasibility of predicting urban traffic flow using betweenness centrality. In their research, the traditional betweenness centrality is not a good predictor because it disregards the distance decay effect.
In summary, the current research mainly concentrated on the study of single granularity and made the road or segment as research units with limited regard for the traffic flow characteristics at different granularities. The present study also utilizes previous research in analyzing the characteristics of urban traffic flow at different granularities from the perspective of road network centrality. Multi-granularity analysis is convenient for people to understand urban traffic at different levels. In the present study, we utilized point, line, and area granularities in analyzing urban traffic flow; the three granularities correspond with intersection, road, and community, respectively. The influence of the road network structure on urban traffic flow is detected at different granularities by analyzing the correlation between centrality index and traffic flow.
directions for future research.
2. STUDY AREA AND DATA PREPROCESSING This research selects the core urban area in Wuhan Wuhan City. The experiment employs the trajectories of 9,700 taxis and collected successively on a holiday (May 1, 2014), workday (Wednesday, May 7, 2014), and weekend (Saturday, May 10, 2014) in Wuhan City. The data canfacilitate the comparison and analysis of urban traffic flow in different types of days. The taxis involved transmit their location and other attributes every 40 seconds.
Data preprocessing is mainly involved in taxi trajectory and road network data. The preprocessing of the taxi trajectory data primarily includes extraction by time span, data cleaning, and map matching. Meanwhile, road network data preprocessing includes removal of the road segment without names, joint assessed at different granularities. The basic process is as follows. First, the taxi trajectory data is employed to evaluate traffic flow at different granularities. Second, the centrality indices are calculated at different granularities using an undirected graph
,
G V E as basis to model the road network in different granularities. Finally, the correlation analysis between the centrality index and the corresponding urban traffic flow is performed. A brief introduction of network centrality indices in this study follows. Network centrality is an effective method to quantify the significance of nodes or edges in the network. This method was initially applied in measuring the influence of a role in human communication but gradually changed from the social to the spatial network (e.g., road network) (Freeman, 1979; Crucitti et al., 2006). Network centrality mainly includes degree, closeness, betweenness, eigenvector, and PageRank centralities, among others (Sousa and Kropatsch, 2015). In this study, we select the degree, betweenness, and PageRank centralities as the analysis indices.
Degree centrality refers to the number of edges connected to a node, and is the most common measurement of centrality. For an undirected graph
,
degree centrality is normalized, which can be used to indicate the proportion of other nodes adjacent tonodev. The calculation formula is as follows:
deg
importance of node v via the number of the shortest paths between any two nodes that pass through it. The betweenness centrality of node v can be calculatedPageRank centrality is previously used in search engines to search for significant web pages (Brin and Page, 1998), and gradually applied later to the measurement of nodes in a road network (Zhao et al., 2015). PageRank centrality is defined as follows:
qAw
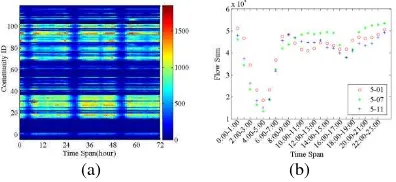
Figure 1(a) presents the traffic flow of each intersection with respect to every time span; the color of each pixel represents the traffic flow volume. Figure 1(b) displays the distribution of the total traffic flow in each period. The majority of traffic flow at the intersections is below 200, and the low peak period is concentrated between 2:00 and 6:00 every day (Figure 1(a)). The sum of traffic flow in each period exhibits a similar distribution. The low peak period also focuses on the 2:00–6:00 interval because residents rarely go out during this period (Figure 1(b)), which is consistent with the conclusion in Figure 1(a). The 17:00–18:00 interval presents another low peak period, which is the time of the taxi shift.
(a) (b)
Figure 1. Traffic flow of intersections in each period 4.1.2 Road: The number of taxis in each road provides the traffic flow statistics at line granularity, including the traffic flow in each road and the sum of traffic flow in all roads (Figure 2). The majority of the traffic flow in a single period is below 500; the low peak period is also concentrated in the 2:00–6:00 interval every day (Figure 2(a)). The sum of traffic flow in each period shows a similar distribution, and the low peak period focuses on the 2:00–6:00 interval (Figure 2(b)), which is consistent with the conclusion in Figure 1.
(a) (b)
Figure 2. Traffic flow of roads in each period
4.1.3 Community: We initially determine the communities before computing the traffic flow in each community. In the current study, we use a classical community structure discovery and GN algorithms to detect the community structure (Girvan and Newman, 2002). After extracting the communities, the number of taxis in each community provides the traffic flow statistics at area granularity, including the traffic flow in each community and the sum of traffic flow of all communities. Figure 3(a) shows that the traffic flow in a few communities goes beyond 1,000 in a single time span, and the daily low peak period is concentrated in the 2:00–6:00 interval. The total community traffic flow in each period exhibits a similar distribution with the total traffic flow of intersection and road.
(a) (b)
Figure 3. Traffic flow of communities in each period
4.2 Calculation of the network centrality
4.2.1 Centrality analysis at point granularity: First, centrality analysis of the point granularity is performed. Formulas (1), (2), and (3) are used to compute the degree, betweenness, and PageRank centralities, respectively, of each intersection. The intersections are divided into five classes according to their centrality values and visualized in a map (Figure 4).
(a) Degree (b) Betweenness (c) PageRank
Figure 4. Spatial distribution of centrality in the intersections Figure 4(a) shows that the intersections with degree
centrality values between 0.0021 and 0.0028 occupy a large area, which corresponds to the yellow points. The intersections with high values of betweenness centrality are located in Wuhan Yangtze Grand Bridge, Wuhan Yangtze River Tunnel, and Linjiang Road,
population-accumulating districts in this city that are separated and located on the two sides of the river. Therefore, Wuhan Yangtze Grand Bridge and Yangtze River Tunnel have become major transportation hubs between Hankou and Wuchang. Figure 4(c) shows that the intersections with PageRank centrality values between 0.0006 and 0.0008 account for over 50%, which correspond to the yellow points and consistent with the spatial distribution of degree centrality.
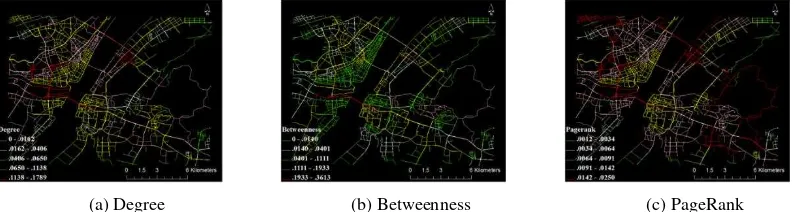
4.2.2 Centrality analysis at line granularity: Subsequently, centrality analysis of line granularity is conducted. Formulas (1), (2), and (3) are used to calculate the degree, betweenness, and PageRank centralities, respectively, of each road. Figure 5 shows that the roads are divided into five classes according to their centrality indices and visualized in a map.
(a) Degree (b) Betweenness (c) PageRank
Figure 5. Spatial distribution of centrality in the roads Figure 5(a)shows that the roads with high values of
degree centrality are mainly located in Jiefang Road, Jianshe Road, Linjiang Road, Heping Road, Youyu Road, and Xiongchu Road, among others; these areas are displayed as red and pink lines. These roads also intersect with many roads to relieve urban traffic flow. Furthermore, most of the roads with high degree centrality are distributed and extended along the Yangtze River, thereby indicating that this river considerably affects the road network structure of Wuhan City. The roads with high betweenness centrality are mainly located in Jiefang Road, Linjiang Road, Zhongshan Road, Heping Road, Youyi Road, Wuhan Yangtze Grand Bridge, and Wuhan Yangtze River Tunnel,
among others; these areas correspond to the red and pink lines in Figure 5(b). The roads with high PageRank centrality are mainly distributed in Jiefang Road, Jinghan Road, Zhongshan Road, Heping Road, and Yingwu Road, among others; these roads are illustrated as red lines in Figure 5(c).
4.2.3 Centrality analysis at area granularity: Finally, we analyze the centrality of area granularity. Formulas (1), (2), and (3) are used to calculate the degree, betweenness, and PageRank centralities, respectively, of each community. The communities are divided into five classes according to their centrality indices and visualized in a map (Figure 6).
(a) Degree (b) Betweenness (c) PageRank
Figure 6. Spatial distribution of centrality in the communities The communities with high degree centralities are
mainly located in the Wuguang Business District, Xudong Business District, and Hanzheng Street, and are displayed as red areas in Figure 6(a). Communities with high betweenness centralities are concentrated on Hanzheng Street, Xudong, Zhongnan, and Luxiang, among others, and correspond to the red and pink areas in Figure 6(b). These regions are also business districts in Wuhan City. Figure 6(c) shows that communities with high PageRank centrality are mainly located in Xudong, Wuguang, Hanzheng Street, and Jiedaokou, among others, and correspond to the
red areas.
4.3 Correlation between traffic flow and network centrality
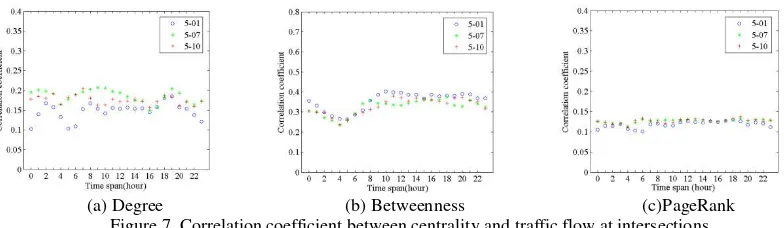
(a) Degree (b) Betweenness (c)PageRank Figure 7. Correlation coefficient between centrality and traffic flow at intersections Figure 7 shows that the traditional centrality and
traffic flow in the intersections exhibit a low correlation. The mean value of the correlation coefficient between traffic flow and betweenness centrality is 0.34 in all periods, which is higher than that of the degree (0.17) and PageRank (0.12) centralities. Furthermore, the correlation coefficient between traffic flow and centrality during different types of days and time spans does not exhibit an apparent difference, thereby indicating that time
correlation generally exists in the urban traffic flow. Moreover, traffic flow is hardly affected by the holidays, workdays, and weekends.
4.3.2 Correlation analysis at line granularity: The correlation analysis between them and urban traffic flow is conducted on the basis of the centrality indices of each road. Figure 8 shows that the correlation coefficient between traffic flow and centrality indices at line granularity is obtained.
(a) Degree (b) Betweenness (c) PageRank
Figure 8. Correlation coefficient between centrality and its traffic flow at roads Figure 8 shows that the traditional road centrality and
traffic flow exhibit a high correlation, thereby indicating that the centrality index can be used to analyze the road traffic flow. This finding is consistent with the conclusion in the literature (Jiang et al., 2008). The mean values of the correlation coefficient between traffic flow and the degree, betweenness, and PageRank centralities in every period are 0.73, 0.72, and 0.76, respectively. These coefficients are higher than those at point granularity. Furthermore, apart from the low peak displayed in the 5:00–7:00 period
during holidays, the correlation coefficient between traffic flow and centrality during other time spans on different types of days does not exhibit an apparent difference.
4.3.3 Correlation analysis at area granularity: Finally, the correlation analysis between them and urban traffic flow is performed on the basis of the centrality indices of each community. The correlation coefficient between traffic flow and centrality indices at area granularity is obtained (Figure 9).
(a) Degree (b) Betweenness (c) PageRank
Figure 9. Correlation coefficient between centrality and its traffic flow at communities Figure 9 shows that the traditional centrality and
traffic flow in the communities also exhibit a high correlation, thereby indicating that the centrality can be used in analyzing the traffic flow in the community. The mean values of the correlation coefficient between traffic flow and the degree, betweenness, and PageRank centralities in every period are 0.76, 0.55, and 0.74, respectively. The correlation coefficient between betweenness centrality and traffic flow is
5. DISCUSSION AND CONCLUSIONS In this study, we propose a method of urban traffic flow analysis at different granularities on the basis of taxi trajectory data. Adopting taxi trajectory data to analyze and evaluate urban traffic flow at different granularities enabled us to further assess how the road network structure influences urban traffic flow from the network centrality perspective. The main contributions of this study are as follows.
First, using floating car data to evaluate traffic flow at different granularities, including intersection, road, and community, enabled us to determine that urban traffic flow shows a similar trend at different granularities every day. No apparent difference is evident among holidays, workdays, and weekends. Second, the spatial distributions of urban road network centrality at different granularities are compared. Network centrality changes with the size of the research units, thereby indicating that the modifiable areal unit problem (MAUP) is also prevalent in road networks. Third, the results of correlation analysis show that urban traffic flow is relatively influenced by the road network structure and also depends on the size of the research unit. The traditional centralities and traffic flow of intersections show a low correlation. The average values of correlation coefficients of traffic flow and the degree, betweenness, and PageRank centralities in all periods are 0.17, 0.34, and 0.12, respectively. The traditional centralities and traffic flow at line granularity show a high correlation. The average correlation coefficients of traffic flow and the degree, betweenness, and PageRank centralities in all periods are 0.73, 0.72, and 0.76, respectively. Similarly, the traditional centrality and traffic flow at area granularity also show a high correlation. The average correlation coefficients of the traffic flow and the degree, betweenness, and PageRank centralities in all periods are 0.76, 0.55, and 0.74, respectively. The traditional centrality cannot effectively describe traffic flow at point granularity. However, traffic flow can be described at the line and area granularities. This finding further reflects the universality of the MAUP effect.
Traditional centrality merely considers the topological characteristics of the road network anddisregards its geometric characteristics, such as road grade, road length, and other attributes. These geometric characteristics also affect road traffic flow. Therefore, our future research will be directed toward the centrality indices that consider both the topological and geometrical characteristics of the road network. We will also analyze whether their values correlate with traffic volume that is superior or inferior to those that merely consider topology connections.
REFERENCES
[1] Ahas, R., Aasa, A., Silm, S., Tiru, M., 2010. Daily rhythms of suburban commuters’ movements in the tallinn metropolitan area: case study with mobile positioning data. Transportation Research Part C Emerging
Technologies, 18(1), 45-54.
[2] Brin, S., Page, L., 2012. Reprint of: the anatomy of a large-scale hypertextual web search engine. Computer Networks, 56(98), 3825–3833. [3] Castro, P. S., Zhang, D., Li, S., 2012. Urban
Traffic Modelling and Prediction Using Large Scale Taxi GPS Traces. Pervasive Computing. Springer Berlin Heidelberg.
[4] Crucitti, P., Latora, V., Porta S., 2006. Centrality in networks of urban streets[J]. Chaos: An Interdisciplinary Journal of Nonlinear Science, 16: 015113.
[5] Freeman, L C., 1979. Centrality in Social Networks: I. Conceptual Clarification[J]. Social Networks, 1(3):215-239.
[6] Gao, S., Wang, Y., Gao, Y., et al. 2013. Understanding urban traffic-flow characteristics: a rethinking of betweenness centrality[J]. Environment & Planning B, 40(1):135-153. [7] Girvan, M., Newman, M. E. J., 2002.
Community structure in social and biological networks. Proceedings of the National Academy of Sciences, 99(12), 7821-7826.
[8] Jia, T., Jiang, B., 2012. Exploring human activity patterns using taxicab static points. ISPRS International Journal of Geo-Information, 1(1), 89-107.
[9] Jiang, B., Zhao, S., Yin, J., 2008. Self-organized natural roads for predicting traffic flow: a sensitivity study[J]. Journal of Statistical Mechanics Theory & Experiment, 49(7): P07008.
[10] Jiang, B., 2009. Street hierarchies: a minority of streets account for a majority of traffic flow. International Journal of Geographical Information Science, 23(8), 1033-1048. [11] Kang, C., Liu, Y., Wu, L., 2014. Delineating
intra-urban spatial connectivity patterns by travel-activities: a case study of beijing, china. Eprint Arxiv.
[12] Kazerani, A., Winter, S., 2009a. Can betweenness centrality explain traffic flow?, Proceedings of 12th AGILE International Conference on Geographic Information Science, Hanover, Germany.
[13] Kazerani, A., Winter, S., 2009b. Modified betweenness centrality for predicting traffic flow. Proceedings of the 10th International Conference on GeoComputation, Sydney, Australia.
[14] Kerner, Demir, B. S., Herrtwich, C., Klenov, S., 2005. Traffic State Detection With Floating Car Data In Road Networks[J]. Intelligent Transportation Systems , IEEE,44 - 49.
[15] Sousa, S. D., Kropatsch, W. G., 2015. Graph-based point drift: Graph centrality on the registration of point-sets[J]. Pattern Recognition, 48(2):368–379.