UNDERWATER 3D MODELING: IMAGE ENHANCEMENT AND POINT CLOUD
FILTERING
I. Sarakinou*, K. Papadimitriou, O. Georgoula, P. Patias
Department of Cadastre, Photogrammetry and Cartography, School of Rural and Surveying Engineering, Faculty of Engineering, 54124 Aristotle University of Thessaloniki, Greece – [email protected]
Commission II, TeS: WG II/6 Geovisualization and Virtual Reality
KEY WORDS: Underwater Photogrammetry, 3D Modeling, Image Enhancement, Point Cloud Filtering, Geovisualization
ABSTRACT:
This paper examines the results of image enhancement and point cloud filtering on the visual and geometric quality of 3D models for the representation of underwater features. Specifically it evaluates the combination of effects from the manual editing of images’ radiometry (captured at shallow depths) and the selection of parameters for point cloud definition and mesh building (processed in 3D modeling software). Such datasets, are usually collected by divers, handled by scientists and used for geovisualization purposes. In the presented study, have been created 3D models from three sets of images (seafloor, part of a wreck and a small boat's wreck) captured at three different depths (3.5m, 10m and 14m respectively). Four models have been created from the first dataset (seafloor) in order to evaluate the results from the application of image enhancement techniques and point cloud filtering. The main process for this preliminary study included a) the definition of parameters for the point cloud filtering and the creation of a reference model, b) the radiometric editing of images, followed by the creation of three improved models and c) the assessment of results by comparing the visual and the geometric quality of improved models versus the reference one. Finally, the selected technique is tested on two other data sets in order to examine its appropriateness for different depths (at 10m and 14m) and different objects (part of a wreck and a small boat's wreck) in the context of an ongoing research in the Laboratory of Photogrammetry and Remote Sensing.
* Corresponding author
1. INTRODUCTION
The concept of Underwater Photogrammetry is similar to that of terrestrial and aerial photogrammetry. However, the different environment brings on some problems in photogrammetric surveying, mainly due to the different optical properties of water. The main effects in underwater photogrammetry, are:
Light transmission in water: Light transmission in water is reduced by two phenomena, absorption and scattering. The former phenomenon tends to reduce the amount of light corresponding to depth, resulting in the small variety of colors in deep waters. The latter phenomenon, which provokes small light-ray deviations, affects the resolution and contrast of underwater images (Newton, 1989).
Loss of image contrast and resolution: Scattering is the main cause of resolution and contrast loss. In order to confront this loss, close up photography and artificial illumination should be used (Newton, 1989). The latter is usually used in specific applications (Chiang, J.Y. and Ying-Ching Chen, 2012).
The refractive index of water: The refractive index of water at specific conditions is near 1,33. This value changes function of salinity, temperature, pressure and wavelength of the incident light (Newton, 1989). As a result, objects into water appear 1,33 times bigger than their real size.
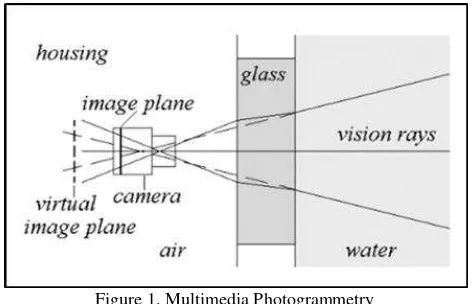
The refraction at the water/glass/air interfaces: Underwater Photogrammetry is a case of multimedia photogrammetry (Figure 1). The three different media that a light beam goes through are water (the area of the object to be photographed),
glass (lens) and air (the space between housing and camera) (Newton, 1989). The different refractive indices lead to inaccurate measurement results.
Figure 1. Multimedia Photogrammetry (Bräuer-Burchardt et al, 2016)
For all the above reasons underwater images are characterized by non-uniform lighting, low contrast, little color variations and blur colors that affect their quality. In Underwater Photogrammetric applications, radiometric enhancement of the images should be considered as an important pre-processing stage. Before their use for 3D modeling.
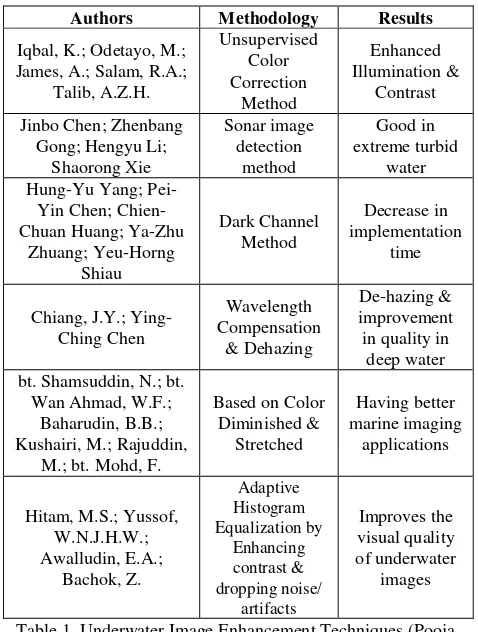
In literature there are various methodologies that are used for the radiometric processing of underwater images. Table 1 includes some of them.
Table 1. Underwater Image Enhancement Techniques (Pooja Sahu et al, 2014)
Within this research, different radiometric image processing techniques have been tested.
On the other hand, the 3D modeling is accomplished through a series of individual processes, which the specialized software proposes. In this research Agisoft has been used for the 3D modeling. According to this software, the 3D modeling procedure is reached through the following steps:
i. The estimation of image quality in order to exclude low quality images in the 3D modeling process.
ii. The process of relative orientation by assigning the common points between the overlapping images (which consequently leads to the creation of a sparse cloud).
iii. The point cloud filtering by checking the estimated locations of sparse cloud’s points.
iv. The densification of the sparse cloud for the production of the main (dense) point cloud.
v. The building of a mesh composed of triangles or polygons, which may optionally include texture information. space can be done after the creation of the 3D model.
A well-known example of such a georeferenced model is the 3D representation of Titanic (Google Earth, 2016).
At each step of the above procedure, the parameters defined by the user lead to different models in terms of visual and geometric quality. Those effects will be examined subsequently.
2. THE UNDERWATER SURVEYING
2.1 Area of Case Study
The area of study was Adrina beach, Panormos, in Skopelos, Greece (Figure 2). Regarding the relief of the beach, it is gentle with smooth inclination near the coast (up to 10m), and it is becoming steeper 50m from the coastline. At a distance of 100m of the coast the depth reaches the 30m. In October 2015 a training course for the PADI Underwater Survey Diver distinctive specialty has been conducted (Papadimitriou, 2015). The participants of this course had previously some experience in underwater mapping and two of them have captured all the data sets that were used in this work (Papadimitriou et al, 2015).
Figure 2. Area of case study. Adrina beach, Panormos, in Skopelos, Greece. © Google Maps (2016)
2.2 Data and Materials
During the above mentioned survey three data sets, have been acquired. The first one (120 photos) depicts part of the seabed of Adrina beach (morphology set – depth 3,5m), the second data set (18 photos – depth 10m) part of a shipwreck of a small boat and the third one (125 frames of a video – depth 12-14m) a whole shipwreck of a small boat. The data have been captured with the Rollei 7S action camera (aperture f2.7, shutter speed 1/100 sec-1/50 sec, ISO 73-140) and their resolution was 4000 x 3000 pixels. For the radiometric processing of the images, Adobe Photoshop CS5.1 64 Bit has been used and for the 3D modeling Agisoft PhotoScan Professional 1.1.6. For extracting frames from video, KMPlayer has been used and the comparison of the produced point clouds has been done with CloudCompare. The used laptop was Lenovo Y50-70.
Authors Methodology Results
Iqbal, K.; Odetayo, M.;
Figure 3. Sample of data set of Andrina’s seabed
Figure 4. Sample of data set of small boat’s section
Figure 5. Sample of data set of shipwreck
3. METHODOLOGY
Τhe aim of this work was to define an optimal technique for the 3D modeling of a selected data set. This data set represents the seabed at Andrina beach.
The technique consists of the digital processing of images in order to enhance their radiometry and the procedure of the point filtering to create the cloud via the definition of the parameters for the 3D modeling procedure.
For the achievement of this aim the following objectives have been set:
i. Test of different sets of parameters and selection of the optimal one, resulting in the creation of a reference 3D model from the underwater images without any treatment in their radiometry.
ii. Application of three different techniques for the enhancement of the radiometry of the underwater images in order to produce three improved models using the optimal parameters (previously selected).
iii. Assessment of the three improved models versus the reference 3D model towards the selection of the radiometric enhancement technique based on visual and geometric evaluation.
iv. Application of the selected radiometric enhancement technique followed by the 3D modeling with the optimal set of parameters in two new sets of images.
3.1 The Selection of 3D Modeling Parameters
3.1.1 Reference model: The reference model (Figure 8) has been produced via Agisoft PhotoScan Professional using the original photos (Andrina’s seabed set), without any kind of radiometric processing. In order to choose the final set of parameters, a series of tests, using different parameters for each step, has been performed. This procedure is described below.
3.1.2 Estimation of image quality: During the automatic estimation of image quality, all the photographs (120/120) have passed the test. According to the 3D modeling software the proposed limit for the inclusion of an image in the procedure is a quality value greater than 0.5.
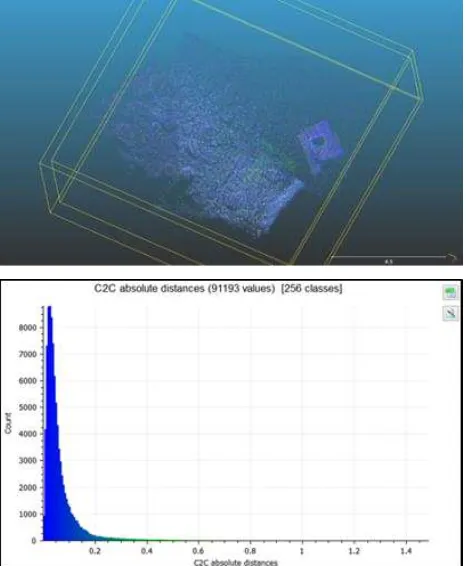
3.1.3 Relative orientation/Sparse cloud: The process of relative orientation in Agisoft, referred as Photo Alignment, includes the creation of the sparse cloud. During this process the software proposes three options for the accuracy parameter (Low, Medium and High). Subsequently two different tests have been done using options Medium and High. The comparison of the results has been done in CloudCompare and the results are shown in Figure 6.
Figure 6. Optical (a) and graphical (b) representation of the difference between the two sparse clouds
As it is represented in Figure 6, the absolute differences between the two sparse clouds are smaller than 0.2 units. Even though the differences are small for this specific data set, High parameter has been chosen for the rest of the tests. In photo alignment process no pair preselection has been defined. The International Archives of the Photogrammetry, Remote Sensing and Spatial Information Sciences, Volume XLI-B2, 2016
3.1.4 Point Cloud Filtering: According to the software, the user can find out and remove from the cloud points based on specified criteria as: high Reprojection error, Reconstruction uncertainty and Image count. Different values for each criterion have been applied. The selection of the final values (Table 2) have been based on the visual inspection. The Image count value has been set to 6 due to the planning and the realization of the shots.
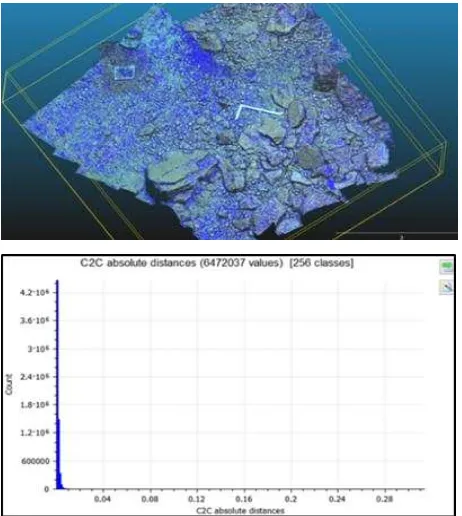
3.1.5 Dense Cloud: For the building of the dense cloud, the software proposes three options for the quality parameter (Low, Medium, High and Ultra High). Subsequently two different tests have been done using options Medium and High. Ultra High parameter has not be examined due to hardware limitations. The comparison of the results has been done in CloudCompare and the results are shown in Figure 7.
Figure 7. Optical (a) and graphical (b) representation of the difference between the two dense clouds
As it is represented in Figure 7, the absolute differences between the two dense clouds are smaller than 0.01 units. Even though the differences are small for this specific data set, High parameter has been chosen for the rest of the tests.
In addition, Aggressive parameter has been chosen for the creation of the dense cloud, as the area to be reconstructed does not contain meaningful small details.
3.1.6 Mesh Building and Texture: For the creation of the mesh, the selection of Height field parameter was the most appropriate option, as the shots have been taken over the object and from a distance of 2.5m. Mesh building was based on the dense cloud. In order to avoid the post processing step for the filling of holes, the interpolation parameter has been set to Enabled.
Although the addition of texture was not necessary in this study, Orthophoto mapping mode has been selected in order to produce the map of the area, as well.
3.1.7 Georeference: While, there were no GCPs, scale bars (a ruler and a carpenter’s square) have been use used for the referencing to a local system (relative coordinates).
Stage Parameters and Values Estimation of Image
Quality 120/120
Photo Alignment (Relative Orientation/Sparse
Cloud)
High, Disabled, 40000 (key point limit)
10000 (tie point limit) (75233 points)
Point Cloud Filtering
Image count=6 Reconstruction uncertainty = 12
Reprojection error = 2 (25616 points)
Dense Point Cloud High, Aggressive (27341033 points)
Mesh Building
Height field Dense point cloud polygon
Interpolation enabled (5449212 faces)
Texture Building
Orthophoto Mosaic 4096 (texture size) Enabled color correction
Georeference No GCPs
Use of Scale bars
Table 2. Parameters used for the creation of the reference model
3.2 The Enhancement of Images’ Radiometry and the 3D
Models
Prior the 3D modeling procedure, the radiometry of the initial images has been enhanced. Three image enhancement techniques and respectively three improved models are described below. The three models were produced using the parameters of Table 2.
3.2.1 Improved model 1: In this case, White Balance process has been applied to all photos of the data set (Figure 8).
3.2.2 Improved model 2: In the second case (Figure 8), a sequence of enhancement techniques has been applied (Table 3).
Initially two filters have been applied to each image. The first filter was the Dust and Scratches, which reduces noise by changing dissimilar pixels. The second filter was the Unsharp Mask, which improves blurry images by increasing the contrast of adjacent pixels.
After that, Channel Mixer has been used for the production of a new and improved image. The mixing colors, that have been used, were based on the RGB color model.
Then, the Levels Adjustments tool has been used for the correction and restoration of the color balance.
Finally, the levels of Hue/Saturation and Brightness/Contrast have been adjusted and a transparency rate has been defined, as well.
All the values of the parameters from the described radiometric process have been listed in Table 3.
Table 3. Parameters of radiometric image processing via Adobe Photoshop
3.2.3 Improved model 3: The radiometric processing of the images in this case (Figure 8) included White balance followed by the sequence of techniques listed in Table 3.
3.3 Assessment
The assessment of the three improved models has been done versus the reference 3D model.
This assessment concerns the visual and geometric evaluation of the results.
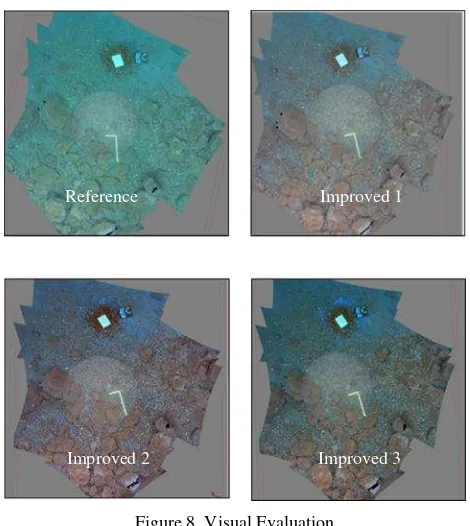
3.3.1 Visual Evaluation: Observing the four models (Figure 8) can be seen that in the reference model the green color dominates. In the improved models 1 and 2 the blue color prevails over green and red. The improved model 3 approaches more the physical color ranging and balances between blue and green, while introduces red color.
The visual quality of improved models 2 and 3 is better due to the application of Unsharp Mask.
According to the above, the improved model 3 is characterized as the best visually.
Reference Improved 1
Improved 2 Improved 3
Figure 8. Visual Evaluation
3.3.2 Geometric Evaluation: Objects of known dimensions (scales bars) have been used for the estimation of the geometric quality, while there were no GCPs for use.
Two objects have been used as scale bars, a carpenter’s square (70cm × 30cm) and a white slate (23cm × 31cm) (Table 4). The scale bars are visible in the four models of Figure 8.
The geometric evaluation has been based on the calculation of the errors between the known and estimated distances (Table 4).
Known Table 4. Known and estimated distances
Table 4 shows that the radiometric process of the images does not affect significantly the geometric quality of the models, as the accuracy of all four models is almost the same.
Improved models 1 and 3 appear the same total error (1,4mm), which is the smallest of the four models’ errors. While the two models have the same error, the improved model 3 will be considered as the “optimal” of the four models, because it combines satisfactory visual result and an efficient geometric quality (1,4mm). Hence the method used in the production of the improved model 3 is considered as the “optimal” for the 3D modeling of the Andrina’s seabed.
Main
Editing Εditing Parameters
Filters
3.4 3D Modeling of Boat’s Section and Small Shipwreck
The chosen, as optimal technique, is applied to the data set of small boat’s section and to the data set of the shipwreck in order to examine its sufficiency for different depths (at 10-14m) and different objects.
Although the shots have been captured in an environment characterized by poor visibility, the application of the selected technique led to qualitative visual and geometrical results (Figures 9, 10, 11, 12).
Here follow the results of Data Set of small boat’s section.
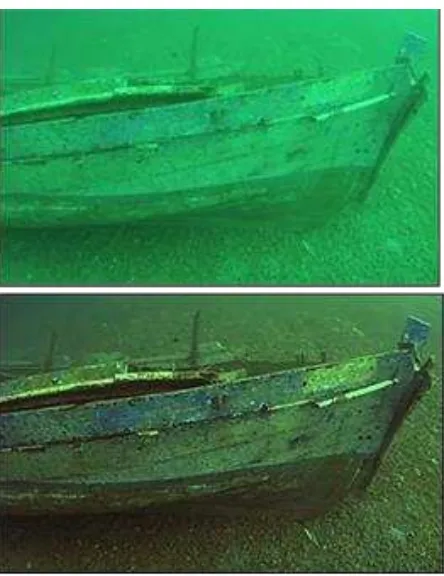
Figure 9. Before (above) and after (below) the application of the radiometric processing of the selected technique
Figure 10. The produced model
Here follow the results of Data Set of Shipwreck.
Figure 11. Before (above) and after (below) the application of the radiometric processing of the selected technique
Figure 12. The produced model
4. GEOVISUALIZATION
During the above procedure GCPs have not been used, hence the produced models are not georeferenced. In order to link with geographic space and allow the geovisualization of the produced models (Figure 13) i) the approximate coordinates of the site (captured with hand-held GPS at a marking buoy on the The International Archives of the Photogrammetry, Remote Sensing and Spatial Information Sciences, Volume XLI-B2, 2016
surface), ii) the measured depth (recorded with dive computer), iii) the approximate orientation (measured with a compass) and iv) measured dimensions (used as scale bars) of distinguishable linear features (e.g. carpenter's square, foldable rulers, bow to stern axis) have been used.
Figure 13. The model of the shipwreck in Google Earth. © Google Earth (2016)
5. CONCLUSIONS
The radiometric processing of the images plays a principal role in underwater 3D modeling applications as enhances in a great extend the visual quality of the product. For different conditions (e.g. depth, visibility), appropriate radiometric techniques should be tested and applied.
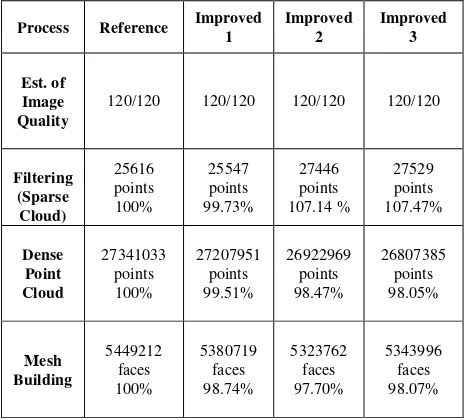
Although the radiometric pre-processing of the images is appeared not to be crucial on the geometric quality of the models, Table 5 shows that the kind of image enhancement technique applied leads to a different number of points. This issue needs further study and specifically for geovisualization applications e.g. marine biology, construction monitoring, underwater archaeology, etc.
Table 5. The results of the 3D modeling stages
ACKNOWLEDGEMENTS
The Authors would like to thank Skopelos Dive Center for the provision of the diving facilities and scuba diving equipment and especially Ines Cherif and Marios Giannourakos for capturing the images that were used in this work.
REFERENCES
Bräuer-Burchardt, C., Heinze, M., Schmidt, I., Kühmstedt, P., Notni, G., 2016. Underwater 3D Surface Measurement Using Fringe Projection Based Scanning Devices, Sensors, No. 1: 13.
Chiang, J.Y., Ying-Ching Chen, 2012. Underwater Image Enhancement by Wavelength Compensation and Dehazing, Image Processing, IEEE Transactions on Image Processing, Vol.21, No.4, pp. 1756-1769.
Newton, I., 1989. Underwater Photogrammetry. In: Non-Topographic Photogrammetry, Second Edition, H. M. Karara (Ed.). American Society for Photogrammetry and Remote Sensing, pp. 147-176.
Papadimitriou, K., 2015. Course Outline for a Scuba Diving Specialty "Underwater Survey Diver", Int. Arch. Photogramm. Remote Sens. Spatial Inf. Sci., XL-5/W5, pp. 161-166.
Papadimitriou, K., Ktistis, A. and Sarakinou, I., 2015. Underwater recording and 3d modeling during a dive training course: A case study at Panormos, Skopelos, Greece, Journal of Environmental Science and Engineering A 4, pp. 445-454.
Pooja Sahu, Neelesh Gupta, Neetu Sharma, 2014. A Survey on Underwater Image Enhancement Techniques, International Journal of Computer Applications, Vol. 87, No.13, pp. 19-23.
Agisoft LLC. 2014. Agisoft PhotoScan User Manual: Professional Edition.
http://www.agisoft.com/pdf/photoscan-pro_1_1_en.pdf (accessed April 15, 2016).
Titanic Wreck in 3D in Google Earth 5.
http://www.gearthblog.com/kmfiles/titanic.kmz (accessed April
15, 2016).
Using ADOBE® PHOTOSHOP® CS5.
http://help.adobe.com/en_US/photoshop/cs/using/photoshop_cs
5_help.pdf (accessed April 15, 2016).
Process Reference Improved
1
120/120 120/120 120/120 120/120
Filtering