3D G E O -I NF O R M A T I O N I N UR B A N C L I M A T E S T UD I E S
F . Petrescu a, *, M . A ldea a, O. L uca a, C . Iacoboaea a, F . Gaman a, E . Parlow b
a
Urban E ngineering and R egional Development D epartment, T echnical University of C ivil E ngineering B ucharest, B d. L acul T ei 124, sector 2, 020396 B ucharest, R omania - ( florianp, imihaela, oana, cristinai, gflorin)@ utcb.ro
b
Meteorology, C limatology and R emote S ensing (M C R L ab) , D epartment of E nvironmental Sciences, University of B asel, K lingelbergstr. 27, C H-4056, B asel, S witzerland – eberhard.parlow@ unibas.ch
K E Y W OR D S : 3D geo-information, Urban climate, Urban planning, Urban climate characteristics, Numerical models
A B S T R A C T :
3D geo-information is essential for urban climate studies. It is obvious that both natural environment and built-up environment play the fundamental role in defining the climatic conditions for urban areas, which affect the quality of human life and human comfort. T he paper presents the main categories of 3D geo-information used in urban climate studies and roles in creating and operating the numerical models specially designed to simulate urban planning scenarios and improvement of the urban climate situation.
* C orresponding author
1. I NT R O D UC T I O N
Urban climate is quite different from that of rural areas. A complex heterogeneous urban morphology and sealed surfaces with different thermal inertia contribute to varying urban microclimates with different impacts on the bioclimatic conditions for the inhabitants.
T he methodologies used are in some studies surface
measurements of radiation, heat and C O2 fluxes by eddy covariance measurements and gas analysers, others prefer a
remote sensing approach using space-borne or air-borne
imagery, and finally in many applications oriented studies
numerical models are integrated to compute various possible
scenarios of the urban design and architecture. T he remote
sensing approach to study the urban climate is mostly done by
using thermal infrared data. Urban surfaces often show higher
temperatures compared to their rural surroundings.
T he determination of urban surface radiation balance or the heat
fluxes encounters several difficulties because of the
inhomogeneous surface in urban areas. T he energy balance and
therefore the storage flux are influenced by radiation balance
and the surface radiation fluxes of urban canyons. F urthermore
the radiation budget cannot be modelled without taking into
account the complex 3D -geometry of roofs, walls and buildings.
T he parameterisation of the geometry of urban canyons remains
therefore a crucial problem to this field of research, especially
when working with satellite data whose spatial resolution stays
below the size of buildings. A very detailed investigation on the
influence of the 3D -geometry of urban structures on spatially questions related to the urban climate by simulating scenarios
for parameters such as the Predicted Mean V ote (PMV ) index, the Sky-V iew F actor ( S V F ) , temperature, the main wind flow, albedos, and humidity and C O2 density.
S ection 2 presents the main urban climatic characteristics, while section 3 deals with the integration of numerical models especially designed to simulate urban planning scenarios for the improvement of the urban climate situation. T he model used is E NV I-met, which is widely applied in other countries.
T he results obtained by running the E NV I-met model are
presented in the 4th section, which is dedicated to the B ucharest study case.
2. UR B A N C L I M A T I C C H A R A C T E R I S T I C S
T he main factors influencing the urban microclimate are usually contributing to the manifestation of the urban heat island effect, the air masses movement at the pedestrian-level and the quality of air. T hese factors are generally: the surface geometry, the thermal properties of the urban materials, the surface imperviousness, the anthropogenic heat and the air pollution.
T he climatic conditions for urban areas which affect the quality of human life and human comfort are mostly related with: temperature, wind, air composition, humidity.
T emperatures in the city are generally higher than in their rural
vicinity. W alls and roofs of the buildings and asphalt pavements
have higher radiation surface than open lands yielding higher
pressure region in the atmosphere, have a continuous flow from
rural to urban areas but also the wind speed is greatly reduced
due to the the increased friction created by a rough urban The International Archives of the Photogrammetry, Remote Sensing and Spatial Information Sciences, Volume XLII-2/W2, 2016
surface. W ind is affected by the 3D configuration of the
buildings as the wind may be channeled around buildings,
between buildings or along avenues causing accelerated wind
speeds at pedestrian level and giving rise to pedestrian
discomfort. W ind can also be influenced by high-rise buildings
which form a configuration that blocks the wind, these sheltered
areas experiencing insufficient air circulation and diminished
natural ventilation. water in unsealed land cover resulting in more energy is put into sensible heat than into latent heat (S antamouris, 2001). Green vegetation can also decrease air temperature by transpiration of an important quantity of water. (Matczak, McE voy, B anaszak, & C horynski, 2005) .
3. F R OM M E A S UR E M E NT S T O M OD E L
A ll the factors mentioned in the previous section which influence the urban microclimate can be included into a 3D city model which can integrate all the characteristics of the surface geometry by the 3D modelling of the buildings and of the city trees, as for the thermal properties of the urban materials, the surface imperviousness, the anthropogenic heat and the C O2
levels, they can be attached to the land cover type.
T he computational fluid dynamics (C F D ) has become more intensively used in order to perform design simulations for quantitative analyses of the urban effects on climate and in pre-evaluation of certain urban developments in urban planning ( Y ang, W en, C heng, & J uan, 2015) . T hus, (B ruse, 2004) lays out the approach for the 3D non-hydrostatic urban-climate model, E NV I-met, in which the main prognostic variables in the atmospheric model are: the main wind flow, temperature, humidity and turbulence.
T he E NV I-met microclimate C F D model has been used to simulate interactions between urban surfaces, vegetation and the atmosphere in many studies (K im, A n, E um, & W oo, 2016) .
T he input parameters of an E NV I-met simulation are mainly represented by the 3D structure of the urban surfaces and vegetation, together with their physical properties, followed by the measured values for the initial or forced meteorological conditions. It should be pointed out that E NV I-met produces a numerical simulation constructed on the 3D representation of the city volumes and that the measured terms are set globally for the entire area. It is expected that the results are representative for the 3D city model integrated response of the buildings, roads, vegetation etc. Other than the measurements, which set the global model boundary condition, the measurements are best used for validation purposes, as long as the measurement points are the same as the receptors selected for E NV I-met simulations. It should be also pointed out that E NV I-met cannot be used for the assessment of anthropogenic heat emissions ( B erardi & W ang, 2016).
T he results from the C F D simulations in models such as E NV I-met can be considered at a micro scale which usually to covers a horizontal length ranging from 100 to more than 1000 m, such mapping out the factors indicating the relationship between urban geometry, land cover and urban wind ventilation and micrometeorological measurements. T he instruments mounted at the site provide different sets of urban micrometeorological measurements and outputs. A n IR GA S ON Integrated C O2/H2O Open-Path Gas A nalyser and 3D S onic A nemometer which measures and outputs orthogonal wind components, sonic temperature, densities of carbon dioxide and water vapour, air temperature and air pressure. A C NR 4 Net R adiometer measures the individual components of the radiation balance by outputting upward and downward short-wave solar radiation and long-wave far infrared radiation values. T he general meteorological conditions are measured by a V aisala W X T 520 W eather T ransmitter which outputs air temperature, relative humidity, air pressure, wind speed, wind direction and precipitation.
T he local meteorological data for B ucharest introduced in the model as inputs for the meteorological conditions are based on the average annual local atmospheric wind conditions, which rely on historical meteorological data provided by the R omanian Meteorological S ervice and also based on the local measurements of the flux tower placed on the University Dorm building.
T he C F D simulation of the 3D B ucharest model was conducted with both versions of the E NV I-met model that is 3.1 (W icki, et al., 2015) and 4, for various dates. F or example, one of the selected date was the 29th of J uly, which was one of the hottest days in 2015. T he main variables estimated in the E NV I-met model and presented next are: the Predicted Mean V ote (PMV ) index, the Sky-V iew F actor ( SV F ), temperature, the main wind flow, albedos, and humidity and C O2 density. It should be mentioned here that the Predicted Mean V ote is a thermal comfort index ( F anger, 1982) which relates the energy balance of the human body with the human thermal impression by an empirical function and it ranges from -4 (very cold) to +4 ( very hot) where 0 is the thermal neutral (comfort) value. Our E NV I-met simulation produced estimation values which seem to be related to the shadowed areas and high vegetation ( trees) as it is shown in F igure 1.
F igure 1. T he simulated index of Predicted Mean V ote related
to the shadowed areas and high vegetation ( trees)
T he sky view factor ( S V F ) was introduced by (W atson & J ohnson, 1987) and is calculated as the fraction of sky visible when viewed from the ground upward. SV F is dimensionless and ranges from 0 ( sky is not visible) to 1 ( sky is completely visible). T he E NV I-met simulation produced the SV F presented in F igure 2, and which is an important parameter which can be used in the consideration of the possibility of the development of the UHI effect ( Oke, 1987) .
F igure 2. T he simulated Sky V iew F actor pointing out areas
with the sky almost not visible.
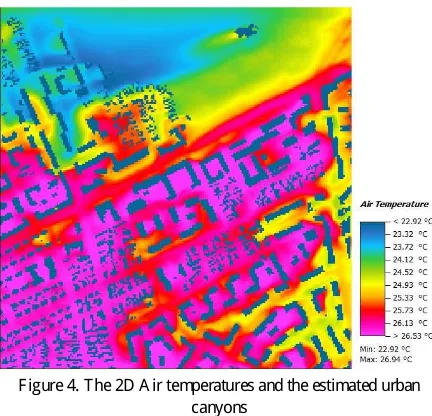
T he simulated air temperatures are presented in F igure 3 sectioned by a plane at the elevation z=1.4 m which is usually affecting human size and F igure 4 which distinguishes the warmer urban canyons in the entire district, produced as a consequence of the 0.2 S V F and albedos.
F igure 3. T he 3D A ir temperatures at the elevation z=1.4 m
F igure 4. T he 2D A ir temperatures and the estimated urban
canyons
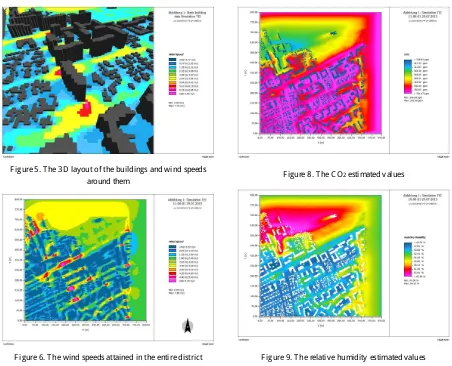
T he wind flow was also estimated for the entire district and presented in F igure 5 in a 3D setting presenting the speeds attained around the area of our measurement flux tower, in F igure 6 in a 2D layout showing the direction vectors together with the vertical wind profiles in the x direction ( F igure 7) . The International Archives of the Photogrammetry, Remote Sensing and Spatial Information Sciences, Volume XLII-2/W2, 2016
F igure 5. T he 3D layout of the buildings and wind speeds
around them
F igure 6. T he wind speeds attained in the entire district
F igure 7. T he wind profile in the y-z plane
T he C O2 estimated values are closely related with the vegetation cover as it is shown in F igure 8, with the vegetation and the sealing level of the land cover being also related the humidity in F igure 9.
F igure 8. T he C O2 estimated values
F igure 9. T he relative humidity estimated values
5. C ONC L US I O NS
T he aim of this paper was to run E NV I–met numerical model in order to understand the climatic effect of the 3D city model and land cover types over which kind of estimates and simulations are possible for past or future situations in order to determine the urban climate conditions. T he firs type of analysis which was conducted referred to the evaluation of the present state of the urban microclimate, the estimation of influencing factors over certain outputs and correlations between different parameters can be calculated, and the best areas suitable for human comfort can be assessed.
T he second type of analysis that can be done so far concerns the various comparisons between the values of different parameters measured by the instruments on the flux tower and the microclimate modeling results from E NV I-met.
T he third type of analysis consists in estimating the urban climate before and after the new configurations of the site are simulated and compared ( like newly proposed constructions) . Particular comparisons can be done regarding to the influence of the vegetation and to the use of high albedo materials.
T o conclude, for a more accurate assessment of the microclimatic conditions at the local level of the selected urban area, the 3D information is essential for obtaining a reliable climate model. A lso, the 3D city model can be successfully used The International Archives of the Photogrammetry, Remote Sensing and Spatial Information Sciences, Volume XLII-2/W2, 2016
as input for the 3D parameters in an advanced 3D -4D ( including time series) environmental model like E NV I-met. Our work proved that, in order to assess and quantify the small to larger-scale climatic impacts, numerical models which have the capacity to simulate the future behavior of the climatic parameters and of human comfort should become an integrated part of the information system of any city and a base for urban planning decision.
A C K NO W L E D G E M E NT S
T his work was supported by the S wiss E nlargement C ontribution in the framework of the R omanian-S wiss R esearch Programme, under project number IZ E R Z 0_ 142160 entitled Urban C limate S tudy of B ucharest.
R E F E R E NC E S
B erardi, U., & W ang, Y ., 2016. T he E ffect of a D enser C ity over the Urban Microclimate: T he C ase of T oronto. Sustainability 2016, 8(8) , 822.
B ruse, M., 2004. E NV I-met 3.0: updated model overview. R etrieved from www.envi-met.com (29 J ul. 2016) .
F anger, P. O., 1982. T hermal C omfort. A nalysis and A pplication in E nvironment E ngineering, McGraw Hill B ook C ompany, New Y ork.
F rey, C . M. & E . Parlow, 2008. Geometry effect on the estimation of band reflectance in an urban area. Theoretical and Applied C limatology, 96, p. 395-406.
K im, Y ., A n, S., E um, J ., & W oo, J ., 2016. A nalysis of T hermal E nvironment over a Small-S cale L andscape in a Densely B uilt-Up A sian Megacity. Sustainability, 8(4) , 358.
Matczak, P., M cE voy, D ., B anaszak, I., & C horynski, A ., 2005. Green infrastructure in urban areas. L ondon: ME A, 2005 ME A, E cosystems and Human Well-Being, Synthesis, Island Press.
Oke, T . R . 1987. Boundary L ayer C limates. 2nd, Methuen and C o, New Y ork.
S antamouris, M., 2001. On the built environment-the urban influence. In V . A. D .N. Asimakopoulos, E nergy and C limate in the U rban Built E nvironment. New Y ork: R outledge T aylor & F rancis Group.
Y ang, A ., W en, C ., C heng, C ., & J uan, Y ., 2015. C F D S imulations to Study the C ooling E ffects of D ifferent Greening Modifications. Y A NG, A n-S hik, et al. C F D Simulations to S tudy the C ooling E ffects of D ifferent Greening Modifications. World Academy of Science, E ngineering and Technology, International J ournal of E nvironmental, C hemical, E cological, Geological and Geophysical E ngineer, 9(7) , 808-814.
W atson, I.D ., and G.T . J ohnson. 1987. Graphical estimation of sky-view factors in urban environments. J ournal of C limatology, 7, 193–197.
W iki, A ., V ogt, R ., Parlow, E ., & Petrescu, F ., 2015. A nalysis and modelling of meso- and micro-scale urban climate in B ucharest, R omania. IC UC 9 - 9th International C onference on
Urban C limate jointly with 12th Symposium on the Urban E nvironment, 20-24 J uly 2015, T oulouse, F rance
Revised August 2016