A SCHEMA FOR EXTRACTION OF INDOOR PEDESTRIAN NAVIGATION GRID
NETWORK FROM FLOOR PLANS
Lei Niua,*, Yiquan Songb
a School of Surveying Engineering, Henan University of Urban Construction, Postcode 467036, Pingdingshan, Henan,
China, [email protected]
b Faculty of Urban and Environmental Science, Tianjin Normal University, Postcode 300387, Tianjin, China,
Commission IV, WG IV/7
KEY WORDS: Indoor; pedestrian navigation grid; extraction; floor plan
ABSTRACT:
The requirement of the indoor navigation related tasks such emergency evacuation calls for efficient solutions for handling data sources. Therefore, the navigation grid extraction from existing floor plans draws attentions. To this, we have to thoroughly analyse the source data, such as Autocad dxf files. Then, we could establish a sounding navigation solution, which firstly complements the basic navigation rectangle boundaries, secondly subdivides these rectangles and finally generates accessible networks with these refined rectangles. Test files are introduced to validate the whole workflow and evaluate the solution performance. In conclusion, we have achieved the preliminary step of forming up accessible network from the navigation grids.
* Corresponding author.
1. INTRODUCTION
Due to the urbanization process of our modern society, the indoor navigation becomes a key topic than ever, and the source data support for this subject also draws researchers’ attention. To answer this call, we have to provide the navigation information about the connection relationships between different spatial subdivisions, due to that the proper organization of indoor navigation space begins from the proper subdivision and index of building space (Mura, Mattausch et al. 2014, Niu and Song 2015).
To this, there are many solutions introducing equal size unit like hexagons, squares and even circles to subdivide the indoor navigation space. Each solution has its characteristic: hexagon shape has the best spatial utilization efficiency but suffers from moving direction statements; square shape has the disadvantage of unequal step length along octal directions; circle has the equal length from centre to boundary but with obvious gaps between units (Meulemans, van Renssen et al. 2010, Zlatanova, Liu et al. 2013, Krūminaitė and Zlatanova 2014). As another sounding choice, the extraction of variable size navigation grids from existing floor plans become an important approach. Following this approach, three important milestones have to be achieved: the boundary complementation, the rectangular subdivision and the indoor navigation network generation.
For the first step, although there are some spatial barriers between existing functioning areas like walls, they do not form continuous boundaries with openings like doors. Thus, to face this challenge, the indoor spatial boundaries have to be complemented to generate topologically correct regions. Logically, the next phase is to utilize these boundaries to cut the whole building regions into several rectangular areas. This process needs to thoroughly analyse the neighbouring area near each boundary, and generates the proper subdivision of the
studying area. The final step of the navigation grid network generation is to refine graphs from the formed subdivided rectangles. The mechanism for this process is to generate nodes after analysing the neighbouring rectangles, and form edges connecting these nodes by studying the neighbouring nodes relationships.
This paper is organized as follows: The second part describes the existing researches to extract grid networks from stored files; the third part elaborates the detail mechanism of the boundary processing; the forth part documents the accessible information extraction process; the fifth part demonstrates the experiment to validate the proposed method; the sixth part introduces a discussion of our solution by analysing the experiment result; the final part summarizes the pros and cons of our method.
2. LTERATURE REVIEW
Previous studies about the indoor space subdivision could be originated from three main sources: the triangluarization approach, the grid approach and the rectangle approach. The first approach starts from introducing the topological relationships. This branch usually follows the establishment of the Thiessen triangles that are generated by the analysis of the Voronoi diagram (Gold and Angel 2006, Xu, Kruminaite et al. 2013, Zlatanova, Liu et al. 2013). Due to that the Voronoi diagram is formed by perpendicular subdivisions of the connection lines between two neighbour points (Zlatanova, Liu et al. 2013, Krūminaitė and Zlatanova 2014). The output of the triangular subdivision of the accessible space always benefit from efficient subdivisions of the problem area. Nevertheless, this kind of subdivision may lack of semantic information for a specific navigation purpose. In other words, the subdivision result may not be closely related to the ground truth like doors connecting rooms and corridors(Yang and Worboys 2011, Khider, Kaiser et al. 2012).
The second approach divides the whole research area into legions of regular grids. These grids are large in quantity, and have simple spatial relationships among them. This is to say, each grid may only hold the accessible or inaccessible attribute with related spatial relationships kept to the minimum level. Therefore, the whole navigation space is transferred into an accessible attribute matrix, and the difficulty of this approach lies in the proper formulation from the complex accessible environment to matrixes. Thus, the boundary and inner set detection is the key issue for the accessible space transformation (Kläß, Stückler et al. 2012, Zlatanova, Liu et al. 2013).
As for the last approach, the rectangular subdivision of the navigation area is quite new and challenging. This approach requires both the comprehension of the research area, and an efficient handling of the space subdivision. It means both the qualitative and quantitative of the problem area is mandatory: The complete topological wrapping is required to distinguish the inside and outside for the specific polygons, and the detail geometric information such as coordinates of the vertex is also required to form a complete perspective of the study area (De Berg and van Kreveld 1994, Niu and Song 2013, Song and Niu 2015).
3. PRE-PROCESSING OF THE SPACE BOUNDARIES
The pre-processing here means the existing errors of the source file should be corrected, and then we could utilize this information to further subdivide indoor space and extract the navigation information. These errors consist of the gap between lines, multi-break points for one line, and loss of semantic information in AutoCAD files. They are mainly caused by the accuracy loss during the digitization process and misoperation of users.
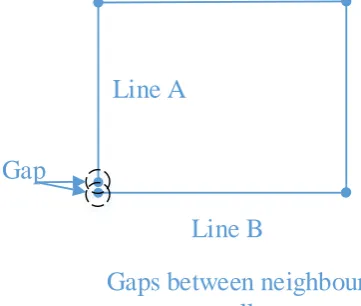
The gap between lines represents that lines of two intersected wall boundaries have distances between the expected intersection points, due to the improper operations of the digitization (figure 1). At first glance, this error may not significantly hinder the whole structure of the geometric boundaries, but it could cause an improper opening on the outer closure for a specific polygon. This problem could be resolved by the linkage of the boundary points. In details, it is fulfilled by the operation of searching gap ends along certain directions that are below a pre-defined threshold.
Line A
Line B
Gap
Gaps between neighbour
walls
Figure 1. Gaps between expected overlapping end points of walls
The false point problem exists along a single boundary line, and could be classified into two minor types: First is the false breaking of lines, and second is the false overlapping of lines (figure 2 and 3). They are also introduced by the error in the drawing process of the wall lines, and should be handled with the completion of the same line. In a nut shell, the correcting operation follows one rule: Line segments along the same direction, which are not perpendicular, should form a new line. Rather, these points are the false breaking or overlapping nodes for the same line, and line segments between these points should be unified (figure 4). Then a complete line crossing the previous break points are generated.
Line A ends
Line A
’
ends
False breaking of
lines
Figure 2. False breakings for walls
Line A ends
Line A
’
ends
False overlapping of
lines
Figure 3. False overlapping of wall boundary lines
Fused new line
Fusion of false lines
Figure 4. Fusion of false linesThe final problem besetting stakeholders is the loss of semantic information. As is known to all, the digitization and
transformation of the building geometric process is the accumulation of the information loss. This problem should be tackled by the introduction of the expert knowledge either automatically or manually. This means the operations such as transforming door polygons into the door layer and the stair polygons into stair layers are mandatory. In addition to this, the usage of the expert knowledge may also cover the topic of allowing the door bounding boxes to complete the topological boundary of room bounding objects.
4. ACCESSIBLE INFORMATION EXTRACTION
This part elaborates the whole workflow to generate accessible rectangles. It contains three parts: the boundary extraction part, the rectangle extraction part and the network formation part. The first part finishes the task of extracting rectangular boundaries that is the base of next step; the second part fuses boundaries into complete rectangles; the final part establish a navigation network based on the extracted rectangles and their spatial relationships.
4.1 Boundary extraction
The boundary extraction is mainly composed of four parts: fusing the tedious line segments, filling gap operation, refusing the line and the breaking points generation.
Room boundaries and their complementation
Figure 5. Room boundaries and their complementation method
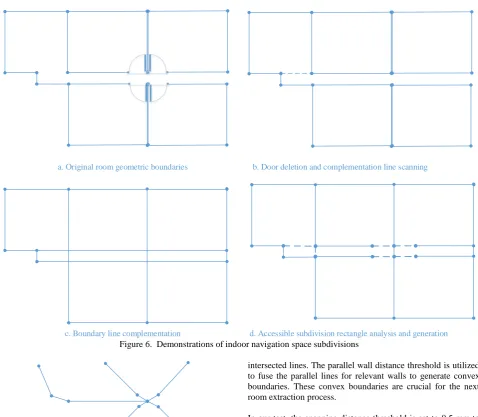
Firstly, we prepare the rectangle boundary lines for the usage of the next step, and this demands the small line segments along axis parallel lines to be fused (figure 5). This is achieved by the fusion of line segments within an acceptable threshold along axes directions. This fusion operation runs both along the searching direction and its perpendicular direction (figure 6a). During this progress, the fusion integrates lines within a specific distance threshold both following the direction and perpendicular direction, and then produces a thicker boundary line to reduce the computational burden for the subdivision process.
The second step of filling gap between lines is rarely observed in other solutions. Because among our data sources like dxf files, there are many building beams forming up the wall boundaries distributed along a specific direction. Intuitively, we
could connect these wall boundaries by adding virtual lines to produce long lines to minimize the complexities of spatial subdivisions and rectangle generation (figure 6b).
Third, we utilize the pre-fused tedious lines and filling gap lines to generate the final input lines for the breaking point operation (figure 6c). The lines produced after this process will extend the boundaries surrounding indoor space to the maximum level to wrap all candidate accessible rectangles.
The last step mainly uses generated direct lines broken up during the pre-processing process. Applying this operation could create the base point map for the accessible rectangle generation phase. This process needs to scan intersection points between pre-generated long fusion lines, and then searching among these breaking points to sort them by four in each group. (figure 6d)
4.2 Rectangle extraction
This operation refines rectangles from the previously generated breaking points. As mentioned before, these points are organized in four and have to be closest neighbours and clockwise. The reason for not considering the anti-clockwise direction is that we could always find the same group of points that goes clockwise, if these four points are really the closest neighbours.
After the grouping of refined points, they are traversed clockwise and connected with line segments to produce sealed rectangles. Many unexpected break points may appear between corners of rectangles, but this issue could be fixed by connecting points along one direction before meeting any perpendicular intersection.
4.3 Network formation
The network formation is mandatory for the future navigation related applications. Thus, the extracted rectangles are analysed according to their neighbouring relationships. In other words, the neighbouring rectangles are transferred into nodes with edges connecting them, otherwise we have to load the whole network to tackle the navigation issues. In addition to this, the related semantic information is also required to help the processing of the network generalization. Rather, if two rooms are neighbours and separated by virtual walls, then they should be connected by an accessible edge across non-existing virtual borders.
In our solution, as the minimum semantic information is available, thus, only walls, windows and doors attribute are provided. We utilize simple intuitive principles, such as “walls
surrounding accessible spaces” and “doors connecting
accessible spaces through walls” to initialize the basic connectivity graph of the building indoor space (figure 7).
The network graph in figure 7 is extracted from figure 6, which is easily observed that rooms of figure 6 is represented by nodes, and their spatial neighbouring connections are represented by edges in figure 7.
a. Original room geometric boundaries b. Door deletion and complementation line scanning
c. Boundary line complementation d. Accessible subdivision rectangle analysis and generation
Figure 6. Demonstrations of indoor navigation space subdivisions
Extracted connectivity graph by introducing semantic information
Figure 7. Extracted connectivity graph by introducing semantic accessible information
5. EXPERIMENT
The experiment area is the teaching building 7 in the Henan University of Urban Construction (HUUC). This facility has 8 lecture rooms and 80 offices, and plays an important role in the teaching operations in the university campus. Thus, the successful extraction of the indoor space and navigation graph is crucial for the emergency management and campus navigation applications.
To start the experiment, we have to first initialize the test environment with carefully choosing parameters. There are several key operational parameters in the whole experiments. The most crucial ones are the snapping distance between end points, the spatial neighbour searching threshold and parallel wall distance threshold. The snapping distance between end points is in charge of detecting the redundant points of the real positions. The spatial neighbour searching threshold is introduced to address the spatial neighbour detection between
intersected lines. The parallel wall distance threshold is utilized to fuse the parallel lines for relevant walls to generate convex boundaries. These convex boundaries are crucial for the next room extraction process.
In our test, the snapping distance threshold is set to 0.5 mm to avoid the accuracy loss prevalent in the collected AutoCAD dxf files. In other words, the points that have distance less than 0.5 mm is treated as one. Besides, the spatial neighbour searching threshold is set to be 650 mm along the X axis and Y axis. Namely, the parallel lines among the buffer with the radius of 650mm are snapped into one line. The reason to choose this figure is that we ran several experiments on the different figures from 300 mm to 700 mm, and found the 650 mm setting generates the most sounding subdivision result of the indoor navigation space.
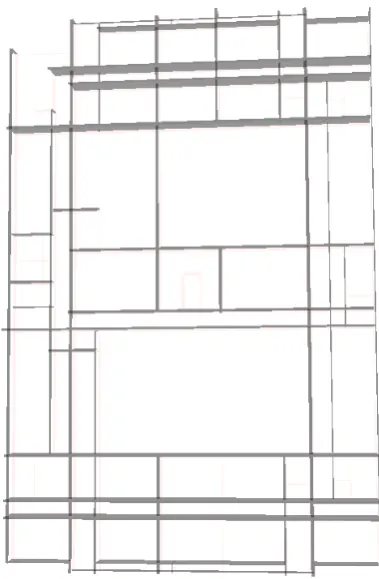
For the experiment data and process result demonstration, we show three figures. Figure 8 is the dxf file snapshot about the 2nd floor plans of the HUUC teaching building 7. Figure 9 is about the fusion line generation result. Figure 10 is the final accessible extraction result of the experiment file, and the grey grids are the extracted accessible rectangles. Figure 11 is the navigation graph refined from the figure 10, and the brown thick lines are the accessible edges connecting the nodes in the navigation graph. Figure 9 to figure 11 are of little distortion compared to figure 8, due to the different projection methods and view point between these two groups. The generation time cost for these figures are below 10 minutes.
Figure 8. Snapshot for the second floor of the HUUC 7 building
Figure 9. Extracted wall boundaries for the test area
Figure 10. Extracted navigation grids for the experiment area
Figure 11. Extracted navigation graph for the experiment area
6. DISCUSSION
From the experiment result, we could observe three prominent phenomena. First is that the ideal problem solving plan is not flawless with the real data. Miscellaneous errors existing in real data could seriously prohibit the solution even from functioning, such as the improper drawing of the wall boundaries with the inconsistent line numbers. Thus, the tuning and exception handling operation is always mandatory to face the challenges caused by the real production data.
Second point that should draw attention is the introduction of some innovative solutions for the problems of existing data. Rather, the filling gap operation for the beam connecting line is not easily to be proposed without a thorough examination of AutoCAD files. And this human interference will greatly hinder the efficiency to deal with large volume data. Thus, the combination of the topological relationships with the domain expert knowledge is also crucial for accessible space extraction.
The last but not the least point is the navigation space extraction operation is tightly related with the connection features during the navigation space. Thus, the doors and stairs play the most important role in the current studies. However, the subdivision operation should also keep some virtual lines between accessible rectangles, and these virtual lines play the role of accessible rectangular boundaries and connectors at the same time. then refine the accessible rectangles and navigation network from the pre-processed lines. This solution is also robust against the accuracy loss and miscellaneous errors prevalent in the production data.
The next step work is first to propel this solution to the true 3D situation, which consists of many vertical connections of geometric objects. Second, we should also improve the spatial subdivision method to tackle more complex and tedious building floorplans, and consider multiple digitization method such as triangulation or polyhedronization (using polyhedron to subdivide the indoor space).
8. REFERENCES
De Berg, M. and M. van Kreveld (1994). "Rectilinear decompositions with low stabbing number." Information processing letters 52(4): 215-221.
Gold, C. and P. Angel (2006). Voronoi hierarchies. Geographic Information Science. Heidelberg, Germany, Springer: 99-111.
Khider, M., S. Kaiser and P. Robertson (2012). "A novel three dimensional movement model for pedestrian navigation." Journal of Navigation 65(02): 245-264.
Kläß, J., J. Stückler and S. Behnke (2012). Efficient Mobile Robot Navigation using 3D Surfel Grid Maps. the German Conference on Robotics, Munich, Germany.
Krūminaitė, M. and S. Zlatanova (2014). Indoor space subdivision for indoor navigation. the Sixth ACM SIGSPATIAL International Workshop on Indoor Spatial Awareness, Dallas, Texas, USA, ACM.
Meulemans, W., A. van Renssen and B. Speckmann (2010). Area-preserving subdivision schematization. Geographic Information Science. Heidelberg, Germany, Springer: 160-174.
Mura, C., O. Mattausch, A. J. Villanueva, E. Gobbetti and R. Pajarola (2014). "Automatic room detection and reconstruction in cluttered indoor environments with complex room layouts." Computers & Graphics 44: 20-32.
Niu, L. and Y. Song (2013). An automatic solution of accessible information extraction from CityGML LoD4 files. 21st International Conference on Geoinformatics (GEOINFORMATICS) 2013, IEEE.
Niu, L. and Y. Song (2015). "A Survey of Indoor Positioning Technology from Dual Aspects in the Emergency Responding." International Journal of Emergency Management 11(1): 76-88.
Song, Y. and L. Niu (2015). "A Grid-based Graph Data Model for Pedestrian Route Analysis in a Micro-spatial Environment." International Journal of Automation and Computing.
Xu, W., M. Kruminaite, B. Onrust, H. Liu, Q. Xiong and S. Zlatanova (2013). "A 3D Model Based Indoor Navigation System for Hubei Provincial Museum." ISPRS-International Archives of the Photogrammetry, Remote Sensing and Spatial Information Sciences 1(4): 51-55.
Yang, L. and M. Worboys (2011). A navigation ontology for outdoor-indoor space: (work-in-progress). ISA '11 Proceedings of the 3rd ACM SIGSPATIAL International Workshop on Indoor Spatial Awareness.
Zlatanova, S., L. Liu and G. Sithole (2013). A conceptual framework of space subdivision for indoor navigation. Proceedings of the Fifth ACM SIGSPATIAL International Workshop on Indoor Spatial Awareness, ACM.